... an SMT-selection metric that predicts the change in application performance when the SMT .... used in the field is not the same as that used for original testing, and if the ..... 5.2.2.3. the Java benchmarks use the 64-bit IBM JVM version. 1.6.0.
An SMT-Selection Metric to Improve Multithreaded Applications’ Performance Justin R. Funston, Kaoutar El Maghraoui, Joefon Jann, Pratap Pattnaik, Alexandra Fedorova* IBM T.J Watson Research Center
I. I NTRODUCTION The VLSI technologies of the past few years, while giving significant increases in transistor density, have not been able to deliver corresponding increases in transistor performance. One of the architectural techniques used in improving the overall performance of a wide range of applications has been Simultaneous Multithreading (SMT) [1]. It is designed to improve CPU utilization by exploiting both instruction-level parallelism and thread-level parallelism. The first extensive use of SMT in a commercial processor design was for Alpha 21464 (EV8), which was slated for 2004, but did not make it to the market. Intel’s first SMT-capable processor (marketed as Hyper-Threading) was the Foster-based Xeon in 2002, and in 2008 Intel reintroduced SMT with the Nehalem-based Core i7. IBM designed a fairly sophisticated SMT processor, POWER5 [2], by enabling dynamically managed levels of priority for hardware threads. The POWER5 processors were available in May 2004. Since then, IBM has developed the next two generations of POWER processors with further sophistications in resource allocations. In SMT, the processor handles a number of instruction streams (typically small number) from different threads in the same cycle. The execution context, like the program counter, is duplicated for each hardware thread, while most CPU resources, such as the execution units, the branch prediction resources, the instruction fetch and decode units and the cache, are shared competitively among hardware threads. In general the processor utilization increases because there are more instructions available to fill execution units
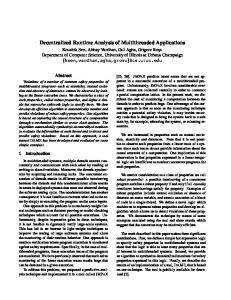
and because instructions from other hardware threads can be executed while another instruction is stalled on a cache miss. Since the threads share some of the key resources, it is performance efficient to schedule threads with anti correlated resource requirements. From the software perspective, the resource allocation to a thread becomes the focal point for SMT specific performance improvement, and is the topic of this research. Several studies have shown that SMT does not always improve the performance of applications [3], [4], [5]. The performance gains from SMT vary depending on a number of factors: The scalability of the workload, the CPU resources used by the workload, the instruction mix of the workload, the cache footprint of the workload, the degree of sharing among the software threads, etc. Fig. 1 shows the performance of three benchmarks with and without SMT (4-way SMT) on the 8-core POWER7 microprocessor. We first run the application with eight threads at SMT1. Then we quadruple the number of threads and enable SMT4. Note that for Equake, SMT4 degraded the performance of the application, while it improved the performance of EP. MG’s performance was oblivious to whatever SMT level was used. These data motivate the following question: Given a multithreaded application, will it benefit from additional hardware contexts available via SMT, as we increase the number of threads? Addressing this question is the focus of our work. 3
Performance Normalized to SMT1
Abstract—Simultaneous multithreading (SMT) increases CPU utilization and application performance in many circumstances, but it can be detrimental when performance is limited by application scalability or when there is significant contention for CPU resources. This paper describes an SMT-selection metric that predicts the change in application performance when the SMT level and number of application threads are varied. This metric is obtained online through hardware performance counters with little overhead, and allows the application or operating system to dynamically choose the best SMT level. We have validated the SMT-selection metric using a variety of benchmarks that capture various application characteristics on two different processor architectures. Our results show that the SMT-selection metric is capable of predicting the best SMT level for a given workload in 90% of the cases. The paper also shows that such a metric can be used with a scheduler or application optimizer to help guide its optimization decisions.
Simon Fraser University*
2.5 2 1.5
SMT1 SMT4
1 0.5 0
Equake
MG
EP
Applications
Fig. 1: Comparison of performance with SMT1 vs. SMT4 for 3 applications on an 8-core POWER7 system. Each application is run alone in a separate experiment. The application uses 8 threads under SMT1 and 32 threads under SMT4.
3 2.5
2 1.5 1 0.5 0 0
10
20
30
40
50
60
L1 misses/1000 instructions
70
80
2 1.5 1 0.5 0 1
2
3
4
5
6
7
8
9
10 11
CPI
SMT4/SMT1 Speedup
3 2.5
SMT4/SMT1 Speedup
3 2.5
SMT4/SMT1 Speedup
SMT4/SMT1 Speedup
3 2.5
2 1.5 1 0.5 0 0
2
4
6
8
10
12
Branch Mispredictions/1000 instructions
2 1.5 1 0.5 0 0
10
20
30
40
50
60
70
% of VSU Instructions
Fig. 2: Speedup on SMT4/SMT1 plotted against cache misses, CPI, branch-mispredictions, and fraction-of-floating-point/vector instructions for 27 benchmarks on the POWER7 processor. Eight threads are used under SMT1 (on eight cores), 32 threads are used under SMT4. In general, workloads that benefit from SMT contain threads that under-utilize certain processor resources as well as threads are able to make use of those resources. Reasons why such ”symbiotic” situations occur include: 1) A large number of cache misses: For a non-SMT processor, when an instruction miss occurs, no more instructions are issued to the pipeline until more instructions have been brought to the instruction cache. A similar situation happens in the case of a data cache miss, the stream of instructions ceases execution until the missing data is brought to the cache. Such situations could result in delays ranging from tens to hundreds of cycles. SMT enables one or more other hardware threads to execute their instruction streams when such delays occur; hence, maximizing the use of the processor pipeline. 2) Long chains of instruction dependencies: Interinstruction dependencies limit the instruction-level parallelism of applications. Based on the layout of the multiple pipeline stages, compilers attempt to generate independent instructions that can be executed in parallel. When dependencies exist, the next instruction ceases execution until it can receive the results of the previous instruction. So if the workload exhibits very long chains of instruction dependencies, SMT could help to fill the gaps by allowing other independent instruction streams from other threads to execute in the otherwise idle execution units. 3) A large number of branch mis-predictions: When the branch history table and the branch target buffer are not large enough to service a large number of branch mispredictions, the execution units remain idle. This is again another opportunity for SMT to allow other hardware threads to use the execution units while the branch misprediction is being resolved. The workloads in these examples are expected to benefit from SMT, because one or more threads leave resources idle, but other threads have sufficient diversity in the instruction mix to put these resources to use. At the same time, if a workload consists of threads that are individually well optimized for a super-scalar processor (e.g., they do not leave resources idle), this workload is not expected to benefit from SMT, because there are no resource gaps to fill. While SMT allows executing multiple streams of instruc-
tions in the same cycle, it also introduces more resource contention among the hardware threads that are co-scheduled on the same core. If any of the shared resources becomes a bottleneck, all threads contending for the resource will suffer, and SMT will not be beneficial. Properties of workloads that create contention for resources include: 1) A homogeneous instruction mix: If one or few types of instruction are more common than others, the workload may create contention for the functional unit responsible for this type of instruction. For example, workloads that are floating-point intensive are likely to gain little from simultaneous multithreading. 2) Intensive use of the memory system: Irrespective of instruction mix, a workload stressing the memory system (e.g., because of poor cache locality) may cause memory-related stalls to become even longer and more frequent on an SMT processor due to increased contention for the memory bandwidth. As a result, processor resource utilization could decrease instead of increasing. In summary, we intuitively understand that workloads that benefit from SMT would have threads that under-use resources, which other threads are able to use, while at the same time not creating contention for these resources. At the same time, being able to predict what is the right SMT level to use for a given workload is not a trivial task. This requires a thorough knowledge of both the internals of the workloads and the internals of the hardware they run on. The complexity of predicting the right SMT level become more paramount as the number of supported SMT levels increases. For instance, IBM’s POWER7 processor [6] has 4way SMT multithreading and exposes to applications three different levels: SMT disabled or SMT1 level, 2-way SMT or SMT2 level, and 4-way SMT or SMT4 level. Although this technology provides more flexibility, it also introduces more complexity since the user needs to decide what is the right SMT level for their running application. In an attempt to see if it is possible to predict performance improvements from SMT by just looking at applications’ characteristics, we plotted the speedup obtained at SMT4 vs. SMT1 against four main application metrics on a POWER7 machine: L1 cache misses, branch mispredictions, cycles per instruction (CPI), and fraction of floating point operations. The experiment was conducted using 27 representative mul-
Data Translation Dispatch, Reorder Buffer & Issue Logic
Data Cache
Issue Ports
Execution Unit
Execution Unit
Execution Unit
Branch
The rationale behind the SMT-selection metric is based on how well the instructions of a workload can utilize the various pipelines of a processor during each cycle. An ideal workload for SMT would have a good mix of instructions that are capable of filling all available functional units at each cycle. Figure 3 shows the pipeline of a generic processor core. In each cycle, the processor fetches from the instruction cache a fixed number of instructions. These instructions are then decoded and buffered. As resources become available, instructions can be dispatched/issued to the various execution/functional units in an out-of-order manner. Issue ports are the pathways through which instructions are issued to the various functional units, which can operate independently. If the instructions that are issued consist of a mix of load, store, branch, integer, and floating point instructions and there are
Decode Logic
Load / Store
II. T HE SMT-S ELECTION M ETRIC
Instruction Cache
Fetch Logic
Load / Store
tithreaded benchmarks on a POWER7 system (more details about the benchmarks used will be presented in subsequent sections). Fig. 2, shows that there is no correlation between any of the four metrics and the SMT speedup. Note here, that every dot in the figures corresponds to a given benchmark. One option for SMT tuning is to compare application performance with and without SMT in an offline analysis and then use the configuration that results in better performance in the field. However, this method is not effective if the hardware used in the field is not the same as that used for original testing, and if the application behavior significantly changes depending on the input. Another option is to vary the SMT level online and observe changes in the instructions-per-cycle (IPC), but this method has limited applicability, because not all systems allow changing the SMT level online. Furthermore, IPC is not always an accurate indicator of application performance (e.g., in case of spin-lock contention). We propose an SMT-selection metric (SMTsm) that does not require any changes to applications or operating systems and incurs low overhead. The metric is measured online while applications are being run. Our metric-based approach relies on hardware performance counters and measures the tendency of a workload to run better or worse in more hardware contexts. SMTsm can be easily integrated in any user-level scheduler or even kernel schedulers to provide insights and intelligent decision about the right SMT level to be used by a workload. SMTsm can be measured periodically and hence allows adaptively choosing the optimal SMT level for a workload as it goes through different phases. We also show how this metric can be used in a scheduler or a user-level optimizer to help guide scheduling decisions. The rest of the paper is organized as follows: Section II describes the SMT-selection metric and its rationale. Section III presents the experimental methodology adopted using two processor architectures. Performance evaluation is presented in Section IV. Section V describes ways the SMT-selection metric can be used. Related work is discussed in Section VI and finally, concluding remarks and future work are discussed in Section VII.
Fig. 3: A generic processor execution engine.
little data dependencies between them, then all functional units will be able to be used concurrently, hence increasing the utilization of the processor. We define the term ideal SMT instruction mix to mean a mix of instructions that is proportional to the number and types of the processor’s issue ports and functional units. With an ideal mix, the processor is able to execute the maximum number of instructions supported. In order for SMT to increase utilization there needs to be instructions available from all the hardware contexts to use as many issue ports as possible. Consider a multithreaded application whose vast majority of instructions are fixed point (integer) instructions. Running the application with more hardware contexts will not help because the fixed point units were already occupied most of the time with one hardware context. On the other hand, if we have an application with an ideal SMT instruction mix, then SMT should improve performance since the processor will have more opportunities to fill all the execution units. Since SMTsm must be able to predict whether an application benefits from additional SMT resources as we increase the number of threads, it must also include some measure of scalability within the application itself. After all, if there are software-related scalability bottlenecks, the application will not run better with increased number of threads irrespective of hardware. We observe that instruction mix, which is crucial for predicting hardware resource utilization in SMTsm, is also a good indicator of the application’s scalability. An application that spends significant time spinning on locks will have a large percentage of branch instructions and a high deviation from the ideal SMT mix. Equation 1 shows how to calculate the SMTsm metric for the generic processor discussed above, where P i denotes a unique issue port, N is the total number of issue ports, DispHeld is the fraction of cycles the dispatcher was held due to lack of resources, T otalT ime is the wall-clock time elapsed, and AvgT hrdT ime is the average time spent by each hardware thread. Smaller metric values indicate greater preference for a higher SMT. The metric consists of three
factors: i) the instruction mix’s deviation from an ideal SMT instruction mix, ii) the fraction of cycles that the dispatcher was held due to lack of resources, and iii) the ratio of the wallclock time elapsed to the average CPU time elapsed per thread. fP i is the fraction of instructions that are issued to P i. For example, to calculate fP 1 , the number of instructions issued through port 1 is divided by the total number of instructions.
Instruction Fetch Unit (IFU) Instruction Dispatch Unit
CR Issue Queue
SM T sm = (
(fP i − 1/N )2 )1/2
u=0
∗ DispHeld
(1)
∗ (T otalT ime/AvgT hrdT ime) The second factor of the SMT-selection metric is the fraction of cycles that the dispatcher was held due to lack of resources. The meaning of resources is architecture dependent and may include many items but it should primarily refer to the issue queues of the execution units. If the issue queues are filling up to the point where the dispatcher is held, then having additional instruction streams to dispatch from is not going to be useful. This factor is important to have in addition to the instruction mix because it indirectly captures the effect of instructionlevel parallelism and cache misses. The number of cycles the dispatcher is held due to resources is easily obtained through hardware performance counters in many modern processors. The final factor of the metric is the ratio of the wallclock time elapsed to the average CPU time elapsed per hardware thread. This measures scalability limitations manifested through sleeping or Amdahl’s law as opposed to busy waiting. This factor does not have a direct relationship with SMT preference, but scalability is an important factor to consider since additional software threads are needed to use the available SMT hardware contexts. In the following subsections, we illustrate how SMTsm metric is measured for two different processor architecture: IBM’s POWER7 and Intel’s Nehalem Core i7. A. SMTsm on IBM’s POWER7 Processor In a given cycle, the POWER7 [6] core can fetch up to eight instructions, decode and dispatch up to six instructions, and issue and execute up to eight instructions. The core has 12 execution units: two fixed point units, two load/store units, four double-precision floating-point pipelines, one vector unit, one branch unit, one condition register (CR) unit, and one decimal floating point pipeline. POWER7 processors support up to 4way SMT. In other words, up to four hardware contexts can concurrently use the core. If there is only a single software thread running on a core, the processor automatically runs the core at SMT1 which gives the hardware thread access to resources that would be partitioned or disabled at higher SMT levels. Similarly, if there are only two software threads on a core then the core runs at SMT2. Fig. 4 shows that an issue port in POWER7 is tied to a type of instruction. For instance, a fixed point instruction always uses a fixed point issue port. There are a total of eight
Unified Queue 0 (UQ 0)
Unified Queue 1 (UQ 1)
Load/Store (LS0)
Load/Store (LS1)
Fixed Point (FP0)
Fixed Point (FP1)
Vector Scalar (VS0) Basic FP, VSX FP, VMX FP, VMX Complex, VMX Simple, 64-Byte Store
Vector Scalar (VS1) Basic FP, VSX FP, Decimal FP, Permute, 64–byte Store, 128–byte Store
Issue Ports
CR Unit
N −1 X
Branch Issue Queue
Branch Unit
Fig. 4: IBM’s POWER7 out-of-order execution engine. issue ports: 1 port corresponds to a conditional register (CR) instruction, 1 port corresponds to a branch instruction, the remaining 6 issue ports are divided equally between the two unified issue queues, UQ0 and UQ1. Through each UQ, up to one load/store instruction, one fixed point instruction (FP) and one vector scalar (VS) instruction can be issued concurrently. It is important to note here, that the CR unit is a special unit. It is tightly tied to the branch unit. It is also not heavily used in general. This unit has been mainly designed to avoid sending the compare instructions through the FP unit to avoid tying branch prediction to the FP unit. Therefore, we consider in our metric both the CR and branch units as one execution unit. So, an ideal SMT instruction mix for the POWER7 architecture would consist of 1/7 loads, 1/7 stores, 1/7 branches, 2/7 FP instructions, and 2/7 VS instructions. The loads and stores are separated because they rely on separate resources like the load and store buffers. To measure the second term of the equation (dispatcher held) in POWER7, the hardware performance event P M DISP CLB HELD RES can be used. The SMT-selection metric for the POWER7 processor is shown in Equation 2. P 7SM T sm = ((fL − 1/7)2 + (fS − 1/7)2 + (fBR − 1/7)2 + (fV S − 2/7)2 + (fF P − 2/7)2 )1/2
(2)
∗ DispHeld ∗ (T otalT ime/AvgT hrdT ime) B. SMTsm on Intel’s Nehalem Processor On the Nehalem Core i7, the number of issue ports equals the maximum number of instructions that can be issued in a cycle (see Fig. 5). In contrast to POWER7, each of the six issue ports is used for a variety of unrelated instructions [7]. The unified reservation station serves as a single scheduler for all the execution units. It is responsible for assigning instructions to the different execution units. The core can issue up to 6 instructions per cycle. Three of them are memory operations (load, store address and store data), and the other
3.2 GHz with two SMT threads per core. GCC 4.4.5 was used to compile the benchmarks with the flags -O3 -march=native and -fopenmp where appropriate. Unlike POWER7, the SMT level can only be changed by rebooting and modifying a BIOS setting. In our experiments SMT2 is always enabled in the BIOS. Therefore to simulate SMT1 we only use one software thread per core. This better represents typical use cases because SMTsm is designed to be used dynamically at run-time.
Unified Reservation Stations (36 Entries)
FP Add
Divide
Complex Integer
SSE Integer ALU Integer Shuffles
Store Address
Store Data
Port 5
FP Multiply
Load
Port 4
Integer ALU & LEA
Port 3
Port 2
Port 1
Port 0 Integer ALU & Shift
Integer ALU & Shift
Branch
Data Cache
SSE Integer Multiply
FP Shuffle
B. Benchmarks SSE Integer ALU Integer Shuffles
Fig. 5: Intel’s Nehalem out-of-order execution engine. three are computational instructions (floating point, branch, and integer operations). Intel’s Nehalem core supports 2-way SMT. Equation 3 shows the SMT-selection metric for Intel’s Nehalem Core i7 processor. The term fP i refers to the fraction of instructions that have been issued through port i ( i ∈ [0, 1, 2, 3, 4, 5]). Since the issue ports on Nehalem are not related to a single type of instruction, we simply measure the number of instructions issued to each port. All instructions map to a single issue port, except for integer ALU instructions which map to three ports, so the mix of instructions sent to each issue port is sufficient for calculating the SMT-selection metric. Dispatch held can be obtained using RAT ST ALLS event with the rob read port unit mask [8].
The experiments use a diverse set of benchmarks to capture the variations in characteristics of various workloads. The benchmarks are drawn from the NAS Parallel Benchmarks (NPB) v3.3.1, the PARSEC Benchmark Suite v2.1, the SSCA2 benchmark, the STREAM synthetic benchmark, the SPEC OMP2001 benchmark suite v3.2 and two commercial benchmarks. Due to compatibility issues we were not able to run all of the benchmarks on the POWER7 system. Due to time constraints, we focused mostly on the POWER7 system, because it supports a higher SMT level than Nehalem; as a result we did not run all of the benchmarks on Nehalem. A brief description of the benchmarks used is outlined below. •
•
5 X Ci7SM T sm = ( (fP i − 1/6)2 )1/2 i=0
∗ DispHeld
(3)
∗ (T otalT ime/AvgT hrdT ime) III. E XPERIMENTAL M ETHODOLOGY A. System Configuration Experiments were conducted on an AIX/POWER7 system and a Linux/Core i7 (Nehalem) system. The AIX/POWER7 system uses AIX 6.1.5 and two 8-core POWER7 chips. For the single-chip experiments, the benchmarks were restricted to run on one 8-core chip. The POWER7 CPU is clocked at 3.8 GHz and the system has 64 GB of RAM. The C, C++, and Fortran benchmarks were compiled with IBM XL compiler 11.1.0.6 using these flags: -O3 -qstrict -qarch=auto -qsimd=auto -q64 and -qsmp=omp. The MPI programs use the IBM Parallel Operating Environment version 5.2.2.3. the Java benchmarks use the 64-bit IBM JVM version 1.6.0. The SMT levels on POWER7 can be changed without rebooting the system by running the smtctl command with privileged access. The Linux/Core i7 system uses Linux kernel 2.6.34 with 3GB of RAM and a four cores Intel Core i7 965 clocked at
•
•
•
The NAS parallel benchmark Suite [9] is a set of programs that have been initially designed to evaluate the performance of supercomputers. Both the MPI and OpenMP versions were used on AIX/POWER7 but only the OpenMP versions were used on Linux/Core i7. PARSEC benchmarks [10]: PARSEC stands for Princeton Application Repository for Shared-Memory Computers. It is a set of programs designed to evaluate the performance of Chip-Multiprocessors (CMPs). PARSEC benchmarks mimic multithreaded applications from different fields such as recognition, mining, and large-scale commercial applications. PARSEC does not officially support the AIX operating system, so only a handful of the benchmarks were able to be used on the AIX/POWER7 system. SSCA2 benchmarks: SSCA, which stands for the Scalable Synthetic Compact Applications, is a computational graph theory benchmark that uses OpenMP. It consists of four kernels with irregular access to a large, directed, and weighted multi-graph. This benchmark is characterized by integer operations, a large memory footprint, and irregular memory access patterns. STREAM [11] is a synthetic benchmark designed to measure memory bandwidth and also uses OpenMP. To obtain reasonable running times for our experiments, we have increased the the default array size and number of iterations to 4577.6 MB and 1000 respectively. SPEC OMP benchmark Suite [12] is adapted from the SPEC CPU2000 benchmarks. Its goal is to evaluate the performance of openMP applications on shared memory multi-processors. We have used the SPEC OMP experiments only on the AIX/POWER7 system.
2.5
2 Blackscholes IS
1
0 0
0.025
0.05
0.075
0.1
0.125
0.15
0.175
0.2
0.225
0.25
SMT-selection Metric @ SMT4
Fig. 6: SMT4/SMT1 speedup vs. metric evaluated @SMT4 – AIX instance on an 8-core POWER7 chip. SMT4/SMT1 Speedup 1.82
1.35
100%
0.86
0.78
0.25
90% 80% 70% 60% 50% 40% 30% 20% 10%
% Stores
% Branches
% FXU
ix Tm SM id ea lP 7
ol es bl ac ks h
% Loads
SS AC 2 sp ec jb b_ co nt en tio n
0%
%VSU
Fig. 7: Instruction mix of 5 benchmarks – AIX instance on an 8-core POWER7 chip.
1.8
← Threshold Line EP_MPI EP
1.6 1.4 SMT4/SMT2 Speedup
Fig. 6 shows the relationship between the SMT-selection metric measured at SMT4 and the speedup obtained on SMT4 relative to SMT1 on the AIX/POWER7 system. We can see a clear correlation between the metric value and the speedup, and the correlation is strong enough to predict the optimum SMT level in most cases (In our experiments, the success rate was 93%). If we set a threshold close to the value of 0.07 then we can be confident that any application with a metric greater than the threshold will perform better at SMT1 than SMT4. This is true for the majority of the benchmarks evaluated. Applications that fall to the left of the threshold are likely to prefer SMT4, with only two of the evaluated benchmarks
Dedup
SPECjbb_contention
IV. E VALUATION
A. SMTsm Evaluation for various Multithreaded Benchmarks
Gafort IS_MPI Fluidanimate Fma3d LU_MPI CG_MPI Daytrader Ammp Apsi SPECjbb Applu MG FT_MPI BT Stream MG_MPI StreamclusterSSCA2 Swim Mgrid Equake
W upwise
1.5
0.5
Table I summarizes the various benchmarks used in each category. Note here that for the problem sizes presented, native and reference problem sizes are the largest available for their respective suites. For NAS benchmarks, D is a larger problem size than C.
In all of the experiments conducted, the number of software threads used is chosen to be the same as the number of available hardware threads/contexts in the OS instance. For example, in the AIX instance on one 8-core POWER7 chip, 32 software threads were used at SMT4, 16 software threads were used at SMT2, and 8 software threads were used at SMT1. Similarly, on the Linux instance on the 4-core Core i7 machine, 8 software threads were used at SMT2, and 4 software threads were used at SMT1.
← Threshold Line
EP EP_MPI
de du p
•
3
flu id an im at e
•
DayTrader [13] is a Websphere benchmark application that emulates an online stock trading system. The application simulates typical trading operations such as login, viewing portfolios, looking up stock quotes, and buying or selling stock shares. The benchmark consists of a websphere front-end, a DB2 database, and a load generator. The DayTrader client is a Linux Intel Xeon machine running the JIBE (Websphere Studio Workload Simulator), which simulates a specifiable number of concurrent browser clients. We simulated 500 clients for stressing the DayTrader application running on the DayTrader server. This number of clients was sufficient to keep the server continuously busy with waiting requests to be processed. SPECjbb2005 is a Java server benchmark from the Standard Performance Evaluation Corporation [14] based on the TPC-C benchmark specifications. It simulates a 3-tier system in a JVM with emphasis on the middle tier. SPECjbb05-contention is a custom benchmark derived from SPECjbb2005. The primary change introduced in SPECjbb05-contention is that all worker threads operate on a single warehouse instance instead of each worker thread operating on its own warehouse instance. This introduces synchronization contention that is not present in SPECjbb2005.
SMT4/SMT1 Speedup
•
1.2 1
CG_MPI Blackscholes IS IS_MPIFma3d W upwise Gafort LU_MPI SPECjbb MG_MPI Apsi MG Daytrader FT_MPI Stream Swim Ammp BT
Dedup Applu SSCA2
0.8 Mgrid
0.6
Streamcluster
Equake SPECjbb_contention
0.4 0.2 0
0
0.05
0.1
0.15
0.2
0.25
SMT-selection Metric @ SMT4
Fig. 8: SMT4/SMT2 speedup vs. metric evaluated @SMT4 – AIX instance on an 8-core POWER7 chip.
TABLE I: Benchmarks Evaluated Label IS BT LU CG FT MG EP
Suite NAS NAS NAS NAS NAS NAS NAS
Blackscholes Bodytrack Canneal Dedup Facesim Ferret Fluidanimate Freqmine Raytrace Streamcluster Swaptions Vips x264 Stream
Parsec Parsec Parsec Parsec Parsec Parsec Parsec Parsec Parsec Parsec Parsec Parsec Parsec N/A
SSCA2
N/A
SPECjbb
SPECjbb 2005 N/A
Problem Size D C C C C D D (OpenMP) C (MPI) Native Native Native Native Native Native Native Native Native Native Native Native Native 4578 MB x 1000 iterations SCALE = 17 No. vertices = 217 No. warehouses = No. hw. threads No. warehouses = 1
N/A
500 clients
SPECjbb contention Daytrader Ammp Applu Apsi Equake Fma3d Gafort Mgrid Swim Wupwise
SPEC SPEC SPEC SPEC SPEC SPEC SPEC SPEC SPEC
OMP2001 OMP2001 OMP2001 OMP2001 OMP2001 OMP2001 OMP2001 OMP2001 OMP2001
Reference Reference Reference Reference Reference Reference Reference Reference Reference
Description Integer Sort: Bucket sort for integers Block Tridiagonal: Solves nonlinear PDEs using the BT method Lower-Upper: Solves nonlinear PDEs using the SSOR method Conjugate Gradient: Estimates eigenvalues for sparse matrices Fast Fourier Transform MultiGrid: Approximate solution to a 3d discrete Poisson equation Embarrassingly Parallel: Computes pseudo-random numbers Computes option prices Simulates motion tracking of a person Cache-aware annealing Data compression and deduplication. Heavy I/O Simulates human facial motion Content similarity algorithm Fluid dynamics simulation Frequent item set mining Raytracing Online data clustering Pricing of financial swaptions Image processing Video encoding Streaming memory performance Graph analysis benchmark. Lock heavy Server-side Java performance. It emulates a 3-tier system in a JVM with emphasis on the middle tier. Modified version of SPECjbb with only a single warehouse. Heavy lock contention Websphere trading platform simulation. Web front-end only. Heavy network I/O. Molecular dynamics Fluid dynamics Lake weather modeling Earthquake simulation Finite element method PDE solver Genetic algorithm Multigrid method differential equation solver Shallow water modeling Quantum chromodynamics
2 EP
1.8 EP_MPI
1.6
Streamcluster Blackscholes IS Fluidanimate Gafort IS_MPI W upwise Ammp Fma3d LU_MPI Daytrader
SMT2/SMT1 Speedup
1.4 1.2
Apsi
Applu Equake BT FT_MPI MG CG_MPI Stream SPECjbb Mgrid MG_MPI Swim
1 0.8
SSCA2 Dedup
SPECjbb_contention
0.6 0.4 0.2 0
0
0.05
0.1
0.15
0.2
0.25
0.3
SMT-selection Metric @ SMT2
Fig. 9: SMT2/SMT1 speedup vs. metric evaluated @SMT2 – AIX instance on an 8-core POWER7 chip.
having a metric less than the threshold and performing slightly worse at SMT4. In Fig. 7, we clearly see a correlation between the instruction mix and the SMT4/SMT1 speedup. We have selected representative benchmarks from the set of benchmarks studied. As we move from the left of the figure to the right, the speedup going from SMT1 to SMT4 decreases from 1.82 to 0.25, while the instruction mix tends to be more and more dominated with one or fewer functional units or less diverse. The metric versus SMT4/SMT2 speedup on AIX/POWER7 is shown in Fig. 8. Once again a threshold of 0.07 provides good separation. All of the benchmarks with a metric greater than the threshold prefer SMT2. Three benchmarks have a metric less than the threshold and a speedup less than 1 but greater than 0.9. All of the remaining benchmarks have a metric below the threshold and a speedup greater than 1. The experiment shown in Fig. 9 is the same as the previous experiments except it uses the SMT2 over SMT1 speedup. In this case, the SMT-selection metric is not capable of always making an accurate prediction. For metric values below 0.07 or above 0.19, we can predict the optimum SMT level. However,
for metric values between 0.07 and 0.19, it is not possible to predict the application’s SMT preference.
B. SMTsm Evaluation at a Lower-SMT level 3 EP
1.8
← Threshold Line
EP_MPI
2.5
EP
1.6
freqmine SSCA2
SMT2/SMT1 Speedup
bodytrack
x264 blackscholes_pthreadsfacesim UA fluidanimate
SMT4/SMT1 Speedup
swaptions
1.4
streamcluster
ferret
1.2
BT
1
raytrace dedup
vips
LU FT
CG bodytrack_pthreads SP
0.8
2 Blackscholes IS Gafort
Wupwise
1.5
Fluidanimate Ammp
1
Fma3d
Applu
MG BT
Stream
Streamcluster
Dedup
Mgrid Equake
0.5 SPECjbb_contention
0.2
0 0
0.02
0.04
0.06
0.08
0.1
0.12
0.14
0
0.05
0.1
SMT-selection Metric @ SMT2
Fig. 10: SMT2/SMT1 speedup vs. metric evaluated @SMT2 – Linux instance on a quad-core Core i7 system. Fig. 10 shows the SMT-selection metric compared to the SMT2/SMT1 speedup on the Linux/Core i7 system. In this experiment, a stronger correlation than in any of the AIX/POWER7 experiments is observed. With only eight software threads running at SMT2, there is less synchronization contention so only a few of the benchmarks prefer SMT1 over SMT2. In this case there is not much motivation for SMT optimization but the experiment does show that the SMTselection metric can be adapted to other architectures. In this experiment, we observe an outlier on the far right, which is Streamcluster from PARSEC. The outlying behavior of Streamcluster is due to its unique characteristic: a large fraction of load instructions (40%). More specifically, the model does not very well reflect the behaviour of streamcluster on Nehalem for the following reason: Since streamcluster has an unusually high number of loads, according to our model, a single thread should tie up a particular pipeline resource (an issue port for loads, in this case). Therefore, adding more threads will not help. However, because this application is memory-intensive on Nehalem (it has 8 L3 Misses per thousand retired instructions (MPKI)), the bottleneck for load instructions is the memory system instead of the the issue port. So, this creates a scenario where adding more SMT threads helps: while some threads wait for memory others can continue using pipeline resources. On POWER7, the reason for Streamcluster being an outlier in the SMT2/SMT1 case is different, because the L3 miss rate is no longer high (POWER7 has a larger L3 cache). However, the reason still relates to Streamcluster having a high number of loads and a low number of stores. On POWER7, loads and stores rely on mostly the same pipeline resources (like the issue port). Therefore, these resources do not become the bottleneck although we have many load instructions.
0.15
0.2
0.25
0.3
0.35
0.4
0.45
SMT-selection Metric @ SMT1
0.16
Fig. 11: SMT4/SMT1 speedup vs. metric evaluated @SMT1 – AIX instance on an 8-core POWER7 chip.
1.8 EP
1.6
freqmine
1.4 SMT2/SMT1 Speedup
0
SPECjbb MG_MPI Swim
SSCA2
LU_MPI CG_MPI
Apsi
FT_MPI
0.6 0.4
IS_MPI
swaptions bodytrack
streamcluster
facesim fluidanimate UA raytrace BT LU dedup
1.2 1
canneal CG
bodytrack_pthreads
SP
FT
0.8 0.6 0.4 0.2 0
0
0.05
0.1
0.15
0.2
0.25
0.3
0.35
0.4
SMT-selection Metric @ SMT1
Fig. 12: SMT2/SMT1 speedup vs. metric evaluated @SMT1 – Linux instance on a quad-core i7 system. The previous subsection evaluated how well the SMTsm estimated performance speedup is, when the SMTsm is measured at the highest supported SMT level (SMT4). In this subsection, we evaluate the metric when the application is running at a lower SMT level, and the metric is used to predict the speedup at a higher SMT level. Figures 11 and 12 show the same experiments presented in subsection IV-A but with the SMTsm measured at the lowest supported SMT level. The experiments did not show a good correlation between the metric and the speedup. This is not surprising, as the metric is not able to foresee scalability limitations caused by more threads at a higher SMT level; the metric is only capable of detecting a slowdown when it is happening. At SMT1 we are not able to accurately capture
C. Metric Evaluation across Chips
SMT4/SMT1 Speedup
EP_MPI
Wupwise
1.2
Fluidanimate Ammp
1
FT_MPI
0.8
IS_MPI LU_MPI
Blackscholes Fma3d
CG_MPI Stream BT Swim MG Streamcluster MG_MPI Applu Apsi
SSCA2
Dedup
SPECjbb Equake Mgrid
0.6
SPECjbb_contention
0
0.05
0.1
0.15
0.2
0.25
0.3
0.35
SMT-selection Metric @ SMT2
Fig. 15: SMT2/SMT1 speedup vs. metric evaluated @SMT1 – AIX instance on two 8-core POWER7 chips.
IS
1.5
Gafort Blacksholes
IS_MPI Wupwise CG_MPI FT_MPI
Fma3d
MG Stream Fluidanimate
Applu BT Ammp SPECjbb Apsi
0.5
Dedup
Swim SSCA2 Streamcluster
SPECjbb_contention Mgrid Equake
0
0.05
0.1
0.15
0.2
0.25
0.3
0.35
0.4
0.45
0.5
SMT-selection Metric @ SMT4
Fig. 13: SMT4/SMT1 speedup vs. metric evaluated @SMT4 – AIX instance on two 8-core POWER7 chips.
1.8
← Threshold Line
1.6 EP_MPI EP
1.4 SMT4/SMT2 Speedup
IS
Gafort
1.4
0
2
MG_MPI
1.2
IS
Gafort Blacksholes CG_MPI MG Fma3d Apsi Wupwise
0.8
Ammp
0.6
Stream Applu Fluidanimate SSCA2
BT
Dedup Swim
SPECjbb_contention
Streamcluster
Mgrid
0.4
Equake
0.2 0
1.6
0.2
EP
1
EP EP_MPI
← Threshold Line
2.5
0
1.8
0.4
3
1
2
SMT2/SMT1 Speedup
contention as it was the case at SMT4, so the metric breaks down at SMT1. Therefore, it is important to use the metric at the highest SMT-level available. Moreover, in all SMT-capable processors, the highest SMT-level is always used as the default since many multi-threaded applications benefit from SMT. This motivates further the use of the metric at higher SMTlevels to predict whether going to a lower SMT-level benefits the running workload.
0
0.05
0.1
0.15
0.2
0.25
0.3
0.35
0.4
0.45
0.5
SMT-selection Metric @ SMT4
Fig. 14: SMT4/SMT2 speedup vs. metric evaluated @SMT4 – AIX instance on two 8-core POWER7 chips. Figures 13, 14, and 15 give the results for the SMTsm prediction experiments on an AIX instance running on a twochip POWER7 system. For these experiments there are 16 cores, which means 64 software threads are used at SMT4, 32 threads are used at SMT2, and 16 threads are used at
SMT1. Using two chips introduces two new variables that the metric must compensate for to remain accurate. First, there is a performance penalty for cross-chip communication, so applications that are more sensitive to NUMA effects may affect the metric differently. Second, the number of running software threads is doubled at all SMT levels compared to the single chip case, so the effect of scalability is amplified. For the SMT4/SMT1 case presented in Fig. 13, the results are similar to the SMT4/SMT1 experiment with only one chip. However, there are more benchmarks that are mis-predicted. We also notice, that applications that have a metric near the threshold are more likely to be mispredicted. Another difference with the single chip experiment is that more applications prefer SMT1 over SMT4. This is expected since with more software threads, more contention for synchronization resources will be introduced, and hence more scalability limitations. The SMT4/SMT2 results (Fig. 14) look better than the SMT4/SMT1 results, but there is still only a small difference in metric values between SMT4-preferring applications and SMT1-preferring applications. Fig. 15 demonstrates that SMT2/SMT1 prediction is ineffective, the same as in the single chip case. SMT preference prediction is important for large systems with many cores because more applications will be hindered by SMT as synchronization overhead and contention over CPU resources overtake the benefits of SMT. The results show that the SMT-selection metric is still useful at 16 cores, but more work needs to be done since the metric is less accurate at 16 cores than at 8 cores. One possibility is that the scalability detection aspect of the metric starts to break down with a large number of threads. This is supported by the fact that the metric works better at SMT4/SMT2 prediction with 16 cores, since the change in the number of software threads is smaller than when predicting SMT4/SMT1 speedup.
V. A PPLYING THE SMT-S ELECTION M ETRIC The SMT-selection metric can be used by operating systems to guide scheduling decisions. It can also be used by user-level optimizers or application tuners to dynamically adjust the SMT level of the underlying system to improve the performance of running applications. To use the SMT-selection metric, the formula must first be adapted to the target architecture. In section II, we presented the metric for the IBM POWER7 and Intel Nehalem architectures. The metric can be ported to other architectures in similar ways. The threshold for changing the SMT level needs to be determined for each new system. This can be achieved by running a representative set of workloads, recording the SMT speedups and the observed SMTsm metric values for each workload, as we did in section IV. Once the (metric, speedup) values are gathered, the threshold can be obtained automatically using statistical techniques. We describe two methods to obtain a good SMTsm threshold for deciding when a change in SMT level would benefit the performance of a given application.
Fig. 16 shows the results of using Gini impurity to provide a suitable metric threshold value at which to decide on performing a change in SMT level to improve performance, when using SMT4/SMT1 speedup data on POWER7. The dotted vertical lines mark the range of optimal thresholds. The figure also displays two easy ways to observe the qualitative fitness of the SMT-selection metric on a given system and a set of benchmarks. First, is how low the impurity is at its lowest point, which represents how good a prediction can be made. In the figure, the lowest impurity is 0.23 which is good, as verified by the fact that only four of the benchmarks were misclassified with the threshold obtained by this method (Refer to Fig. 6 which has four points to the left of the separator with a speedup below 1). Second, is how large the range of optimal thresholds is. If the range is very small, then a new application with a metric beyond that range is likely to be mispredicted. 0.6
0.5
A. Using Gini Impurity
�
|L1 | IL = 1 − |L| � IR = 1 −
|R1 | |R|
�2
�
|L0 | − |L|
�2
� −
|R0 | |R|
�2 (4) �2 (5)
4) Calculate the overall Gini impurity using equation 6. Impurity =
|L| |R| · IL + · IR |L + R| |L + R|
(6)
An impurity of 0 indicates that the set is perfectly separated, i.e. all of the sample points to one side of the separator have a speedup greater than or equal to 1, and all of the remaining points are on the other side. A high impurity value means that the selected separator is not a good classifier, and vice versa.
Impurity
0.4
Gini impurity [15] is a measure of how well separated or clustered a set is. We look for a separator (potential threshold) that leads to the lowest overall Gini impurity as follows: 1) Re-label the (metric, speedup) tuples into the form (metric, i) with (i ∈ {0, 1}), setting i=0 if the speedup is less than 1, and i=1 if the speedup is greater than or equal to 1. 2) Divide the tuples into 2 sets {L=Left-set, R=Right-set} based on whether the metric value is to the left or to the right of the separator value. 3) Calculate the Gini impurity of the left-set (IL ) and the right-set (IR ) as shown in equations 4 and 5, where |L0 | denotes the size of the left-set with i = 0 (i.e., speedup < 1), |L1 | denotes the size of the left-set with i = 1 (i.e., speedup ≥ 1), and |L| is the size of the entire left set (|L| = |L0 | + |L1 |). Similar notation is used with the right set.
0.3
0.2
0.1
0
0
0.05
0.1
0.15
0.2
0.25
Separator
Fig. 16: Total overall Gini impurity for potential separators of the SMTsm metric for SMT4/SMT1 speedup on POWER7. B. Using The Average Percentage Performance Improvement (PPI) Method With this method we are trying to estimate how much performance improvement we would obtain if we switched from the default SMT level (e.g., SMT4) to a lower one (e.g., SMT1) as dictated by different thresholds. The threshold with the highest estimated Percentage Performance Improvement (PPI) is deemed the best. In order to do this, for each potential SMTsm threshold value, and for each benchmark, we estimate a PPI value as follows: • If the benchmark’s measured SMTsm value is less than the threshold in question, then its PPI is set to 0. Essentially, this means that the benchmark is not expected to benefit from a lower SMT setting, so its expected PPI from switching to lower SMT level is zero. • If the benchmark’s measured metric value is greater than the threshold value in question, then the PPI is set to (( SM T 4/SM1T 1 speedup − 1) ∗ 100. In other words, if the benchmark is expected to benefit from a lower SMT setting based on the current threshold, we calculate PPI as
the performance improvement at SMT1 relative to SMT4 (expressed in percent). Then, we take the average of the PPIs over the whole set of benchmarks as the Y-value to plot against that threshold value. This gives us the average expected performance improvement at each threshold level. Examining this data, we can choose the best threshold – the one that gives us the highest PPI. Fig. 17 shows an example of using this method for SMT4/SMT1 performance improvement prediction on POWER7. The results are similar to those using Gini impurity, but this methods provides the following additional benefits: 1) It can be used to easily show how much performance improvement the SMTsm metric can provide. The Gini impurity method only shows that the metric is working, but cannot show potential improvements. 2) It also gives a view of potential PPIs over a range of threshold values. Even though the range of optimal metric thresholds is relatively small in both methods, we can see from Fig. 17 that there is actually a large range of potential threshold values where we have an average PPI that is greater than 15%. This means that a new application whose metric value falls into this range is not likely to experience a severe negative effect from using this metric value as a threshold for deciding on a change in SMT level.
Average Improvement over Default (%)
25
20
15
10
5
0
0
0.05
0.1
0.15
0.2
0.25
Threshold
Fig. 17: Average SMT4/SMT1 percentage performance improvement of all the benchmarks vs. SMTsm values – AIX instance on POWER7. 3) This method can also provide a better threshold than the Gini impurity method in some cases, because Gini impurity does not consider the amount of speedup. For example, there could be a few benchmarks with speedup values just below one, and a benchmark with a very large speedup just to the right of them. In this case Gini impurity would suggest putting the threshold to the left of all the mentioned benchmarks so as to classify more benchmarks correctly, whereas this method would suggest putting the threshold to the right, thereby preserving the large speedup in return for minimal slow-downs in
the other benchmarks. VI. R ELATED W ORK SMT job schedulers and SMT performance characterization comprise the majority of related work. The SMT job schedulers are designed to find high performing (often referred to as symbiotic) co-schedules from a larger selection of running applications. They do not attempt to optimize the SMT level itself like SMTsm. The SMT performance characterizations do investigate the effect of the SMT level but none of them propose a general metric or algorithm for optimizing it. Additionally, most of the previous work focus on singlethreaded applications while our work studies multi-threaded applications. Mathis et al [4] evaluate and analyze the effect of SMT2 on the POWER5 CPU with single-threaded applications. To measure the SMT2 gain of an application, they simply run one copy of the application per available hardware thread/context with and without SMT. The authors found that most of the tested applications have a moderate performance improvement with SMT. They also found that applications with the smallest improvement have more cache misses when using SMT. This result is less applicable to multi-threaded applications because the total amount of work and data does not increase as the number of threads increases, like it does when you run more copies of a single-threaded application and because threads of a multi-threaded application may share data. Ruan et al [16] evaluate and analyze SMT effects on a network of servers but do not attempt any optimization. They found that the overhead of using an SMP-capable kernel sometimes outweighs the benefit of SMT. This is irrelevant today since all modern server CPUs are at least dual-core. The authors also discovered that SMT can sometimes hurt performance when there is more than one CPU which supports our claim that the SMT level should be optimized. Snavely and Tullsen [17] describe a job scheduler for SMT systems called SOS (Sample, Optimize, Symbios). The goal of SOS is to choose an effective co-schedule of applications from a pool of ready-to-run applications. SOS has a sampling phase where it tries many different co-schedules and measures a performance predictor metric from hardware counters. Then, it has a symbiotic phase where it runs the co-schedules with the best predicted performance. The authors evaluated several different predictors and found that a high IPC and a low L1 data cache miss rate are both good predictors. They did try a predictor based on the instruction mix, but it only looked at integer and floating point instructions and it did not take into account the mix of execution units. Snavel et al [18] extended SOS to support application priorities. Overall, SOS is effective for finding good co-schedules among many single-threaded applications, but it is not designed to choose the best SMT level for a multi-threaded application. Settle et al [19] designed a job scheduler similar to SOS in its goals. They use custom hardware performance counters to create a fine-grained view of the cache access patterns of the applications, from which they derive co-schedules with
an average of 7% improvement over the default scheduler. Eyerman and Eeckhout [20] propose an SMT job scheduler that is meant to surmount the shortcomings of SOS. They use a probabilistic model to co-schedule applications without the need for a sampling phase, and it can be configured to optimize for throughput or turn-around time. The major downside of their approach is that it requires specialized CPU counters that are not available on commercial hardware. Tam et al [21] present a solution for scheduling threads on SMP-CMP-SMT systems. Their goal is to reduce remote cache accesses by scheduling threads together that access the same data. The authors approach this problem by using hardware performance counters to monitor the addresses of memory that cause remote cache accesses and then scheduling together (on the same chip or on the same core) threads that access the same memory. They achieve 5-7% performance improvements for a handful of applications, but their system is not meant to determine the optimal SMT level. VII. C ONCLUSIONS AND F UTURE W ORK Simultaneous multithreading design has revolutionized the way modern processors perform computations today. It has introduced many benefits, notably increasing CPU utilization. However, automatically predicting when SMT fails to provide the expected increase in performance for many applications is still not a well-understood area of research. This paper examines a methodology for SMT-level selection. At the heart of our methodology is the SMT-selection metric that is capable of predicting potential change in application performance when the SMT-level is changed. We have shown that it is very difficult to predict SMT preference by just relying on certain parameters like cache misses, branch mispredictions, number of floating point instructions, or CPI. Our performance evaluation used a large number of multithreaded standard benchmarks that represent a wide range of applications behavior. Our results have shown that the SMTselection metric was able to predict the correct SMT speedup in 93% of the cases on the IBM POWER7 processor, and in 86% of the cases on the Intel Nehalem processor. The metric can easily be adapted to other architectures once we have a good understanding of the issue ports and functional units used by the target architecture. We have also presented an algorithm based on the Gini impurity that can be used to accurately obtain a range of SMT-selection metric thresholds that can be used by schedulers or application optimizers. While we tried to capture most of the factors that could impact SMT performance for a general microprocessor, the SMTsm still does not address directly some issues like instruction-level dependencies and relative execution speeds of various instruction types. SMTsm attempts to approximate such effects indirectly through the dispatch-held factor. Studying such effects is the subject of our future investigations. More future work needs to be done to increase the accuracy of prediction, to test the metric on other architectures, to improve the scalability of the metric when applied to a much larger
number of cores, and finally, to use the metric in a user-level scheduler. ACKNOWLEDGMENT We would like to thank Niteesh Dubey for his help and valuable feedback on this work. R EFERENCES [1] D. M. Tullsen, S. J. Eggers, and H. M. Levy, “Simultaneous multithreading: maximizing on-chip parallelism,” in 25 years of the international symposia on Computer architecture (selected papers), ser. ISCA ’98, 1998, pp. 533–544. [2] R. Kalla, B. Sinharoy, and J. M. Tendler, “IBM POWER5 chip: a dualcore multithreaded processor,” IEEE Micro, vol. 24, no. 2, pp. 40–47, 2004. [3] W. Huang, J. Lin, Z. Zhang, and J. M. Chang, “Performance characterization of java applications on SMT processors,” in International Symposium on Performance Analysis of Systems and Software, 2005, pp. 102–111. [4] H. M. Mathis, A. E. Mericas, J. D. McCalpin, R. J. Eickemeyer, and S. R. Kunkel, “Characterization of simultaneous multithreading (SMT) efficiency in POWER5,” IBM J. Res. Dev., vol. 49, pp. 555–564, July 2005. [5] S. K. Sadasivam and P. Kumar, “SPECfp2006 CPI stack and SMT benefits analysis on POWER7 systems,” Paris, France, May 2011. [6] R. Kalla, B. Sinharoy, W. J. Starke, and M. Floyd, “POWER7: IBM’s next-generation server processor,” IEEE Micro, vol. 30, pp. 7–15, 2010. [7] M. E. Thomadakis, “The architecture of the Nehalem processor and Nehalem-EP SMP platforms,” Texas A&M University, Tech. Rep., 2011. [8] “Intel 64 and IA-32 architectures software developer’s manual,” 2011. [9] D. H. Bailey, E. Barszcz, J. T. Barton, D. S. Browning, R. L. Carter, L. Dagum, R. A. Fatoohi, P. O. Frederickson, T. A. Lasinski, R. S. Schreiber, H. D. Simon, V. Venkatakrishnan, and S. K. Weeratunga, “The NAS parallel benchmarks-summary and preliminary results,” in Proceedings of the 1991 ACM/IEEE conference on Supercomputing, ser. Supercomputing ’91, 1991, pp. 158–165. [10] C. Bienia and K. Li, “PARSEC 2.0: A new benchmark suite for chip-multiprocessors,” in Proceedings of the 5th Annual Workshop on Modeling, Benchmarking and Simulation, June 2009. [11] J. D. McCalpin, “Memory bandwidth and machine balance in current high performance computers,” IEEE TCCA Newsletter, December 1995. [12] H. Saito, G. Gaertner, W. B. Jones, R. Eigenmann, H. Iwashita, R. Lieberman, G. M. v. Waveren, and B. Whitney, “Large system performance of SPEC OMP2001 benchmarks,” in Proceedings of the 4th International Symposium on High Performance Computing, ser. ISHPC ’02, London, UK, UK, 2002, pp. 370–379. [13] “Apache daytrader benchmark.” [Online]. Available: https://cwiki.apache.org/GMOxDOC20/daytrader.html [14] “SPECjbb2005.” [Online]. Available: http://www.spec.org/jbb2005/ [15] L. Rokach and O. Maimon, “Top-down induction of decision trees classifiers - a survey,” IEEE Transactions, vol. 35, pp. 476–487, 2005. [16] Y. Ruan, V. S. Pai, E. Nahum, and J. M. Tracey, “Evaluating the impact of simultaneous multithreading on network servers using real hardware,” SIGMETRICS Perform. Eval. Rev., vol. 33, pp. 315–326, June 2005. [17] A. Snavely and D. M. Tullsen, “Symbiotic jobscheduling for a simultaneous mutlithreading processor,” SIGPLAN Not., vol. 35, pp. 234–244, November 2000. [18] A. Snavely, D. M. Tullsen, and G. Voelker, “Symbiotic jobscheduling with priorities for a simultaneous multithreading processor,” SIGMETRICS Perform. Eval. Rev., vol. 30, pp. 66–76, June 2002. [19] A. Settle, J. Kihm, A. Janiszewski, and D. Connors, “Architectural support for enhanced SMT job scheduling,” in Proceedings of the 13th International Conference on Parallel Architectures and Compilation Techniques, ser. PACT ’04, 2004, pp. 63–73. [20] S. Eyerman and L. Eeckhout, “Probabilistic job symbiosis modeling for SMT processor scheduling,” SIGPLAN Not., vol. 45, pp. 91–102, March 2010. [21] D. Tam, R. Azimi, and M. Stumm, “Thread clustering: sharing-aware scheduling on SMP-CMP-SMT multiprocessors,” SIGOPS Oper. Syst. Rev., vol. 41, pp. 47–58, March 2007.