Brett Kessler, Geoffrey Nunberg, and Hinrich Schütze. 1997. Automatic detection of text genre. ... Moisl and Harlod Somers (eds.). Magnus Sahlgren and Jussi ...
An Unsupervised Approach for the Detection of Outliers in Corpora David Guthrie, Louise Guthrie, Yorick Wilks NLP Research Group, Department of Computer Science, University of Sheffield Regent Court, 211 Portobello Street, Sheffield, S1 4DP {dguthrie,louise,yorick}@dcs.shef.ac.uk Abstract Many applications of computational linguistics are greatly influenced by the quality of corpora available and as automatically generated corpora continue to play an increasingly common role, it is essential that we not overlook the importance of well-constructed and homogeneous corpora. This paper describes an automatic approach to improving the homogeneity of corpora using an unsupervised method of statistical outlier detection to find documents and segments that do not belong in a corpus. We consider collections of corpora that are homogeneous with respect to topic (i.e. about the same subject), or genre (written for the same audience or from the same source) and use a combination of stylistic and lexical features of the texts to automatically identify pieces of text in these collections that break the homogeneity. These pieces of text that are significantly different from the rest of the corpus are likely to be errors that are out of place and should be removed from the corpus before it is used for other tasks. We evaluate our techniques by running extensive experiments over large artificially constructed corpora that each contain single pieces of text from a different topic, author, or genre than the rest of the collection and measure the accuracy of identifying these pieces of text without the use of training data. We show that when these pieces of text are reasonably large (1,000 words) we can reliably identify them in a corpus.
1.
Introduction
The availability of a wide array of electronic corpora and lexical recourses has had a dramatic impact on the study of languages and led to many of the most exciting advances in natural language processing and computational linguistics. Question answering, language modeling, automatic speech recognition, text classification, information extraction, machine translation and many other research areas have benefited greatly from availability of reliable corpora. Corpora plays such a large role in these fields that the selection, quality, and size of corpora is often much more important to the accuracy of a task than is a choice of a machine learning technique or the method used to perform that task. The creation and validation of corpora has generally relied on humans, but this can be a very expensive process and it becoming increasing common, in research, to use more automatic methods for corpus generation. Many automatic techniques (Hassel, 2001; Chen and Dumais, 2000; Sato and Sato, 1999) make use of the vast amount of text accessible on the World Wide Web to construct corpora that specifically meet the needs of an application. For instance, it is now possible to construct a corpus of editorials from newspapers, a corpus of Swedish news stories, a corpus about infectious diseases, or a corpus of movie reviews relatively quickly and cheaply. The construction of these corpora usually involves some form of information retrieval or automated scraping of web pages to gather relevant data, which can lead to errors in precision; where documents are gathered that should not have been. It is difficult to validate these corpora because this usually involves some form of human interaction, but automatic techniques for this type of validation or the identification of irrelevant pages, or outliers, are immediately useful. Outliers in corpora may not even have been introduced in the gathering stage, but at an earlier time. It is possible that because the corpus is taken from the Web it may naturally contain outliers or anomalies. A corpus that has been gath-
ered from an online bulletin board or wiki (such as the collaborative encyclopedia Wikipedia - www.wikipedia.org) may contain undesirable information because text may typically be added or edited by anyone on the Web. While this collaborative editing is the strength of these sites, allowing information to be continually checked for factuality by a large number of people, the corpus is constantly changing and at any time can contain entries that might be considered spam, such as advertising or gibberish messages, or even, more subtly, information that is an opinion rather than a fact, such as rants posted about political figures. It would be very helpful if these intrusions like spam and political rants could be identified automatically and removed from corpora so that applications that make use this corpora (a question answering system for example) do not propagate these errors.
2.
Overview
The goal of our research is to improve the integrity and homogeneity of corpora by automatically identifying pieces of text that should not be present (so that they may be removed from these corpora). This paper presents an initial investigation into a statistical approach to the detection of unusual or out of place text within a corpus. That is, text that is anomalous with respect to the rest of the corpus because it differs in a fundamental way and thus likely should not be in the corpus. We view this out of place text as a type of outlier and as such we approach the problem of spotting these pieces of text in a corpus as a type of outlier detection. We use the term outlier to refer to pieces of text or language that are anomalous or out of place with respect to the rest of a collection (or corpus). This notion of outlier in a collection of text has very little meaning if the collection is a heterogeneous or general corpus, such as the Web, the British National Corpus, or the Brown Corpus because these corpora are representative of a very wide selection of language, authors, topics, and genres. It would be very
3409
tricky, even for a human, to describe any of the texts in these corpora as outliers. It is much easier, however, if a collection is very homogenous, like a corpus of scientific articles about nanotechnology. It is then more obvious that text which differs significantly from this topic or genre, like articles about baseball, would be considered anomalies or outliers if they were included in this nanotechnology corpus. Kilgarriff (1997; Kilgarriff (2001), Kilgarriff and Rose (1998) and Sahlgren and Karlgren (2005) have explored methods to measure this notion of homogeneity within a corpus and these may be important for determining in what circumstances outlier detection is appropriate. It is likely that outlier detection techniques would only be appropriate for corpora that have a very high level of homogeneity. In this paper, however, we do not address the question of which corpora to attack or when is it appropriate to look for outliers. We do not consider any measurements of corpus homogeneity here, but have narrowed the problem so that we can determine techniques for identifying outliers when we are given a near homogeneous collection. We make use of corpora we know to be homogenous with respect to genre or topic and are interested in identifying any text in these corpora that are not homogenous and so, by our definition, are outliers.
3.
3.1. Simple Surface Features The simplest type of the features used are ones that count surface features of text.
• • • • • • • •
In addition to these features, we implemented many of the most popular readability metrics, which are calculated using the surface features above. Readability measures (Flesch, 1974) attempt to provide a rough indication of the reading level required for a text. These measures are obviously lacking where true readability is concerned because they do not directly capture the richness of the vocabulary, whether ideas flow logically, or the complexity of the grammatical structures used, but they are nonetheless useful as an approximation of how simple a text is to read. • • • • • • •
Characterizing Text
Given a corpus we represent each individual piece of text in the corpora as a vector, where the components correspond to various stylistic and lexical features. We use 158 features, many of which have been used in authorship identification (McColly and Weier, 1983; Smith, 1998; McEnery and Oakes, 2000), genre research (Biber, 1988; Biber, 1992; Kessler et al., 1997; Argamon et al., 2003) or research to detect stylistic inconsistency (Glover and Hirst, 1996). The rest of this section describes these features grouped by the type of processing necessary to compute them.
• • • • • •
• Percentage of words that are coordinating conjunctions • Percentage of sentences that begin with a subordinating or coordinating conjunctions (but, so, then, yet, if, because, unless, etc.) • Percentage of words that are articles • Percentage of words that are prepositions • Percentage of words that are pronouns
Average sentence length Average word length Average number of syllables per word Percentage of all words that have 3 or more syllables Percentage of all words that only have 1 syllable Percentage of long sentences (sentences greater than 15 words) Percentage of short sentences (sentences less than 8 words) Percentage of sentences that are questions Percentage of all characters that are punctuation characters Percentage of all characters that are semicolons Percentage of all characters that are commas Percentage of all words that have 6 or more letters Percentage of all words that are pronouns Percentage of words that are subordinating conjunctions
Flesch-Kincaid Reading Ease Flesch-Kincaid Grade Level Gunning-Fog Index Coleman-Liau Formula Automated Readability Index Lix Formula SMOG Index
3.2. Vocabulary Obscurity We hypothesize that one distinguishing feature of writing is how ordinary or obscure the choice of vocabulary is and we have created some features that attempt to capture this. We measure this on a segment of text by calculating how frequently words from that segment appear in 10 years of newswire using the Gigaword Corpus (Graff, 2003). First we ranked all words by frequency in the Gigaword corpus, and then we make sets of words based on these frequencies. We then measure the distribution of words in these sets for pieces of text. 1. 2. 3. 4. 5. 6. 7.
Top 1000 words Top 5000 words Top 10,000 words Top 50,000 words Top 100,000 words Top 200,000 words Top 300,000 words
So, for any piece of text, we compute the percentage of its words that occur in each of these 7 sets of words. 3.3. Part of Speech Distributions We use the RASP (Robust and Accurate Statistical Parser) system (Briscoe et al., 2006) to tag every word in a text with its corresponding part of speech, and then use of the distribution of the various parts of speech, as features.
3410
• Percentage of words that are adjectives • Percentage of words that are adverbs • Percentage of words that are interrogative words (who, what, where when, etc.)
• • • • • •
Percentage of words that are nouns Percentage of words that are verbs Ratio of number of adjectives to nouns Percentage of words that are articles Percentage of words that are prepositions Diversity of POS tri-grams � � number of different POS trigrams × 100 total number of POS trigrams
The output from the RASP system is also used to compute some more general features that make use of parts of speech and word lemmas. • Percentage of passive sentences — Sentences are counted as passive if they contain the following pattern: (Form of the verb be)(adv)*(past tense of a verb) • Percentage of words nominalizations — Nominalizations are spotted by searching the suffixes for the word suffixes tion, ment, ence, and, ance.
pieces of text that are outliers). For the purpose of describing the outlier detection procedure, we refer to the n rows of the feature matrix as observations and the p columns as the variables. We make use of the Stahel-Donoho Estimator for the identification of outliers in text, as it is especially suited to data with a large number of dimensions (features). The Stahel-Donoho Estimator was independently introduced by Stahel (1981) and Donoho (1982) and works by the simple idea of projecting the data down to one dimension in space and measuring the outlyingness of observations in that dimension. The goal is to find the projection of the data onto a direction that maximizes an observation’s robust z-score in that direction. This estimator has been thoroughly investigated in the context of location estimation in statistical data and has been shown to have many desirable properties including resistance to outliers and affine equivariance (Maronna and Yohai, 1995; Donoho, 1982; Donoho and Gasko, 1992). Let a be a direction (unit length column vector) in Rp then the outlyingness, SD, of an observation xi (row vector) can be estimated as: SD(xi ) = max
3.4. Emotional Tone Features The General Inquirer Dictionary (http://www.wjh. harvard.edu/˜inquirer/), developed by the social science department at Harvard, contains mappings from words to social science content-analysis categories. These content-analysis categories attempt to capture the tone, attitude, outlook, or perspective of words. We make use of the 112 Harvard IV-4 categories plus the 2 large ‘positive’ and ‘negative’ categories. The percentage of words in a text that occur in each of these categories is stored as a feature. A sample of the General Inquirer Categories used as features are shown in Table 11 . Positive Hostile Casual slang Know Need Affection Passive Agreement
Negative Self-referencing Think Compare Pleasure Work Overstated Disagreement
Strong Weak Negate Person Relations Pain Active Understated Virtue
Table 1: A sample of some of the General Inquirer Harvard IV-4 Categories
4.
Method
A vector of features is stored for every piece of text in our corpus. Let xi be the vector of features for the ith piece of text. An n × p feature matrix, X, is created where the rows of this matrix correspond to pieces of text in the corpus, and the columns correspond to features. This research aims to identify rows of this matrix that are outliers (and thus 1
A detailed list of all categories and their descriptions can be found at http://www.wjh.harvard.edu/˜inquirer/ homecat.htm
a
xi a − median(Xa) mad(Xa)
Where xi a is the projection of observation xi in direction a and mad is the median absolute deviation that is computed as: mad(z) = 1.4826 × median |zi − median(z)| i=1,...,n
The difficulty in computing this measure is that there are infinitely many directions that the data can be projected onto and thus it is not possible to test every direction to determine which gives the largest distance. In practice, one chooses a finite set of directions to project the data onto and then picks, for every observation, the direction that maximizes its distance from the other observations. After the maximum distance for each observation (over the finite set of projection directions) is calculated, these distances, SDi are then rescaled and a re-weighting step is performed (see Maronna and Yohai (1995) and Guthrie (2008) for details of this step). Lastly, we use a cutoff and identify observations as outliers whose re-weighted distances, d, are greater than that cutoff. cutoff = median(d) + 5 × mad(d) There has been little research on how best to choose a set of directions for use with the SDE when the number of features is very large, as in this case, where we have over 150 variables that we are using to characterize text. We can lessen this problem if we first reduce the number of dimensions in our data using principal component analysis. This is achieved by calculating the singular value decomposition of the centered feature matrix X = UΛV and taking UΛ to be our new feature matrix. This new feature matrix will be at most dimension n × n and results in no loss of information for this purpose(Hubert et al., 2005). This procedure was used as and initial step on the feature matrix to reduce the number of dimensions before computing the Stahel-Donoho Estimator for all experiments presented in this paper.
3411
The approach we take for choosing directions is one which was used by Struyf and Rousseeuw (2000) for the task of finding the deepest location in multivariate data (which is closely related to outlier detection). We choose 2000 directions of the 5 types described by Struyf and Rousseeuw (2000). (More information on this exact procedure can be found in Guthrie (2008).)
5.
Experiments
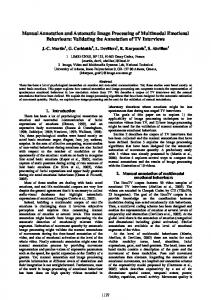
In each of the experiments we use exactly 50 random pieces of text from the Gigaword (Graff, 2003) corpus of newswire to represent our “normal” corpus and we select one piece of text from a different source to act as an outlier either from a newspaper editorial, translation of a news story, or from another genre and insert it into the corpus. We then measure the accuracy of our technique in automatically identifying these inserted segments as outliers. We perform a range of experiments allow the size of texts in our corpus to be either 100, 500, or 1000 words long. 5.1. Newswire versus Anarchist Cookbook In this set of experiments we evaluate whether segments from the Anarchist Cookbook can be detected in a collection of news wire using our outlier detection techniques. This experiment was designed to test if we could identify very different genres as outliers in a corpus. The Anarchist Cookbook contains recipes for the manufacture of explosives, instructions for building telecommunications phreaking devices, and other illegal activities. This writing is very procedural, as it is instructions and recipes, and also informal (e.g. “When the fuse contacts the balloon, watch out!!!”). This is very different from newswire text which is more formal but less procedural. Collections were created by taking fifty random segments of text from the Gigaword and one randomly drawn segment from the 30 thousand word Anarchist Cookbook. We created 200 of these collections for each segment size of text (100, 500, or 1000 words). We then used computed a feature matrix for each collection and label each piece of text in the collection as an outlier or non-outlier. The results for these experiments are shown using the cutoff given in section 4 and with an evenly balanced F -measure. Recall =
Precision = F= Segsize (words) 100 500 1000
outliers correctly identified total # of ouliers
5.2.
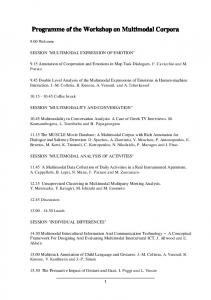
We also tested whether opinion text can be detected in a factual story. We created test test collection by taking random pieces of text from the Gigaword newswire corpus and inserting a single piece of text taken from newspaper editorials. The test documents used come from similar sources (newspapers and newswire), but the style of the writing is different as the newswire stories report facts and the newspaper editorials are opinion pieces. The opinion text used as outliers in these test collections is made up of editorials from 4 newspapers making up a total of 28,200 words: • • • •
Segsize (words) 100 500 1000
Precision 61.5 30.0 57.7
Recall 32.0 48.0 65.2
F -measure 42.1 37.5 61.2
Table 3: Newswire with Opinion Editorial outliers: F measure results
5.3.
Newswire versus Machine Translations
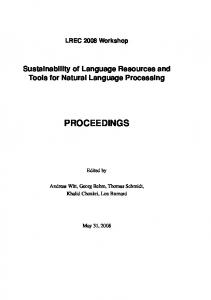
For these experiments examine whether Chinese newspaper segments that have been automatically translated into English can be detected in a collection of English newswire. The translations of Chinese news articles are a very similar genre to the English newswire, but the translations are far from perfect and so the language use is very odd. We use a corpus of 35 thousand words of Chinese newspaper segments that were hand picked by a native chinese speaker and then translated into English using Google’s Chinese to English translation engine. Test collections are created as in the previous experiments, by randomly selecting pieces of text. Segsize (words) 100 500 1000
2 × Precision × Recall Recall + Precision Recall 30.0 98.0 70.7
Guardian New Statesman New York Times Telegraph
As in the previous experiment, 200 test collections are randomly created for each segment size and outlier detection is performed on these collections labeling each piece of text as a non-outlier or outlier.
outliers correctly identified pieces of text marked as outliers
Precision 66.0 49.0 83.5
Fact versus Opinion
Precision 63.3 42.2 71.9
Recall 38.0 77.6 92.0
F -measure 47.5 54.7 80.7
Table 4: Newswire with automatically translated Chinese news outliers: F -measure results
F -measure 41.3 65.3 76.5
Table 2: Newswire with Anarchist Cookbook outliers: F measure results
6.
Conclusion
This paper shows that this type of outlier detection can be a valuable tool for corpus linguistics. We introduce a methodology for identifying outliers in corpora and show
3412
some initial results of its use on artificially created collections. The results illustrate that for large segments of text it is possible to achieve fairly good results detecting outliers in some types of corpora. For instance, an average of 92% of translations of chinese news stories can be identified in corpora composed of newswire with a precision of 71.9%. This is a very good result given that this procedure is completely unsupervised and makes use of no training data. The fact versus opinion experiments proved to be a much more difficult task and on average achieve only a 61% F -measure for large pieces of text. These results are somewhat disappointing, but this is a difficult task as we are attempting to label every piece of text as either an outlier or non-outlier. The results of this labeling are closely tied to the cutoff used for determining which observations are farthest away from the rest of the data. While choosing a cutoff to automatically separate outliers from non-outliers is difficult, other experimental results (Guthrie, 2008) performed on these corpora indicate that using this detection method often results in the outlying piece of text having the greatest distance from the rest of the corpus. Further research is ongoing to see if this cutoff can be more intelligently chosen to improve the accuracy of results on this task.
7.
References
Shlomo Argamon, Moshe Koppel, Jonathan Fine, and Anat Rachel Shimoni. 2003. Gender, genre, and writing style in formal written texts. Text, 23(3):321—346. Douglas Biber. 1988. Variation Across Speech and Writing. Cambridge University Press, Cambridge. Douglas Biber. 1992. The multi-dimensional approach to linguistic analyses of genre variation: An overview of methodology and findings. Computers and the Humanities, 26(5):331–345. Ted Briscoe, John Carroll, and Rebecca Watson. 2006. The second release of the rasp system. In Proceedings of the 21st International Conference on Computational Linguistics and 44th Annual Meeting of the Association for Computational Linguistics, Proceedings of the Conference, (ACL/COLING–06), Sydney, Australia. Hao Chen and Susan T. Dumais. 2000. Bringing order to the Web: automatically categorizing search results. In Proceedings of CHI-00, ACM International Conference on Human Factors in Computing Systems, pages 145– 152, Den Haag, NL. ACM Press, New York, US. David L. Donoho and Miriam Gasko. 1992. Breakdown properties of location estimates based on halfspace depth and projected outlyingness. The Annals of Statistics, 20(4):1803–1827, December. David L. Donoho. 1982. Breakdown properties of multivariate location estimators. Ph.D. qualifying paper, Harvard University. Rudolf Flesch. 1974. The Art of Readable Writing. Harper and Row, New York. Angela Glover and Graeme Hirst. 1996. Detecting stylistic inconsistencies in collaborative writing. In Sharples, Mike and van der Geest, Thea (eds.), The new writing environment: Writers at work in a world of technology, Springer-Verlag, London.
David Graff. 2003. English gigaword. Linguistic Data Consortium, catalog number LDC2003T05. David Guthrie. 2008. Unsupervised Detection of Anomalous Text (working title). Ph.D. thesis, University of Sheffield. Martin Hassel. 2001. Internet as corpus - automatic construction of a swedish news corpus. In Proceedings of the 13th Nordic Conference on Computational Linguistics (NODALIDA01), Uppsala, Sweden, May. Mia Hubert, Peter J. Rousseeuw, and Karlien Vanden Branden. 2005. Robpca: a new approach to robust principal component analysis. Technometrics, 47:64–79. Brett Kessler, Geoffrey Nunberg, and Hinrich Sch¨utze. 1997. Automatic detection of text genre. In Proceedings of the 35th Annual Meeting of the Association for Computational Linguistics (ACL–97), pages 32–38. Adam Kilgarriff and Tony Rose. 1998. Measures for corpus similarity and homogeneity. In Proceedings of the 3rd conference on Empirical Methods in Natural Language Processing, pages 46–52, Granada, Spain. Adam Kilgarriff. 1997. Using word frequency lists to measure corpus homogeneity and similarity between corpora. In Proceedings ACL SIGDAT workshop on very large corpora, pages 231–245, Beijing and Hong Kong, August. Adam Kilgarriff. 2001. Comparing corpora. International Journal of Corpus Linguistics, 6(1):1–37. Ricardo A. Maronna and Victor J. Yohai. 1995. The behavior of the stahel-donoho robust multivariate estimator. Journal of the American Statistical Association, 90(429):330–341, March. William McColly and Dennis Weier. 1983. Literary attribution and likelihood-ratio tests: The case of the Middle English Pearl poems. Computers and the Humanities, 17(2):45–97, June. Tony McEnery and Michael Oakes, 2000. Hanbook of Natural Language Processing, chapter Authorship Identification and Computational Stylometry, pages 545–562. Marcel Dekker, New York. Robert Dale and Hermann Moisl and Harlod Somers (eds.). Magnus Sahlgren and Jussi Karlgren. 2005. Counting lumps in word space: Density as a measure of corpus homogeneity. In Proceedings of the 12th International Conference on String Processing and Information Retrieval (SPIRE05), pages 151–154, Buenos Aires, Argentine. Satoshi Sato and Madoka Sato. 1999. Toward automatic generation of web directories. In Proceedings of International Symposium on Digital Libraries (ISDL99), pages 127–134, Tsukuba, Japan, September. MWA Smith. 1998. The authorship of acts i and ii of pericles: A new approach using first words of speeches. Computers and the Humanities, 22:23–41. Werner A. Stahel. 1981. Breakdown of covariance estimators. Resarch Report 31, Fachgruppe f¨ur Statistik, Swiss Federal Institute of Technology (ETH), Z¨urich. Anja Struyf and Peter J. Rousseeuw. 2000. Highdimensional computation of the deepest location. Computational Statistics and Data Analysis, 34(4):415–426.
3413