ISSN 0354-8724 (hard copy) | ISSN 1820-7138 (online)
An utilization of the GIS and multidimensional statistical methods on the chosen EU universities: similarities assessment Škrabuľáková ErikaA*, Ivanová MonikaB, Gallovičová AnnaA Received: July 14, 2014 | Revised: August 19, 2014 | Accepted: August 27, 2014
Abstract The paper deals with the analysis of the similarity’s rate of 81 universities and other schools of university’s type in EU all of which have in this consideration the same status. From each state of the European Union, three largest universities according to the number of students criterion were chosen (when such an amount of universities was existing in the considered state) and added to our database. We have used hierarchical clustering methods based on the simple join of several clusters as well as methods of explorative analysis presented by some profile diagrams in order to compare these universities. As the space analysis created in the geographical information system environment is joined here with the methods of mathematical statistics, we consider the paper being important both from the interdisciplinary and the statistical-environment analysis point of view. It points out to the fact that multi-dimensional statistical methods methods methods can be used also at interdisciplinary level. Keywords: Clustering and multidimensional statistical methods; GIS; database of EU universities
Introduction
A data analysis on a base of multidimensional statistical methods is used in the statistical data processing very often. It requires computer usage, well defined own research problem (the formulation of a task), as well as some knowledge about an interpretation of obtained results. Even if the usage-effectivity of the information obtained from the multidimensional statistical data is not comparable with the one-dimensional analysis result, one can still feel some fear to use it in other fields than mathematics. This is surprising as it already appeared in the connection to several spheres of life since 60’s (see e. g. Gower, 1966; Mardia, 1970; Hoffman, Franke, 1986; Faber, 1999; Maronna, Zamar, 2002; Daszykowski, et al., 2003). The aim of this work was to analyze the similarity’s rate of 81 universities of the European Union using geographical data and processing them by hierarchical clustering methods
and profile diagrams. From each state of the European Union (EU), at most 3 largest universities (in terms of the number of students) were chosen and added to our database (when there were at least 3 universities in the considered state, else all of the universities of the state were chosen). These universities were compared according to these criteria: number of students, number of teachers (pedagogical staff) and number of faculties. By this work we would like to point out at the possibility to use GIS and multidimensional statistical data-analysis also in the non-mathematical field of research.
Data and methods
The first task we needed to solve in order to fulfill the aim of our research was to built out the input database in the ArcGIS environment. Geographic information
A Faculty
of Mining, Ecology, Process Control and Geotechnology, Technical University of Košice, Košice, Slovak Republic; erika.
[email protected],
[email protected] B Faculty of Humanities and Natural Sciences, University of Prešov, Prešov, Slovak Republic;
[email protected] * Corresponding author: Škrabuľáková Erika, e-mail:
[email protected], telephone: 00421-55-602-5162
62 Geographica Pannonica • Volume 18, Issue 3, 62-68 (September 2014)
Škrabuľáková Erika, Ivanová Monika, Gallovičová Anna
system (GIS) stands as a powerful tool not only in geographic and environmental sciences, but also in social sciences as well, where data processing is required for mapping and spatial modeling (Franke, 1982; Lam, 1983; Burrough, 1986; Boltižiar, Vojtek, 2009; Hrnjak, et al., 2014). This task was very time-consuming since, as the first step, we needed to find and identify the 3 largest universities (in terms of the number of students) or schools of university’s type (in this consideration they have the same status as universities) in each state of EU. Sometimes even the base comparation of universities of one single state was uneasy. The processing level of the universities’ webpages were very different, there were a lot of data unpublished there and we needed to ask for them consequently by sending requests to study-departments of several universities. The major problem was also to find out to which time period the published data are related. As each university refers the number of students to the different date, we chose only the fall 2013 as a reference time of our data. The second step was to compare the universities according to the number of students and number of teachers (pedagogical staff). A powerful tool for such an analysis is the ArcMap application of program ArcGIS. In this application, the universities were depicted by rings (the carthodiagram method) of size directly proportional to the number of students of each university. The number of students was divided into 5 intervals according to Natural Breaks (Jenks) method. The boundaries of intervals were manually customized by half-correction. The size analysis was supplemented by spatial location of the chosen universities according to their size in the considered state of EU. After the database creation in the ArcGIS environment we had transmit these data into the program Statistica 12 and analyzed these multidimensional data by the hierarchical clustering methods. The aim of this part was to divide these universities on the base of similarity’s rate comparation according to their number of students, number of teachers (pedagogical staff) and faculties. These multidimensional statistical methods of hierarchical clustering were supplemented by the results of explorative analysis presented by profile diagrams.
Results and discussion
Cluster analysis is one of the methods that enable to examine the similarities of multidimensional objects. One of the most frequently used distance gauge is the Euclid distance that, on the base of the distance of two objects, is able to determine their similarity’s rate. In general, the smaller the Euclid distance between the two objects is, the more similar are these objects (Jain
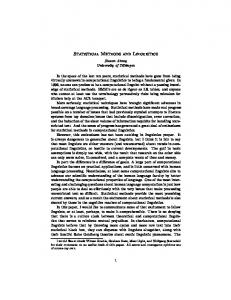
et al., 1999). There were hierarchical clustering methods used in this paper. They are based on the hierarchical arrangement of the objects and their clusters. From the graphical point of view, the hierarchical arranged clusters are figured out by a dendrogram. In our research, we used the tools of hierarchical clustering on the basis of a simple joining of the clusters (the type of clustering technique: simple caliber, simple average). The similarity’s rate was determined according to the Euclid distance. We proceed in the direction from the top to the base; hence, firstly, each university represented one cluster. On the base of similarities of the initial data the universities were clustered into groups of similarities and at the end joined into one big cluster containing all universities. By depicting the dendrogram for all the universities according to the chosen parameters: number of students, number of teachers and number of faculties, it seemed so that the Open University in Milton Keynes (Great Britain) was a remarkable outlier with 240 000 students and 8 100 pedagogues at 8 faculties. One can compare it with the University of Primorska in Koper (Slovenia) with 36 times lesser students studying at 7 faculties. There is a big difference also in the number of students even in the comparation with the second biggest university - Sapienza University of Rome (Italy) where there are 1.9 times lesser students as at the Open University in Milton Keynes. This was the reason why we had excluded the Open University in Milton Keynes from our statistical database used for creating the dendrogram by the second analysis approach - see Figure 1. As the effect we reached a higher readability of the figure and decreasing opacity of the small clusters formed by the other universities. The highest similarity between two universities according to 2 out of 3 criteria have the Aalto University in Finland and the University of Maribor in Slovenia: Aalto University - 19 993 students, 1 786 teachers; University of Maribor– 20 025 students, 1 814 teachers), but while one of these universities has 6 faculties, the other one has 17. There is also a high similarity between the Near East University (Nicosia, Cyprus) and the Mykolas Romeris University (Vilnius, Lithuania). There are cca. 20 000 students studying there too, but the number of pedagogical staff is smaller here (730 in the case of Near East University and 878 in the case of Mykolas Romeris University) but their numbers of faculties differ a lot: Near East University 16; Mykolas Romeris University 6. When we compare all 4 of the universities mentioned above, according to the number of faculties, the higher similarity is between the Aalto University and the Mykolas Romeris University with 6 faculties each, and on the other side, the University of Maribor and the Near East University, where this number differs only by 1. From this exam-
Geographica Pannonica • Volume 18, Issue 3, 62-68 (September 2014) 63
An utilization of the GIS and multidimensional statistical methods on the chosen EU universities: similarities assessment
Figure 1. Similarity of universities according to the selected parameters: number of students, number of pedagogues and number of faculties - selected part of the dendrogram (x-axis: Euclid distance of objects; y-axis: PiUniversity marked by i in Table 1, 2 and 3 respectively). Source: Authors research.
ple comes out that the higher influences on the rate of similarity between two universities have the number of students and pedagogical staff than the number of faculties. This is a reflection of the Euclid metrics in the background of the comparation. As the size of each university is mainly considered by the number of students and teachers, the number of faculties plays only a secondary role here. There were also some remarkable similarities between the universities 29 and 65, 54 and 52, 10 and 61, 27 and 72, 11 and 4, 41 and 63 or 39 and 55 - see Figure 1 and for the full names of universities Table 1, Table 2 and Table 3.
On the other hand, when we would like to identify the most differing universities in our statistical database, it seems to be appropriate to observe the distance connection 10 000 in our dendrogram. There are 3 clusters at this point of visible disproportionalities. The first cluster is built out of the National and Kapodistrian University (Athens, Greece), the University of London (London, Great Britain) and the Sapienza University of Rome (Rome, Italy), the second cluster is built out of the Aristotle University (Solon, Greece), the Complutense University of Madrid (Madrid, Spain), the University of Bologna (Bologna, Italy), the University of Hagen (Hagen, Germany) and the University of Vienna (Vienna, Austria) and the third one is built out of all the other universities. In the first group the number of students belongs to the interval 120 000 – 130 000 and the number of pedagogues is out of the interval 1 900 - 6 200, in the second group the number of students is from the interval 81 500 - 86 000, the number of pedagogues 1 700 - 3 500. In the third cluster there are universities with wide-spread variability of both number of students (4 000 - 93 000) and number of teachers (450 – 8 650). Out of this cluster, the smallest number of students study at the Turiba University (Turiba, Latvia) 4 826, the highest amount (92 486) of students study at University of Vienna (Vienna, Austria). The number of pedagogues vary in this group from 461 - Tallinn University (Tallinn, Estonia) to 8 622 - Ghent Unversity (Ghent, Belgium). One can refer to the quality of education from the aspect of rate between the number of students and the number of teachers at each university. From this point of view the outlying position has the Ghent University where there are circa 36 000 students to 8 600 pedagogues. That means one pedagogue can teach small groups of 4-5 students - see Figure 2. Some of the universities, like the University of Vienna (Vienna, Austria) with 92 486 students and University of Zagreb (Zagreb, Croatia) with 72 480 students can be given to the second cluster according to the number of students, but as there is a big rate between the number of students and number of pedagogues, they are in the third cluster - see Figure 1. Table 1. List of the universities marked by numbers from 1 up to 6. No. University
City
State
1
Universität Graz
Graz
Austria
2
Universität Wien
Vienna
Austria
3
Technische Universität Wien
Vienna
Austria
4
Université Libre de Bruxelles
Brussels
Belgium
5
Universiteit Gent
Ghent
Belgium
6
Katholieke Universiteit
Leuven
Belgium
64 Geographica Pannonica • Volume 18, Issue 3, 62-68 (September 2014)
Škrabuľáková Erika, Ivanová Monika, Gallovičová Anna
Figure 2. Rate of the number of students and number of teachers at selected universities of the European Union. Source: Authors research.
Table 2. List of the universities marked by numbers from 7 up to 42. No. University 7 South-West University 8 Sofia university University of National 9 and World Economy 10 Sveucilište u Rijeci 11 Sveucilište u Splitu 12 Sveucilište u Zagrebu Eastern Mediterranean 13 University Cyprus International 14 University 15 Near East University 16
Masarykova Univerzita
17
Univerzita Karlova
18 19 20 21 22 23 24 25
Česká zemědelská univerzita Aarhus Universitet Københavns Universitet Syddansk Universitet Tallinna Tehnikaülikool Tallinna Ülikool Tartu Ülikool Aalto-yliopisto
City Blagoevgrad Sofia
State Bulgaria Bulgaria
Sofia
Bulgaria
Rjeka Split Zagreb
Croatia Croatia Croatia
Famagusta
Cyprus
Lefkosia
Cyprus
Nikosia
Cyprus Czech Brno Republic Czech Prague Republic Czech Prague Republic Aarhus Denmark Copenhagen Denmark Odense Denmark Talinn Estonia Talinn Estonia Tartu Estonia Aalto Finland
No. University 26 Helsingin Yliopisto 27 Turun Yliopisto Université Claude 28 Bernard Lyon I Université Paris 1 29 Panthéon-Sorbonne 30 Université Paris Descartes 31 Fernuniversität in Hagen 32 Universität zu Köln Ludwig-Maximilians33 Universität National and 34 Kapodistrian University 35 University of Patras 36 Aristotle University Eötvös Loránd 37 Tudományegyetem 38 Debreceni Egyetem Szegedi 39 Tudományegyetem 40 University College Cork 41 University College Dublin National University of 42 Ireland
City Helsinki Turun
State Finland Finland
Lyon
France
Paris
France
Paris Hagen Cologne
France Germany Germany
Munnich
Germany
Athens
Greece
Patras Thessaloniki
Greece Greece
Budapest
Hungary
Debrecen
Hungary
Szeged
Hungary
Cork Dublin
Ireland Ireland
Galloway
Ireland
Geographica Pannonica • Volume 18, Issue 3, 62-68 (September 2014) 65
An utilization of the GIS and multidimensional statistical methods on the chosen EU universities: similarities assessment
Table 3. List of the universities marked by numbers from 43 up to 81. No. University
City
State
No. University
City
State
61
Universidade do Minho
Bragg
Portugal
62
Universidade de Lisboa
Lisbon
Portugal
63
Universidade do Porto
Porto
Portugal
64
Universitatea din Bucuresti
Bucharest
Romania
Latvia
65
Universitatea BabesBolyai
Cluj Napoca
Romania
Riga
Latvia
66
Universitatea Alexandru Ioan Cuza
Iasi
Romania
Biznesa Augstskola Turiba
Turiba
Latvia
67
Univerzita Komenského
Bratislava
Slovakia
49
Kauno Technologijos Universitetas
Kaunas
Lithuania
68
Slovenská technická univerzita
Bratislava
Slovakia
50
Vilniaus Universitetas
Vilnius
Lithuania
69
Technická univerzita
Kosice
Slovakia
Mykolo Romerio Universitetas
70
Univerza na Primorskem Koper
Slovenia
51
Vilnius
Lithuania
71
Univerza v Ljubljani
Ljubljana
Slovenia
52
Université du Luxembourg
Luxembourg Luxembourg
72
Univerza v Mariboru
Maribor
Slovenia
53
University of Malta
Valetta
Malta
73
Universidad de Barcelona
Barcelona
Spain
54
Malta College of Arts, Science and Technology
Valetta
Malta
74
Universidad de Granada
Granada
Spain
Universiteit van Amsterdam
Madrid
Spain
Amsterdam
The Netherlands
75
55
Universidad Complutense de Madrid
76
Göteborgs Universitet
Goteborg
Sweden
56
Rijksuniversiteit Groningen
Groningen
The Netherlands
77
Lunds Universitet
Lund
Sweden
78
Uppsala Universitet
Uppsala
Sweden
79
University of London
London
Great Britain
80
University of Manchester
Manchester
Great Britain
81
Open University
Milton Keynes
Great Britain
43
Università degli Studi di Bologna
Bologna
Italy
44
Università degli Studi di Milano
Milan
Italy
45
Università degli Studi di Roma La Sapienza
Rome
Italy
46
Latvijas Universitate
Riga
47
Rigas Tehniska Universitate
48
57
Universiteit Utrecht
Utrecht
The Netherlands
58
Uniwersytet Jagiellonski
Krakow
Poland
59
Uniwersytet im. Adama Mickiewicza
Poznan
Poland
60
Uniwersytet Warszawski
Warsaw
Poland
Exploratory Analysis
Focusing on the research analysis of the data (even before the analysis of multidimensional data according to the multidimensional statistical methods) one can use several techniques to outdraw these data into the two-dimensional coordination space. One such possibility is the usage of symbolic graphs where all the characters are coded according to real values into different geometric shapes. From this outdraw, one can deduce the vectors, or coordinates of the vectors, that seems to be outlying from the statistical database, respectively, it allows to identify several structures in the data (see Meloun, et al., 2012). In order to fulfill the aims of our research, we had used profile diagrams that belong to a group of iconic graphs. Each fault of the curve represents a new value of considered parameter of either number of students, number of pedagogues or number of faculties (with this order) in the graph on Figure 3 (For the names of universities here see Table 1, Table 2 and Table 3).
As one can see from the profile diagrams, a remarkable outlier from the number of students point of view is the Open University in Milton Keynes in Great Britain with 240 000 students. This one is followed by the Sapienza University in Rome (128 963 students), the National and Kapodistrian University (122 000 students), the University of Vienna (92 486 students), the University of Hagen (85 051 students), the National Aristotle University (81 500 students) and also the University of Zagreb (72 480 students). The least number of students, 4 826, has the Turiba University. The absolute leader in the case of number of faculties is the National and Kapodistrian University with 32 faculties (122 000 students and 1 900 pedagogues). The high amount of faculties - 26, has also the University of Madrid with 84 837 students. Even if the Open University in Milton Keynes has almost twice more students than the Kapodistrian University, the number of faculties here is 4 times smaller. On the other hand, the smallest university from our database, Tu-
66 Geographica Pannonica • Volume 18, Issue 3, 62-68 (September 2014)
Škrabuľáková Erika, Ivanová Monika, Gallovičová Anna
Figure 3. Profile diagram of the similarities of number of students, number of pedagogues and number of faculties Source: Authors research.
riba University, has only half number of faculties than the Open University in Milton Keynes. As it was already mentioned above, one of the criteria of education quality could be the ratio between the number of students and the number of pedagogues at each university. As this information is not well readable from the graph, we used the program Microsoft Excel in order to find it out. One can suppose that the smaller this rate is, the higher quality it can reflect. It points out to the greater possibility of self-realization and individual approach of the teacher to the student. But this information cannot be generalized. The smallest number of students for one pedagogue have universities in Ghent (4 students per 1 pedagogue) and Leuven (6 students per 1 pedagogue), both in Belgium. A similar situation is in Denmark in Odense (cca. 7 students per 1 pedagogue) and Copenhagen (cca. 8 students per 1 pedagogue), as well as in Great Britain in Manchester (cca. 7 students per 1 pedagogue), in Schweden in Uppsala (cca. 7 students per 1 pedagogue) and in Portugal in Lisbon (cca. 8 students per 1 pedagogue). On the other side, the highest number of students per one teacher, cca. 49, is at the University of Hagen in Germany and at the Alexandru
Ioan Cuza University of Iasi in Romania, cca. 34. Approximately 30 students per one pedagogue have also the Open University in Milton Keynes in Great Britain and the universities in Bologna and Milan in Italy.
Conclusion
The main aim of this paper was to point out to the rate of similarity between 81 chosen universities of the European Union by using the tools of geographical information systems and multidimensional statistical methods. Their coalescence enables us to observe the similarities and differences in the analyzed structures, as well as to cartographically and graphically figure out the pointers of number of students, pedagogues and faculties. In order to make the explorative analysis of the data, we used profile diagrams, which helped us to discover most outlying objects in our structure. The remarkable outlier was the Open University in Milton Keynes in Great Britain, which was executed from our statistical database for creating a dendrogram thanks to enormous number of students studying there. To compare it with the second biggest university, Sapienza University of Rome in Italy, the
Geographica Pannonica • Volume 18, Issue 3, 62-68 (September 2014) 67
An utilization of the GIS and multidimensional statistical methods on the chosen EU universities: similarities assessment
number of students here was cca. 1.9 times greater and almost 50 times greater than at the smallest university in our database - the University of Turiba (Turiba, Latvia). The second pointer was the number of pedagogues at each university. As the number itself is unimportant if it is not compared with the number of students at the considered university, we asked us a question how many students per 1 teacher are at each university. Here the information was remarkable set apart. The greatest values were counted for the University of Hagen (cca. 49 students per teacher) and the Alexandru Ioan Cuza University of Iasi in Romania (cca. 34 students per teacher), the smallest number was counted for the University of Ghent (cca. 4 students per teacher). The results of hierarchical clustering methods pointed out at the fact, that the size of the university is primary considered from the number of students point of view and number of pedagogues. The number of faculties plays only a secondary role here. The highest similarity between two universities in the first cluster had the National Kapodistrian University (Athens, Greece) with the University of London (London, Great Britain) and the Sapienza University of Rome (Rome, Italy); in the second cluster the Aristotle University (Solon, Greece) with the Complutense University of Madrid (Madrid, Spain), the University of Bologna (Bologna, Italy), the University of Hagen (Hagen, Germany) and the University of Vienna (Vienna, Austria) and in the third cluster there were all remaining universities. The analysis of the results showed that several universities that seemed to belong to the second cluster according to the number of students were associated with the third one due to a big ratio between the number of students and number of pedagogues here.
Acknowledgment
This work was supported by the Slovak Research and Development Agency under the contract No. APVV0482-11, by the grants KEGA 040TUKE 4/2014, KEGA 025PU-4/2012, VEGA 1/0497/11, VEGA 1/0070/11 and VEGA 1/0130/12. We would like to express our sincere gratitude to the anonymous referees for their valuable reviews, helpful comments and suggestions that improved the quality of the manuscript.
References
Boltižiar, M., Vojtek, M. 2009.Geografické informačné systémy pre geografov II (Geographical information systems for geographs II), Nitra, Fakulta prírodných vied Univerzity Konštantína Filozofa v Nitre, 140 pp. Burrough, P.A. 1986. Principles of geographical information systems for land resources assessment. Oxford University Press, Clarendon, Oxford, 220 pp. Daszykowski, M., Walczak, B., Massart, D.L. 2003. Projection methods in chemistry, Chemometrics and Intelligent Laboratory Systems 65-1, 97-112. DOI: 10.1016/S0169-7439(02)00107-7. Faber, N.M. 1999. Modification of Malinowski’s F-test for pseudorank estimation revisited, Computers and Chemistry 23-6, 565-570. Franke, R. 1982. Scattered data interpolation: tests of some methods, Mathematics of Computation 38, 157, 181–200. Gower, J.C. 1966. Some distance properties of latent root and vector methods used in multivariate analysis, Biometrika 53, 3/4, 325-338. Hoffman, D.L., Franke, G.R. 1986. Correspondence analysis: graphical representation of categorical data in marketing research, Journal of Marketing Research 23-3, 213-227. Hrnjak, I., Lukić, T., Gavrilov, M.B., Marković, S.B., Unkašević, M., Tošić, I. 2014. Aridity in Vojvodina, Serbia, Theoretical and Applied Climatology 115, 1/2, 323-332. DOI: 10.1007/s00704-013-0893-1. Jain, A.K., Murty, M.N., Flynn, P.J. 1999. Data clustering: a review, ACM Computing Surveys 31-3, 264323. Lam, N.S-N. 1983. Spatial interpolation methods: a review, The American Cartographer 10-2, 129–150. Mardia, K.V. 1970. Measures of multivariate skewness and kurtosis with applications, Biometrika 573, 519-530. Maronna, R.A., Zamar, R.H. 2002. Robust estimates of location and dispersion for high-dimensional datasets, Technometrics 44-4, 307-317. Meloun, M., Militký, J., Hill, M. 2012. Statistická analýza vícerozměrných dat v příkladech (Statistical analysis of the multidimensional data in tasks), Prague, Academia, 750pp.
68 Geographica Pannonica • Volume 18, Issue 3, 62-68 (September 2014)