Dr. Joner is a consultant for Biotronik and Cardionovum; and has ... can also listen to this issue's audio summary by JACC Editor-in-Chief Dr. Valentin Fuster.
JOURNAL OF THE AMERICAN COLLEGE OF CARDIOLOGY
VOL. 64, NO. 7, 2014
ª 2014 BY THE AMERICAN COLLEGE OF CARDIOLOGY FOUNDATION PUBLISHED BY ELSEVIER INC.
ISSN 0735-1097/$36.00 http://dx.doi.org/10.1016/j.jacc.2014.03.059
ORIGINAL INVESTIGATIONS
Anatomic Assessment of Sympathetic Peri-Arterial Renal Nerves in Man Kenichi Sakakura, MD,* Elena Ladich, MD,* Qi Cheng, MD,* Fumiyuki Otsuka, MD,* Kazuyuki Yahagi, MD,* David R. Fowler, MD,y Frank D. Kolodgie, PHD,* Renu Virmani, MD,* Michael Joner, MD*
ABSTRACT BACKGROUND Although renal sympathetic denervation therapy has shown promising results in patients with resistant hypertension, the human anatomy of peri-arterial renal nerves is poorly understood. OBJECTIVES The aim of our study was to investigate the anatomic distribution of peri-arterial sympathetic nerves around human renal arteries. METHODS Bilateral renal arteries were collected from human autopsy subjects, and peri-arterial renal nerve anatomy was examined by using morphometric software. The ratio of afferent to efferent nerve fibers was investigated by dual immunofluorescence staining using antibodies targeted for anti–tyrosine hydroxylase and anti–calcitonin gene–related peptide. RESULTS A total of 10,329 nerves were identified from 20 (12 hypertensive and 8 nonhypertensive) patients. The mean individual number of nerves in the proximal and middle segments was similar (39.6 � 16.7 per section and 39.9 � 1 3.9 per section), whereas the distal segment showed fewer nerves (33.6 � 13.1 per section) (p ¼ 0.01). Mean subject-specific nerve distance to arterial lumen was greatest in proximal segments (3.40 � 0.78 mm), followed by middle segments (3.10 � 0.69 mm), and least in distal segments (2.60 � 0.77 mm) (p < 0.001). The mean number of nerves in the ventral region (11.0 � 3.5 per section) was greater compared with the dorsal region (6.2 � 3.0 per section) (p < 0.001). Efferent nerve fibers were predominant (tyrosine hydroxylase/calcitonin gene–related peptide ratio 25.1 � 33.4; p < 0.0001). Nerve anatomy in hypertensive patients was not considerably different compared with nonhypertensive patients. CONCLUSIONS The density of peri-arterial renal sympathetic nerve fibers is lower in distal segments and dorsal locations. There is a clear predominance of efferent nerve fibers, with decreasing prevalence of afferent nerves from proximal to distal peri-arterial and renal parenchyma. Understanding these anatomic patterns is important for refinement of renal denervation procedures. (J Am Coll Cardiol 2014;64:635–43) © 2014 by the American College of Cardiology Foundation.
From the *CVPath Institute, Inc., Gaithersburg, Maryland; and the yOffice of the Chief Medical Examiner, Baltimore, Maryland. This work was supported in part by Medtronic Cardiovascular (Santa Rosa, California), but the manuscript was prepared independently by CVPath Institute, Inc., a private nonprofit research organization. Dr. Sakakura is supported by a research fellowship from the Banyu Life Science Foundation International; and has received speaking honoraria from Abbott Vascular, Boston Scientific, and Medtronic Cardiovascular. Dr. Virmani has received research support from 480 Biomedical, Abbott Vascular, Atrium, Biosensors International, Biotronik, Boston Scientific, Cordis J&J, GlaxoSmithKline, Kona, Medtronic, Microport Medical, OrbusNeich Medical, ReCor, SINO Medical Technology, Terumo Corporation, and W.L. Gore; has speaking engagements with Merck; receives honoraria from 480 Biomedical, Abbott Vascular, Biosensors International, Boston Scientific, CeloNova, Claret Medical, Cordis J&J, Lutonix, Medtronic, Terumo Corporation, and W.L. Gore; and is a consultant for 480 Biomedical, Abbott Vascular, Medtronic, and W.L. Gore. Dr. Joner is a consultant for Biotronik and Cardionovum; and has received speaking honoraria from Abbott Vascular, Biotronik, Cordis J&J, Medtronic, and St. Jude. All other authors have reported that they have no relationships relevant to the contents of this paper to disclose. Listen to this manuscript’s audio summary by JACC Editor-in-Chief Dr. Valentin Fuster. You can also listen to this issue’s audio summary by JACC Editor-in-Chief Dr. Valentin Fuster. Manuscript received December 19, 2013; revised manuscript received March 1, 2014, accepted March 11, 2014.
636
Sakakura et al.
JACC VOL. 64, NO. 7, 2014 AUGUST 19, 2014:635–43
Anatomy of Human Renal Nerves
R
ABBREVIATIONS AND ACRONYMS BP = blood pressure
enal sympathetic denervation is a
were collected from subjects within 24 hours of
promising new therapy for patients
death. After cutting, each section was fixed in para-
with resistant hypertension, which
formaldehyde (4%), followed by microwave fixation.
is defined as failure to achieve control of
CGRP = calcitonin
Digital
images
from
H&E-stained
histological
blood pressure (BP) despite treatment with
sections were acquired at 1.25� magnification. The
optimal doses of $3 antihypertensive medica-
images were divided into 4 quadrants on the basis
tions (1). Catheter-based radiofrequency renal
of the dye labeling and analyzed with image analysis
denervation has demonstrated both safety
software (IP Lab for Mac OS X, Scanalytics, Rockville,
and efficacy for the treatment of resistant
Maryland). Measurements of the distance from the
hypertension, with 93% of patients having a reduction
luminal surface of the renal arteries to each nerve were
in office-based systolic BP of $10 mm Hg at 3 years (2).
performed in each quadrant around the renal artery.
Furthermore, other denervation technologies, such
Details of the methods used for immunohistochem-
gene–related peptide
H&E = hematoxylin and eosin NFP = neurofilament protein TH = tyrosine hydroxylase
as catheter-based ultrasound, externally applied
istry are described in the Online Appendix.
focused ultrasound, or catheter-based microinfusion
STATISTICAL
of neurotoxic drugs, have been developed (3).
variables are expressed as mean � SD. The Shapiro-
Although all renal denervation technologies target
Wilk test was used to statistically assess violations
renal sympathetic nerves around the renal artery, our
of the normal distribution assumption. Each individ-
understanding of human anatomy of peri-arterial
ual distance from lumen to nerve was used in the
renal nerves remains limited.
tables for whole distribution or figures for cumulative
ANALYSIS. Results
for
continuous
percentile of nerves, whereas mean values per renal
SEE PAGE 644
artery were used for statistical comparison. For The aim of the present study was: 1) to examine the
statistical comparison of spatial nerve distribution,
morphological characteristics of nerve fibers with
mean values of nerve counts were derived for prox-
respect to density, size, and distance from renal ar-
imal, middle, and distal regions, as well as for ventral,
tery lumen; 2) to investigate the influence of hyper-
dorsal, superior, and inferior location, and matched
tension on peri-arterial renal nerve distribution; and
comparisons were performed by using paired Student
3) to determine the proportion of efferent and
t tests or repeated measures analysis of variance for
afferent
fibers
along
the
peri-arterial
neuronal
network of renal arteries and within the kidney.
METHODS
normally distributed parameters. For skewed data distribution, a matched comparison using the Wilcoxon signed rank or Friedman test was applied. Comparisons
between
hypertensive
and
non-
hypertensive subjects were performed by using the Bilateral renal arteries with attached abdominal
independent Student t test or Wilcoxon rank sum
aorta and kidneys were collected from 25 autopsy
test. Categorical data were analyzed by using the chi-
subjects. The first 20 cases were used for the inves-
square test or the Fisher exact test. The Spearman
tigation of peri-arterial nerve anatomy, and the other
correlation coefficient was calculated to assess the
5 cases were used to investigate the ratio of efferent
correlation between nerve counts identified by using
and afferent nerve fibers within nerve fascicles. Identification of hypertension was on the basis of patient histories and histological examination of
H&E staining and those identified by using neurofilament protein (NFP) staining. All analyses were performed by using SPSS version
kidney sections (4). In the first 20 cases, renal
19 (IBM SPSS Statistics, IBM Corporation, Armonk,
arteries were perfusion-fixed ex vivo under physio-
New York) and JMP 5 (SAS Institute, Inc., Cary, North
logical pressure (80 to 100 mm Hg) with 10% neutral-
Carolina). All reported p values were determined by
buffered formalin. The use of dyes demarcated the
2-sided analysis, and values 30 kg/m2) (yes/no)
11/9
8/4
3/5
0.36
Age, yrs
Hypertension (yes/no)
0.26
—
12/8
12/0
0/8
History of diabetes mellitus (yes/no/unknown)
2/11/7
1/8/3
1/3/4
History of hyperlipidemia (yes/no/unknown)
3/10/7
2/7/3
1/3/4
0.51
Sudden coronary death/noncoronary death
9/11
7/5
2/6
0.20 0.68
0.43
Mean length of renal artery, cm
3.1 � 0.8
3.1 � 0.9
3.2 � 0.7
Length of right renal artery, cm
3.5 � 0.9
3.3 � 1.0
3.9 � 0.8
0.15
Length of left renal artery, cm
2.8 � 0.8
2.9 � 0.8
2.6 � 0.8
0.43
Renal artery atherosclerosis (yes/no)
12/8
10/2
2/6
0.02
EEL area of right renal artery, mm2
22.9 � 7.2
25.3 � 7.8
19.4 � 4.5
0.07
EEL area of left renal artery, mm2
25.4 � 8.1
27.0 � 9.0
23.0 � 6.5
0.30
IEL area of right renal artery, mm2
15.9 � 5.1
17.6 � 5.3
13.5 � 3.9
0.07
IEL area of left renal artery, mm2
17.9 � 5.9
18.8 � 6.6
16.5 � 4.6
0.41
Lumen area of right renal artery, mm2
13.6 � 4.4
14.0 � 5.0
12.9 � 3.5
0.60
Lumen area of left renal artery, mm2
0.94
15.2 � 5.0
15.3 � 5.7
15.1 � 4.1
Lumen diameter of right renal artery, mm
4.1 � 0.7
4.1 � 0.8
4.0 � 0.5
0.68
Lumen diameter of left renal artery, mm
4.3 � 0.7
4.3 � 0.8
4.3 � 0.6
0.98
Percent stenosis of right renal artery
11.8 � 14.3
18.2 � 15.3
2.3 � 3.8
0.002
Percent stenosis of left renal artery
11.7 � 14.6
15.3 � 16.7
6.3 � 5.1
0.06
Values are mean � SD or n. Continuous variables were analyzed by using the unpaired Student t test or Wilcoxon rank sum test. Categorical data were analyzed by using the chi-square test or the Fisher exact test. BMI ¼ body mass index; EEL ¼ external elastic lumen; IEL ¼ internal elastic lumen.
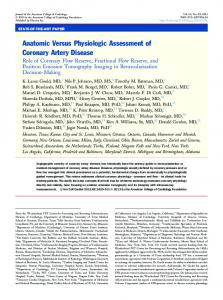
was 4.4 � 0.9 mm, 4.0 � 0.7 mm, and 4.1 � 0.9 mm, respectively (p ¼ 0.004). A total of 10,329 nerves (8,030 nerves were located proximal to the bifurcation [220 sections] and 2,299 nerves distal to the bifurcation [80 sections]) located around the renal arteries were identified from 300 sections. Representative images of perfusion-fixed renal arteries are shown in Fig. 1. The distribution of nerves, stratified by the distance from the arterial lumen to the nerve within the proximal, middle, and distal renal artery sections, is reported in Table 2. There was no significant correlation between the mean number of nerves per section and vessel diameter (Spearman’s r ¼ –0.004, p ¼ 0.95) nor between the mean number of nerves per section and vessel length (Spearman’s r ¼ –0.31, p ¼ 0.06). Table 3 shows the distribution of nerves stratified according to the distance from the arterial lumen relative to their circumferential location. The distribution of nerves distal to the bifurcation of the renal
F I G U R E 1 Representative Images of Perfusion-Fixed Renal Artery and
Peri-Arterial Tissue
artery is shown in Online Table 1. From the first 20 patients (40 renal arteries), 6 kidneys had accessory renal arteries. The mean lumen diameter of the accessory artery was 2.3 � 0.3 mm. The number of nerves and mean distance from the accessory artery
(A) Modified Movat pentachrome stain. (B) Hematoxylin and eosin stain. (C) Methods of nerve distance measurement from the luminal surface of renal artery to each nerve edge. (D) Blue ink represents superior location.
637
638
Sakakura et al.
JACC VOL. 64, NO. 7, 2014 AUGUST 19, 2014:635–43
Anatomy of Human Renal Nerves
T A B L E 2 Distribution of Nerves Stratified According to Total Number and Distance From Lumen in Relative Proximal, Middle, and Distal
Location Whole Distribution (n ¼ 8,030 nerves) Proximal
Middle
Distal
Total
Distance from lumen to nerve, mm 0–