Perception & Psychophysics 1999,61 (2), 291-307
Intra- and cross-dimensional visual search for single-feature targets ASHER COHEN and HAGITMAGEN The Hebrew University, Jerusalem, Israel Cross-dimensional visual search for single-feature targets that differed from the distractors along two dimensions (color and orientation) was compared with intradimensional search for targets that differed from the distractors along a single dimension (either orientation or color). The design of the first three experiments differed from those of previous studies in that participants were required to respond differently to each ofthe targets. Experiments 1-3 were similar except that in Experiment 1, the distractors were homogeneous; in Experiment 2, two types of distractors were used in equal proportions; and in Experiment 3, two types of distractors were used but one of the distractors was a singleton. The findings, contrary to those of previous studies, revealed that cross-dimensional search is at least as efficient and for some targets even more efficient than intradimensional search. These results suggest that the details of stimulus-to-response mapping are essential in comparing intra- and cross-dimensional tasks. Experiment 4 used a priming design and did not support an explanation based on grouping processes. We outline an explanation for all the findings based on a recent cross-dimensional response selection model by Cohen and Shoup (1997).
In the visual search paradigm, participants are required to search for the presence of a target among a variable number of distractors. Previous studies have suggested that intradimensional search for single-feature targets that vary along a single dimension (e.g., all targets are defined by color) is more efficient than cross-dimensional search for single-feature targets (i.e., each target differs from the distractors along a different dimension). Common interpretations of these results have focused on differences in search processes between the tasks (e.g., Muller, Heller, & Ziegler, 1995; Treisman, 1988). The goal of the present study was to demonstrate that these differential results are due to differences in response selection processes between intra- and cross-dimensional tasks. We further suggest that these findings have implications for the roles of spatial attention mechanisms and response selection processes in visual search. Researchers using the visual search paradigm have been particularly interested in the relation between participants' reaction time (RT) and the number of distractors present in the visual field (the array-size slope). For example, the array-size slope is shallow and often even flat for targets defined by a single feature such as color or orientation (see, e.g., Egeth, Jonides, & Wall, 1972; Enns & Rensink, 1990; Ivry & Cohen, 1990; Treisman & Gelade, 1980). Single-feature targets are said to pop out from their distractors. In contrast, targets defined by a conjunction offeatures,
This study was supported by a grant from the Israel Science Foundation to A.C. We thank Arthur Kramer, Herman Muller, and two anonymous reviewers for helpful comments on an earlier version of this article. Correspondence should be addressed to A. Cohen, Department of Psychology, the Hebrew University, Jerusalem 91905, Israel (e-mail:
[email protected]).
291
at least under some circumstances, do not pop out (see, e.g., Cohen, 1993; Cohen & Ivry, 1991; Egeth, Virzi, & Garbart, 1984; Treisman & Gelade, 1980; Wolfe, 1994). These findings have led Treisman and her colleagues (e.g., Treisman, 1988; Treisman & Gelade, 1980) to suggest that visual features are processed preattentively within dimensional modules such as color, orientation, and the like, Importantly, even the original claims of preattentive processing focused on the perceptual aspects of feature processing. There is strong evidence from a variety ofparadigms that attentional mechanisms are involved even in single-feature tasks (e.g., Cohen, Ivry, Rafal, & Kohn, 1995; Duncan, 1980; Posner, Snyder, & Davidson, 1980; Prinzmetal, Presti, & Posner, 1986; Shiffrin & Schneider, 1977; Theeuwes, 1992; Tsal & Lavie, 1993). In fact, several theories specifically suggest that it is mandatory to focus spatial attention at the target's location prior to the execution ofresponses to any visual stimuli (e.g., Cohen & Shoup, 1997; Theeuwes, 1992).1 From this perspective, participants in visual search tasks need to focus their attention on the stimulus target's location for a successful response. Flat array-size slopes indicate that the target stimulus is efficient in guiding spatial attention mechanisms to its location. Most visual search studies for single-feature targets have used intradimensional tasks in which all targets differed from the distractors along a single dimension. Two studies, however, compared an intradimensional and a cross-dimensional single-feature search (Muller et al., 1995; Treisman, 1988). The distractors in both studies consisted of short vertical lines. A single target appeared on half of the trials and no target was present on the remaining trials. In the intradimensional task, the target could be one of three other line orientations, In the cross-dimensional task, the target differed from the distractors in orientation, color,
Copyright 1999 Psychonomic Society, Inc.
292
COHEN AND MAGEN
or size. These studies showed that although the array-size slopes were flat in both types ofsearch, the intercept ofthe array-size function was higher for the cross-dimensional search. Both Muller et al. and Treisman concluded that the target's dimension has to be detected for a successful response. Prior knowledge of the relevant dimension, as is the case in the intradimensional task, obviates the need for this part of the processing. According to this dimensional search explanation, detection of the relevant dimension is part ofthe search processes (see Muller et al., 1995, for an extensive discussion of this issue). These conclusions may seem to be at odds with studies reported by Theeuwes (1991,1992). Participants in these studies searched for a target defined by one dimension (color). The appearance of a singleton from an irrelevant dimension (orientation), however, slowed down the detection of the target. These results suggest that stimuli from irrelevant dimensions are processed in parallel with stimuli from a relevant dimension. As pointed out by Muller et al. (1995), however, the presence of a singleton from a different dimension may be unusually salient and could be considered as a special case (see also Bacon & Egeth, 1994). Thus far, the interpretation of the difference between intra- and cross-dimensional visual search results has focused, as is typical for visual search studies, on search processes (Found & Muller, 1996; Muller et aI., 1995; Treisman, 1988). A recent study by Cohen and Shoup (1997), however,suggests that intra- and cross-dimensional tasks may also involve different response selection processes.Wefirst brieflyreview the studyby Cohen and Shoup. Cohen and Shoup (1997) used a variant ofa task known as the flanker task. In a typical flanker task (e.g., Eriksen & Eriksen, 1979), subjects are required to respond to a target appearing in a known location, often in the center of the screen. Two stimuli (e.g., the letters F and S) are assigned to one response, while two other stimuli (e.g., X and C) are assigned to a second response. The target is flanked by two stimuli on its sides. Although the identity of the flankers is irrelevant to the task, participants are typically unable to ignore it (Eriksen & Eriksen, 1979; Miller, 1991; Yantis & Johnston, 1990). They respond faster in the "congruent" condition, in which the flankers belong to the same response set as the target (e.g., F flankedby Ss), than in the "incongruent" condition, in which the flankers belong to the other response set (e.g., F flanked by Xs). This response latency difference between the congruent and incongruent conditions is known as the congruency effect. Moreover, most existing theories assume that the congruency effect is due to response selection processes involved in stimulus-to-response mapping (see Cohen & Shoup, 1997, for a review). Cohen and Shoup (1997) used a variant of this task in which the response to one of the stimuli from each of two response sets was determined by its color, while the response to the other stimulus from each response set was determined by its orientation. In this design, the response to the target could be based on either color or orientation, but not both. Likewise, the flanking stimuli could be as-
sociated with a response on the basis ofeither color or orientation. When the target and flankers were associated with responses on the basis of the same dimension (e.g., a color target flanked by distractors that would also require responses on the basis of color), a typical congruency effect was observed. However, when the target and flankers were associated with responses on the basis of different dimensions, no congruency effect was obtained. Additional experiments have indicated that this lack of interference is specifically due to the manipulation of visual dimensions and not to more general categorical effects. Cohen and Shoup (1997) have proposed a crossdimensional response selection model to account for these results. Like other models (e.g., Treisman, 1988; Wolfe, 1994), it assumes that there exist visual dimensional modules (e.g., color, orientation) with separate perceptual processes. Unlike most previous theories, however, the model assumes that these dimensional modules have also separate response selection processes (see also Mordkoff & Yantis, 1993). The suggestion that dimensional modules have separate response selection mechanisms may also have implications for the difference between intra- and cross-dimensional visual search studies. According to the model suggested by Cohen and Shoup (1997), an intradimensional task requires the use of a single response selection mechanism. By contrast, cross-dimensional tasks require the use of multiple response selection mechanisms. For example, the cross-dimensional task used by Muller et al. (1995) involved three possible dimensional modules, and by implication three possible response selection mechanisms. This difference may have caused the differential results obtained by Muller et al. and by Treisman (1988). Thus, it is possible to distinguish between two classes of explanations that can account for the difference between intra- and cross-dimensional search tasks. One class, proposed by Muller et al. (1995; see also Found & Muller, 1996), assumes that this difference is due to search processes. Another class suggests that the difference is due to response selection processes. The first three experiments reported in the present study were designed to distinguish between these two classes of explanations. These experiments compared intra- and cross-dimensional visual search tasks but used a different stimulus-to-response mapping than that used in the previous studies. If search processes cause the difference between the tasks, the particular stimulus-to-response mapping is not relevant to this difference and thus should not affect it. Such a manipulation could be an important factor, however, ifthe difference between the tasks is due to response selection processes. To anticipate, the results of Experiments 1-3 indicate that the manipulation of the stimulus-to-response mapping has a strong effect on the results. The particular mapping used in the present experiments erased the advantage found in previous studies for the intradimensional task. In fact, the performance in the cross-dimensional task was somewhat better in Experiments 1-3. Consideration of our results as well as those of Muller et al. (1995) suggest
INTRA- AND CROSS-DIMENSIONAL SEARCH
that the difference between the tasks is due to differences in response selection processes. In Experiment 4, we compared two different hypotheses, both based on differences in response selection processes between intra- and crossdimensional tasks, that may account for the results. Wediscuss this experiment following the presentation of the results for Experiments 1-3.
EXPERIMENTS 1-3 The main manipulation used in the first three experiments was similar. Two targets were used and each was assigned a different response. Participants made one response to one of the targets, a second response to the other target, and a third response when no target was present.' In the cross-dimensional task, one of the targets differed from the distractors in color, and the other target differed from the distractors in orientation. Two intradimensional tasks, in which the targets differed from the distractors along a single dimension, were used as well. In the orientation task, the targets varied along the orientation dimension, and in the color task, the targets varied along the color dimension. A different group of participants was tested in each task. According to the search-based explanations, the new manipulation should not change the pattern of results obtained in the previous studies (Muller et aI., 1995; Treisman, 1988). The RTs for the cross-dimensional task should be slower because participants do not know which dimension is relevant on any given trial, and search for the relevant dimension should slow them down. If, however, the difference obtained in previous studies between the intraand cross-dimensional search was due to response selection processes, the different stimulus-to-response mapping used in the present experiment may lead to different results.
EXPERIMENT 1 Method Participants. Seventy-five participants from the Hebrew University were tested in two separate sessions either as part of their course requirements or for a payment of approximately $5 per session. They were divided into three groups of 25 participants each. Each group performed a separate task. Apparatus. The stimuli were presented on an NEC MultiSynch 4E color monitor controlled by an Intel 486 microcomputer. Participants were tested in a dimly lit room and viewed the display from a distance of 100 em with the aid of a chinrest. Participants responded by using their dominant hand to press one of three microswitch keys mounted on a response board interfaced with the computer. Stimuli and Design. The specific design is similar to those used previously in our lab (e.g., Cohen, 1993). Each display in this experiment consisted of array sizes of 4, 8, 16, or 24 items. The different array sizes consisted of equal numbers oftrials and were mixed within a block. The stimuli on each trial were positioned on two imaginary circles. The radii of the inner and outer circles extended approximately 50and 7.50 of visual angle from the center. For array sizes of 4 and 8 items, all of the stimuli were located on either the inner or the outer circle, randomly selected. For array sizes of 16and
293
24 items, half of the items were located on each circle. The minimal distance between adjacent items was approximately 1.10 of visual angle. All the stimuli used in the experiment were colored lines subtending approximately .520 of visual angle in length with a luminance of approximately 30 cd/m? against a dark background (0 cd/m-), In all three tasks, there were two targets, each appearing on one third ofthe trials for each of the four array sizes. No target was present on the remaining trials. In the target-present trials, the target replaced one of the distractors. Participants pressed the left key for one of the targets, the middle key for the other target, and the right key when no target was present. The distractors for all the tasks were green vertical lines. The two targets in the orientation task were green diagonal lines tilted approximately 45 0 either clockwise or counterclockwise from the vertical meridian (requiring left and middle key responses, respectively). The two targets in the color task were blue (left key) and red (middle key) vertical lines. The two targets in the crossdimensional task were a green line tilted approximately 45 0 clockwise (left key) and a red vertical line (middle key). Note that the targets requiring the left key responses in the cross-dimensional and orientation tasks were identical. Similarly, the targets requiring middle key responses in the cross-dimensional and color tasks were identical. These manipulations created a 3 (between subjects: type of task) X 3 (within subjects: type of response) X 4 (within subjects: array size) mixed factorial design. Each participant in each session first received a short practice block of 36 trials followed by 6 experimental blocks of 180 trials each (consisting of 15 trials for each ofthe 12 conditions). Of particular interest for the present study are two comparisons. First, we will compare the response to the diagonal green target tilted clockwise from the vertical meridian (hereafter, right diagonal line ) in the orientation task with the response to the same target in the cross-dimensional task. Second we will compare the response to the red vertical targets in the color task and the cross-dimensional task. The search-based explanations predict that mean RTs for at least one of the two cross-dimensional targets should be slower than those for the intradimensional task. Procedure. At the beginning of each trial, an achromatic asterisk, serving as a fixation point, was presented in the center of the visual screen. After 500 msec, the asterisk was replaced by the stimulus display. The display remained visible until the participant pressed one of the three response keys. Participants were instructed to respond as fast as they could while minimizing mistakes. The screen turned blank immediately following the participant's correct response until the appearance of the asterisk for the next trial. The message ERROR was presented on the screen for 500 msec following incorrect responses. In either case, the intertrial interval was 1,000 msec.
Results and Discussion The first session in this experiment, as well as those in all subsequent experiments reported in this paper, was considered practice and will not be described here. The results of the first session, although more variable, were qualitatively similar to those of the second session. The proportion of errors made by the participants in the three tasks is shown in Table I. As can be seen in the table, participants made few errors. Although there was a tendency in all tasks to make fewer errors when no target was present, no significant statistical differences were found. This indicates that the RT findings cannot be attributed to a speed-accuracy tradeoff. We therefore focus on the RT results. Table 2 shows the results of the intercept, slope, and squared multiple correlation of the array-size functions as
294
COHEN AND MAGEN
Task
Table I Proportion of Errors: Experiment I Array size Target I Target 2
Orientation
4 8 16 24 Color
4 8 16 24 Cross-dimensional
4 8 16 24
No Target
(right diagonal) (left diagonal) .016 .020 .017 .018 .018 .016 .018 .018 (blue) (red) .019 .015 .017 .015 .022 .018 .023 .016 (right diagonal) (red) .017 .024 .018 .016 .021 .016 .021 .016
.013 .013 .009 .008 .009 .011 .012 .011 .014 .013 .012 .011
Note-The specific targets for each task appear in parentheses. Orientation targets are green, color targets are vertical. The distractors are vertical green lines.
Table 2 Intercepts, Slopes, and Squared Multiple Correlations of the Array-Size Functions for the Three Tasks: Experiment I Task Target Intercept Slope R2 Orientation Right diagonal Left diagonal No target
560 550 550
0.8 1.0 0.4
.61 .59 .32
Blue Red No target
596 558 582
l.l
.89
0.0 -1.3
.91
Right diagonal Red No target
558 515 573
0.0 0.6 -0.6
.98 .50
Color
Cross-dimensional
Note--Grientation targets are green, color targets are vertical. The distractors are vertical green lines.
revealed by a regression analysis for all tasks. It is apparent that the array-size slopes were flat in all three tasks for all three targets. The flat slopes and the relatively low squared multiple correlations are typical results for singlefeature targets. The flat functions obtained for the no-target trials, although not consistently found in other studies (e.g., Cohen & Ivry, 1991), are typically found when the distractors are homogeneous (e.g., Egeth et aI., 1972). The results ofthe three tasks differed in several respects. The response latencies for the two targets in the orientation task were similar. By contrast, in each ofthe other two tasks, the mean RT for one of the targets was shorter than that for the other target. It is well established that two of the factors that determine visual search efficiency are the target-distractor similarity and the distractor-distractor similarity (see, e.g., Duncan & Humphreys, 1989). The same homogeneous distractors were used in all ofthe tasks. Presumably, therefore, the difference between the two targets in the color task, as well as the difference between the two targets in the cross-dimensional task, reflects the de-
gree of similarities between the various targets and the distractors. The main interest ofthe present experiment is the comparison ofmean RTs for the identical orientation targets of the orientation and cross-dimensional tasks, and the comparison of the mean RTs for the identical color targets of the color and cross-dimensional tasks. These RTs are presented in Figure 1. The top and bottom panels display the orientation and color targets, respectively. As can be seen in the figure, the RTs for the targets in the cross-dimensional task were faster in both comparisons. A 2 (task) X 4 (array size) analysis ofvariance (ANaYA) was performed separately for the orientation and the color targets. For the orientation targets, the only significant effect was that of array size [F(3,144) = 5.6,p .12]. These results appear to contradict the prediction ofthe search-based class of explanations, which predicted that the RTs for the cross-dimensional task would be slower. If anything, the obtained results are in the opposite direction, although the differences between the targets were not statistically significant. The major difference between the present experiment and previous studies (Muller et aI., 1995; Treisman, 1988) is in the mapping of the targets to responses. Alternatively, however, it is possible that the stimuli or apparatus used in Experiment 1 are different in some unknown way from those used by Muller et al. (1995) as well as from those used by Treisman (1988). To examine this possibility, we conducted an experiment that used the same procedure as Muller et al. (1995) used, but with our stimuli and apparatus. Twelve participants took part in this experiment. The design was the same as in Experiment 1 except for the following. All participants performed two visual search tasks, an orientation task and a cross-dimensional task. Half ofthe participants started with the orientation task and the remaining half started with the cross-dimensional task. Each task included a practice block of 80 trials followed by three experimental blocks of 160 trials each. In both tasks, participants made one response when either one of two targets was present, and a second response when no target was present. The distractors in both tasks, as in Experiment 1, were green vertical lines. The two targets in the orientation task were right diagonal and left diagonal green lines. The two targets in the cross-dimensional task were a right diagonal line and a blue vertical line. As in Experiment 1, the main interest was the comparison of the mean RTs for the right diagonal targets of the two tasks. Unlike in Ex-
INTRA- AND CROSS-DIMENSIONAL SEARCH
295
700 650 600
.-------e
~. __.__ ._---~---_. __.. _-~._--------- .19]. The results of Experiment 1 and 2 appear strikingly similar. To verify this impression and to increase the statistical power, the data from the two experiments were entered into a 2 (experiment) X 2 (task) X 4 (array size) ANOVA. As before, separate analyses were done for the orientation and for the color targets. For the orientation targets there was a significant main effect of array size [F(3,288) = 16.3, P < .01]. This finding is similar to that found in the separate analyses for Experiments 1 and 2. The array size X experiment interaction was significant as well [F(3,288) = 2.99, p < .05]. This interaction stems from the fact that the array size effect in Experiment 1 was caused primarily by the longer RTs for the large array size, whereas in Experiment 2, it was caused by a more monotonic increase in RT as a function of array size. Note again that the effects of array size, while consistent, are quite small. None ofthe other effects or interactions approached significance for the orientation target. The analysis for the color targets revealed a significant main effect of task
INTRA- AND CROSS-DIMENSIONAL SEARCH
297
700 650 600
•()-__--------- :e: -----------{Jr• ----------~
550 500
---0--' cross-dim. task
•
450 400
orien. task
+--~--"----r----'---r-----r--r---.
4
8
16
24
•
•
array size 700
650 600
550
•
•
()------------~-----------~-----------{)
500
---0--'
450 400
•
cross~im.task
color task
+----r--..----r----.---r-----r--r--..... 4
16
8
24
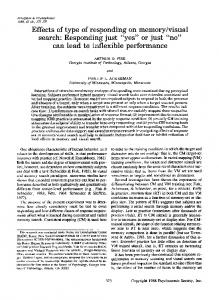
array size Figure 2. Mean reaction times (RTs) for the targets in the intra- and cross-dimensional tasks in Experiment 2. The upper panel depicts the orientation targets and the lower panel depicts the color targets.
[F(l,96) = 4.13, P < .05]. In contrast to the search-based explanations, this finding implies that the response for the color target in the cross-dimensional task was faster than that in the color task. None of the other effects or interactions approached significance. This analysis confirms that the results obtained in Experiments I and 2 are similar. Thus the addition of a second type of distractor in Experiment 2 does not seem to have changed the search processes used by the participants. This observation suggests that participants in Experiment I did not use a search for a difference as their strategy,because this was impossible in Experiment 2. More importantly, the combined findings from Experiments I
and 2 are not in accord with the prediction of the explanations based on dimensional search processes that search should be faster in intradimensional tasks. In fact, search for the color target was faster in the cross-dimensional task. The difference between the orientation target of the two tasks was small and did not approach significance, but again, if anything, it was in the opposite direction to that predicted by the search-based explanations. There may, however, be another alternative explanation that is consistent with explanations based on dimensional search processes. The targets in Experiments I and 2 were always singletons. That is, only one token ofthe target could appear on a given trial. By contrast, there were always (with
298
COHEN AND MAGEN
the exception of the small array size in Experiment 2) multiple tokens of each distractor. As mentioned earlier it has been suggested that a search for singletons in sornesituations might be unique and might be accomplished across dimensions (e.g., Bacon & Egeth, 1994; Muller et aI., 1995). It is possible that participants in both Experiments 1 and 2 adopted a strategy in which they searched for a singleton. This possibility could account for the results of Experiments I and 2 with the added assumption that search for singletons can be done simultaneously in all relevant dimensions. Experiment 3 was designed to make the singleton strategy less efficient and to examine whether this change would affect the search.
EXPERIMENT 3 This experiment was similar to Experiment 2 with two notable differences. The most important difference involves the proportion of the two types of distractors. In Experiment 3, all but one of the distractors were identical. The remaining singleton distractor was different from the other distractors in both color and orientation. In addition, we used three versions of the cross-dimensional task and two versions of both the orientation and the color tasks to make sure that the results were not caused by a less salient singleton distractor. As a result of these manipulations, there was a singleton feature on every trial of every task. Search for a singleton is less efficient in this design because there is a distractor singleton on every trial. As a result, participants using this strategy may shift their attention on half of the trials to the distractor rather than to the target singleton, and would need in these trials to initiate a new singleton search.
Method Participants. Seventy-two participants from the Hebrew University were tested in two separate sessions either as part of their course requirements or for payment ofapproximately $5 per session. Three groups of8 participants were tested in three different versions of the cross-dimensional task. Two groups of 12 participants each were tested in two versions of the color task, and two other groups of 12 participants each were tested in two versions of the orientation task. Apparatus. The apparatus was the same as in Experiments I and 2. Stimuli and Design. The stimuli were identical to those of Experiment 2. The various versions for each of the three tasks are
shown in Table 5. It can be seen from the table that in all three versions of the cross-dimensional task, the targets requiring the left key and middle key responses differed from the distractors in orientation and color, respectively. Moreover, the targets requiring left key responses were identical in the orientation and cross-dimensional tasks. while the targets requiring middle key responses were identical in the color and cross-dimensional tasks. The singleton distractor appeared on all the trials of all the tasks. When a target was presented, it replaced one of the nonsingleton distractors. In all other respects, the design was the same as that of Experiment 2. Procedure. The procedure was the same as in Experiment 2.
Results and Discussion Again, we present only the results of the second session. The different versions in each ofthe three tasks were similar, so we combined the results for each of the tasks. The proportion of errors in the three tasks is shown in Table 6. As in the previous experiments, this proportion was low, and no statistical differences were found among the various conditions. Table 7 shows the results of the regression analyses for the three tasks. The array-size slopes were flat in all tasks for all the targets. Note that the RTs were slower than those found in Experiments I and 2. This may be due to the use of a singleton distractor in the present experiment. However, the difference between the experiments is not large and may reflect individual differences. As before, the most interesting comparisons were the one between the orientation targets in the cross-dimensional and orientation tasks, and the one between the color targets in the cross-dimensional and color tasks. The mean RTs for the orientation and color targets are presented in the top and bottom panels of Figure 3, respectively. As in Experiments I and 2, the search in the cross-dimensional task was faster than in the intradimensional task. Again, 2 (task) X 4 (array size) ANOVAs were done for the two comparisons. For the orientation targets, a significant effectofarray size was found [F(3,I38) = 2.9,p .19]. This pattern of results is very similar to that of the previous experiments, with the minor difference that in the present experiment the array size effect was significant for the color targets as well. As pointed out earlier, however, this effect reflects a minimal difference between the different array sizes and can be ignored for the present purposes. Comparison ofthe results ofthis experiment with those yielded by Experiment 2 of Muller et al. (1995) is instructive. In that experiment, Muller et al. eliminated the oneto-one mapping between the presence of singletons and the required response in a different way. In their more typical experiment (as well as in Treisman, 1988), participants made one response if one ofthree possible targets was present among homogeneous distractors, and a different (negative) response when the visual array consisted ofdistractors only. In their Experiment 2, participants still made one response for two of these three targets, but they were required to make a second response to either a homogeneous field of distractors (as in the other experiments) or to the third target. Thus, the presence of a singleton no longer signaled a unique response because one such singleton (the third target) was mapped to the same response
299
as was the homogeneous field ofdistractors. As in the previous experiments, both intra- and cross-dimensional tasks were tested. Muller et al. (1995, Experiment 2) found that RTs were still slower (albeit less so than in the other experiments) for the cross- than for the intradimensional task. In contrast, we found that, if anything, RTs were faster for the cross-dimensional task. Wesuggest that the different results are due to the different stimulus-to-response mapping used in the two studies. Indeed, the difference in stimulus-to-response mapping appears to be the most consistent difference between Experiments 1-3 of the present study and those of Muller et al. and Treisman (1988). We therefore conclude that response selection processes rather than search processes provide a better account for the different results. Interestingly,the singleton manipulation in Muller et al.s Experiment 2 (1995) was more pronounced for the intrathan for the cross-dimensional task. RTs for both intra- and cross-dimensional tasks were slower in this experiment than in the more typical experiments, in which responses could be based on singletons. This increase in RTs was considerably larger for the intradimensional task. As suggested by Muller et al., Experiment 2 seemed to pose a particular difficulty for the intradimensional task because participants had to detect which of two possible features within the relevant dimension was present in order to respond correctly. This requirement was not present in the previous intradimensional tasks (where all targets were mapped to the same response) or for the cross-dimensional task (where only one feature within each dimension was relevant for the response). We believe that this observation is important. Indeed, in the General Discussion we expand on this point and claim that a somewhat similar explanation can account for the results of the present study. Note, however, that the necessity to identify the features in the intradimensional task was also present in Experiment 3 ofour study. Thus, the different results obtained in Experiment 3 ofour study and in Experiment 2 ofMuller et al. cannot be explained by this aspect ofthe intradimensional task.
EXPERIMENT 4 The results of Experiments 1-3 demonstrate that search for cross-dimensional targets can be at least as efficient and in some conditions even more efficient than intradimensional search. Previous studies, by contrast, showed that intradimensional search can be faster than crossdimensional search (Muller et al., 1995; Treisman, 1988). We have argued that the difference in results is due to differences in response selection processes. Indeed, as discussed in the introduction, the present results converge with those of Cohen and Shoup (1997) and suggest that there exist separate response selection mechanisms for different visual dimensions. This explanation, however, is quite general. It does not specify why RTs for the intradimensional task were faster in the previous studies, and why the reverse was found in the present study. The main
300
COHEN AND MAGEN
700
650 600
• • '"'------------""-~
~
•
•
----------iJr----- -------0
550 500
---0--' cross-dim. task
•
450
orien. task
4004----r--.,.......--r-----,,....---.,-----.---.,---. 4
16
8
24
array size 700 650 600
.
• •-----..------... .J""\...------------o o------------iJr-----------~
550
500
---0--' cross-dim. task
•
450
color task
4004----r--...----r--...----r--...--....,.--... 24 16 8 4
array size Figure 3. Mean reaction times (RTs) for the targets in the intra- and cross-dimensional tasks in Experiment 3. The upper panel depicts the orientation targets and the lower panel depicts the color targets.
goal of Experiment 4 was to take a step in this direction. Specifically, Experiment 4 examined the possible reason for the superiority of the intradimensional task in the design used by Muller et al. and by Treisman. We defer the explanation for the superiority of the cross-dimensional task in Experiments 1-3 to the General Discussion. We propose two hypotheses, one that is based on grouping processes and one that is based on priming. Because we assume that the findings are best explained by the operation of response selection processes, we present these two hypotheses within the framework of the crossdimensional response selection model suggested by Cohen and Shoup (1997).
The Priming Hypothesis One obvious difference between the intra- and crossdimensional tasks is that participants know in advance what is the relevant dimension in the former but not in the latter. Assuming that there exist separate response selection processes for different dimensions (Cohen & Shoup, 1997), participants in the intradimensional task may simply focus on or prime the relevant response selection mechanism. Presumably this priming saves some processing time. This explanation is quite similar to that proposed by Muller et al. (1995) except that the priming discussed here is that of response selection rather than search processes.
INTRA- AND CROSS-DIMENSIONAL SEARCH
The Grouping Hypothesis The stimulus-to-response mapping used by Muller et al. (1995) and by Treisman (1988) involved assigning three targets to a single response. This task would become easier if participants could somehow group the targets because this would effectively decrease the number of targets. The main suggestion of the grouping hypothesis is that grouping multiple targets is more efficient when the targets are defined along a single dimension. Note that the grouping processes assumed here are not perceptual, but are based on task demands. Such grouping may be more effective within a dimension because it involves a single response selection mechanism (see Cohen & Shoup, 1997), whereas grouping in cross-dimensional tasks involves multiple response selection mechanisms. An extreme version of this grouping hypothesis may clarify the claim. Imagine that people are perfect in grouping targets within a single dimension and are unable to group targets from different dimensions. In this scenario, participants have effectively to detect one target in the intradimensional task (because they grouped the three targets into a single representation by the grouping process), but are required to detect three targets in the cross-dimensional task. As numerous studies have demonstrated, an increase in the number of targets leads to an increase in latencies (e.g., Hick, 1952; Hyman, 1953). The two hypotheses are different in several respects. First, the priming hypothesis assumes that the priming will be in effect in all comparisons of intra- and crossdimensional tasks, including designs such as that used in Experiments 1-3 of the present study. By contrast, the grouping hypothesis predicts that the advantage for the intradimensional task will be observed only when multiple targets are mapped to the same response, as in the design of Muller et al. (1995) and Treisman (1988). The grouping hypothesis has an additional prediction with the latter design. Because it assumes that multiple intradimensional targets are grouped, it predicts that activation of one of these targets should result in at least a partial activation of the other target assigned to the same response. Presumably, the strength of this partial activation depends on the strength of the grouping between the two features. No such activation is predicted by the priming hypothesis. Experiment 4 tested this prediction by examining priming between successive trials (Found & Muller, 1996). Found and Muller (1996) showed that participants responded faster to a target when it had also appeared as a target in the preceding trial. The grouping hypothesis predicts that when two features from the same dimension are assigned to the same response (and thus are presumably grouped), response to a target should also be primed ifthe other target assigned to the same response was presented in the preceding trial. To examine this prediction, we used three different visual search tasks. In all of the tasks, two targets were assigned to one response and two other targets were assigned to a second response. In the color task, the response to all the targets was based on their color. Similarly, in the orien-
301
tation task, the response to the targets was based on their orientation. In the cross-dimensional task, the response to one target from each ofthe two response sets was based on its color, and the response to the other target was based on its orientation. Our main analysis concerned the responses to a target in a given trial as a function ofthe target's identity in the previous trial. We expected RTs to be faster when the same target had appeared in the preceding trial (see Found & Muller, 1996). Our main comparison was between trials in which the other target associated with the same response had appeared in the preceding trial versus trials in which a target associated with the alternative response had appeared in the previous trial. The grouping hypothesis predicts that in the two intradimensional tasks, RTs for the former will be faster than those for the latter. The cross-dimensional task was included as a control condition because the grouping hypothesis predicts less priming (due to grouping) in this task.
Method Participants. Sixty participants from the Hebrew University were tested in two separate sessions either as part of their course requirements or for a payment of approximately $5 per session. They were divided into three groups of 20 participants each that performed the cross-dimensional, orientation, or color task. Within each group, 10 participants were tested in one version and the other 10 were tested in a second version. Six participants from each group (3 for each version) were tested in three additional sessions. Apparatus. The apparatus was the same as in the previous experiments, except that two rather than three response keys were used. Stimuli and Design. We used a visual search paradigm, as in the previous experiments, but with several notable differences. There were four targets in each task; two were assigned to one response, and the other two were assigned to a second response. Each of the targets appeared on one fourth of the trials. The distractors were small achromatic circles with a diameter of approximately 0.2 0 of visual angle. Thus, all but one of the stimuli in each trial of each array size consisted of homogeneous distractors, and the remaining stimulus was one of the four targets used in the task. The targets used in the three tasks are shown in Table 8. To make sure that the results would not be due to the particular stimuli, we used two versions for each task. Three observations are particularly important with respect to this design. First, the nature of the response discrimination in this task is not determined by the difference between the target and distractors, as in our previous experiments. In the present experiment, the targets always differed from the distractors in both color and orientation. Thus, search for locating the targets could be done by either dimension, regardless of the task. The response, however, could be determined only by identification of the target's relevant feature-s-that is, the feature that would discriminate between the responses. Second, as mentioned before, the response requirements differed between the intra- and the cross-dimensional tasks. For the intradimensional tasks, responses to all of the targets were determined by one dimension. either color or orientation. For the cross-dimensional task, however, the situation was more complex. Consider, for example, the first version for this task. A blue vertical line and a green left diagonal line were assigned to the first response, whereas a red vertical line and a green right diagonal line were assigned to the second response. The response for the blue and red vertical lines could be determined solely by their color because the vertical orientation did not differentiate between the two responses (i.e., it was shared by both). Similarly, the response for the green right and left diagonal lines could be determined only by their orientation because the green
302
COHEN AND MAGEN
Table 8 The Targets Used in the Three Tasks in Experiment 4
Task Cross-dimensional
Version Target I Target2 I blue-vertical or green-left red-vertical or green-right 2 blue-vertical or red-left green-vertical or red-right Orientation 1 blue-right or green-left blue-vertical or green-horizontal 2 green-vertical or blue-left green-horizontal or blue-right Color 1 blue-vertical or green-left yellow-vertical or red-left 2 blue-vertical or red-left yellow-vertical or green-left Note-Green-right denotes a green right diagonal line. Green-left denotes a green left diagonal line. Green-vertical denotes a green vertical line. Green-horizontal denotes a green horizontal line. The same principle applies to the other colors.
color was shared by both targets. Thus, two of the targets in this task were associated with the response on the basis of color (hereafter color targets), and the other two targets were associated with the response on the basis of orientation (hereafter orientation targets). Third, there was a systematic similarity relation among the four targets for all three tasks. Each target always differed from the other member of its response set in both color and orientation. Each target also shared its irrelevant feature with one of the targets that belonged to the other response set, and was different in both color and orientation from the other target that belonged to the other response set. For example, the blue vertical target in the first version of the color task differed from the other member of its response set (green left diagonal) in both color and orientation. This target had the same orientation as one of the targets that belonged to the other response set (the yellow vertical target), but was again different from the other target that belonged to the other response set (red left diagonal) in both color and orientation. The same logic applies to the orientation task. The cross-dimensional task also shared this classification. However, as discussed in the previous paragraph, the two targets that shared one feature were also connected with the response on the basis of the same dimension. In the first version of this task, for instance, the blue and red vertical lines shared the orientation feature and were both color targets. All other aspects of the design were similar to the previous experiments. These manipulations created a 3 (between subjects: type of task) x 4 (within subjects: targets) X 4 (within subjects: arraysize) mixed factorial design. Each participant in each session first received a short practice block of 48 trials followed by 6 experimental blocks of 160 trials each. As in the previous experiments, we expected a minimal influence ofthe array size manipulation. Our main interest was in the response to the targets as a function of their relation to the target's identity in the preceding trial. We compared four conditions: (1) same target (ST)-the same target had appeared in the previous trial; (2) same response (SR)-the other member of the same response set had appeared in the previous trial; (3) similar other target (SOT)-a target from the other response set that shared a feature with the target had appeared in the previous trial (note again that for the crossdimensional task, this condition involved another important aspect: the response to the targets in both trials was also determined by the same dimension); (4) different other target (DOT)-a target from
the other response set that was different in both color and orientation had appeared in the previous trial. Procedure. The procedure was the same as in previous experiments.
Results and Discussion The second session. As before, we treated the first session as practice. We first present the results of the second session. The different versions in each of the three tasks were roughly similar, and we combined the results for each of the tasks. The manipulation of the array size, as expected, had a minor effect. The proportion of errors for all the targets in all the tasks ranged between .02 and .03, and no systematic effect was observed. Table 9 shows the results of the regression analyses for the three tasks, collapsed across the four targets. The array-size slopes were flat in all tasks for all the targets. As before, however, a one-way ANOVA showed that the slight increase in RT as a function of array size was significant [F(3,57) = 6.1, 7.8, and 3.5, p < .05, for the color, orientation, and crossdimensional tasks, respectively]. Note from Table 9 that there appears to be an intercept difference among the tasks. We return to this issue shortly. Our main focus in this experiment concerned the priming analysis between successive trials. The mean RTs and proportion oferrors for this analysis are shown in Table 10. The pattern of results for the two intradimensional tasks was very similar. Mean RT was fastest for the ST condition and was quite similar for the other three conditions. Statistical analyses confirmed this observation. The difference between the four conditions was significant in both tasks [F(3,57) = 70 and 30.6 for the color and orientation tasks, respectively,p < .05]. Separate contrasts revealed that mean RT for the ST condition was significantly faster than that for the SR condition [F( 1,19) = 236 and 36.7 for color and orientation tasks, respectively, p