Environmental Pollution 238 (2018) 94e102
Contents lists available at ScienceDirect
Environmental Pollution journal homepage: www.elsevier.com/locate/envpol
Atmospheric concentrations and trends of poly- and perfluoroalkyl substances (PFAS) and volatile methyl siloxanes (VMS) over 7 years of sampling in the Global Atmospheric Passive Sampling (GAPS) network* Cassandra Rauert, Mahiba Shoieb, Jasmin K. Schuster, Anita Eng, Tom Harner* Air Quality Processes Research Section, Environment and Climate Change Canada, 4905 Dufferin St., Toronto, ON, M3H 5T4, Canada
a r t i c l e i n f o
a b s t r a c t
Article history: Received 19 December 2017 Received in revised form 6 March 2018 Accepted 6 March 2018
Poly- and per-fluoroalkyl substances (PFAS) and volatile methyl siloxanes (VMS) were monitored at 21 sites in the Global Atmospheric Passive Sampling (GAPS) Network. Atmospheric concentrations previously reported from 2009 were compared to concentrations measured at these sites in 2013 and 2015, to assess trends over 7 years of monitoring. Concentrations of the fluorotelomer alcohols (FTOHs) and fluorinated sulfonamides and sulfonamidoethanols (FOSAs and FOSEs) were stable at these sites from 2009 to 2015 with no significant difference (p > 0.05) in concentrations. Elevated concentrations of all the neutral PFAS were detected at the urban sites as compared to the polar/background sites. The perfluorosulfonic acids (PFSAs), meanwhile, saw a significant increase (p < 0.001) in concentrations from 2009 to 2015. The perfluorocarboxylic acids (PFCAs) had elevated concentrations in 2015, however, the difference was not statistically significant (p > 0.05). Concentrations of the PFSAs and the PFCAs were similar at all location types, showing the global reach of these persistent compounds. Concentrations of the cyclic VMS (cVMS) were at least an order of magnitude higher than the linear VMS (lVMS) and the PFAS. Octamethylcyclotetrasiloxane (D4), decamethylcyclopentasiloxane (D5) and dodecamethylcyclohexasiloxane (D6) saw a weak significant increase in concentrations from 2009 to 2013 (p < 0.05), however, hexamethylcyclotrisiloxane (D3) had a strong significant decrease in concentrations from 2009 to 2015 (p < 0.01). © 2018 Published by Elsevier Ltd.
Keywords: Poly- and perfluoroalkyl substances Volatile methyl siloxanes GAPS network Atmospheric trends
1. Introduction Two classes of chemicals that have seen increasing attention due to concerns over environmental fate are the poly- and perfluoroalkyl substances (PFAS) and the volatile methyl siloxanes (VMS). The PFAS have been widely used since the 1950s in numerous industrial and commercial applications (Kannan, 2011). These uses include in textile stain repellants and grease-proof paper; in fluoropolymer manufacture; coatings and aqueous filmforming foams (Buck et al., 2011). The perfluoroalkyl acids (PFAAs), in particular the perfluorosulfonic acids (PFSAs) and perfluorocarboxylic acids (PFCAs), are of concern due to their widespread persistence in the environment and humans, and tendency
*
This paper has been recommended for acceptance by Charles Wong. * Corresponding author. E-mail address:
[email protected] (T. Harner).
https://doi.org/10.1016/j.envpol.2018.03.017 0269-7491/© 2018 Published by Elsevier Ltd.
to induce toxic effects (Butt et al., 2010). As such, perfluorooctane sulfonate (PFOS), its salts and precursor compound (perfluorooctane sulfonyl fluoride), were added to the Stockholm Convention on persistent organic pollutants (POPs) in 2009 for restriction of production and use with specific exemptions (UNEP, 2017a). Furthermore, perfluorohexane sulfonate (PFHxS) and perfluorooctanoic acid (PFOA) are currently under review for addition to the Stockholm Convention (UNEP, 2017b). Also of concern are a range of neutral PFAS (n-PFAS) which are also applied in the manufacture of polymers. These include the fluorotelomer alcohols (FTOHs) and fluorinated sulfonamides and sulfonamidoethanols (FOSAs and FOSEs). As well as being regularly detected in the environment, the n-PFAS also degrade in the atmosphere to form the more stable, and toxic, PFAAs (Wang et al., 2017). The VMS have been produced commercially since the 1940s and are classed as high production volume chemicals, with tens of thousands of tons produced per year (Gallego et al., 2017). They are
C. Rauert et al. / Environmental Pollution 238 (2018) 94e102
used industrially as intermediates in the manufacture of silicone polymers and copolymers; as surfactants in pesticides; and as defoamers, lubricants, cleaning products, sealants, waxes and polishes. They are also used in a wide range of personal care products including hair/skin products, deodorants and in pharmaceuticals (Government of Canada, 2012; Wang et al., 2013). As a result of the high production and use of these chemicals, elevated concentrations are detected regularly in the environment (Wang et al., 2013; Shoeib et al., 2016). The cyclic VMS have various direct and indirect toxic effects (Want et al., 2013) and concerns arise over environmental toxicity, including toxicity to aquatic organisms with “a need for continued environmental monitoring” (Government of Canada, 2012). The long range transport properties of both the PFAS and VMS have been shown and they are routinely detected in remote locations such as the Arctic (Butt et al., 2010; Ahrens et al., 2011; Bossi et al., 2016; Wong et al., 2018; Wang et al., 2013; Genualdi et al., 2011; Krogseth et al., 2013a). As such, continued environmental monitoring is required to further assess the environmental fate of these chemicals. The Global Atmospheric Passive Sampling (GAPS) Network has been monitoring the PFAS and VMS since 2009 (Genualdi et al., 2010, 2011). The GAPS Network is an atmospheric monitoring program run by Environment and Climate Change Canada and regularly deploys passive air samplers (PAS) at over 50 global locations (Pozo et al., 2006). The GAPS program provides global atmospheric data on POPs, emerging POPs and other chemicals of concern, to domestic monitoring initiatives in Canada such as the Chemicals Management Plan (CMP), and to international programs including the Global Monitoring Plan (GMP) of the Stockholm Convention on POPs. The data provided by the GAPS program is used to assess the effectiveness of implemented control measures on chemicals of concern and provide new information on levels and trends of chemicals of emerging concern, supporting the development of risk assessments. Sorbent impregnated polyurethane foam PAS (SIP-PAS) have been deployed in the GAPS Network every two years, since 2009, to monitor the PFAS and VMS. The SIP-PAS are deployed at 21 sites, with 20 sites in the United Nations region of “Western Europe and Others Group” (WEOG) and one site in the Central and Eastern Europe (CEE) region. The results from the 2009 deployment have previously been published (Genualdi et al., 2010, 2011) and the aim of this study is to provide further data from consecutive years of sampling, and to investigate trends in atmospheric concentrations of PFAS and VMS from 2009 to 2015. 2. Materials and methods 2.1. SIP-PAS deployment, extraction and analysis SIP-PAS were deployed in double-dome sampling chambers at a sub-set of sites operated under the GAPS Network, with a focus on the WEOG region (Fig. 1). The chamber consisted of two stainless steel domes that allow air to circulate over the SIP-PAS surface, as described further in Pozo et al. (2004). SIP disk sample preparation and deployment followed methods that have been previously described (Shoeib et al., 2016). In 2009, 2015, SIP-PAS were deployed during the second sampling quarter of the year (Q2), i.e. April to July, and in 2013 SIP-PAS were deployed for all 4 sampling quarters (Q1, Q2, Q3 and Q4). At Mount Revelstoke one SIP-PAS was deployed for the entire year (September to September) in both 2013 and 2015 due to difficulties accessing this remote site. The locations covered three different location types: polar (n ¼ 3), background (n ¼ 15) and urban (n ¼ 3). Site details and deployment information are listed in Tables S1 to S4 in the Supporting Information (SI). The SIP-PAS were extracted following previously described methods
95
(Shoeib et al., 2016). Details on target analyte names, acronyms and supplier details are provided in Tables S5 and S6 and include 18 PFAAs, 7 n-PFAS and 7 VMS. Briefly, the extraction method consisted of spiking the SIP-PAS with surrogates: 2 mg of labelled VMS, 25 ng of labelled n-PFAS and 0.5 ng of labelled PFAAs, Table S5 and S6. SIP-PAS were then extracted with accelerated solvent extraction (ASE, ASE 350, Dionex Corporation, Sunnyvale, CA, USA). Each SIPPAS was extracted twice, once with petroleum ether/acetone (85/ 15, v/v, 3 cycles) to extract the more volatile n-PFAS and VMS, then a second time with acetonitrile (3 cycles) to extract the PFAAs. Fraction 1 (containing the VMS and n-PFAS) was volume reduced to 0.5 mL, using rotary evaporation and nitrogen blowdown, using isooctane as a keeper. Fraction 2 (containing the PFAAs) was volume reduced to 0.5 mL using TurboVap (Biotage, Charlotte, NC, USA) and nitrogen blowdown. All fractions were further purified with activated carbon columns containing 100 mg of ENVI-Carb (100e400 mesh, Supelco, St. Louis, MO). Fraction 1 was eluted from the carbon column using 4 mL of dichloromethane/hexane (1/ 4, v/v) before final solvent exchange to isooctane and volume reduction to 0.5 mL. Fraction 2 was eluted using 4 mL of acetonitrile before final solvent exchange to methanol and volume reduction to 0.5 mL. Prior to instrumental analysis, Fraction 1 was spiked with 5 ng of N,N-dimethyl perfluoro-1-octane sulfonamide (N,NMe2FOSA) and 100 ng of d10 fluorene for use as injection standards. Fraction 2 was spiked with 0.5 ng of 13C8 PFOA and 13C8 PFOS for use as injection standards. Injection standards were used to quantify the surrogates and calculate surrogate recoveries. The separation and detection of the VMS and n-PFAS were performed using gas chromatography mass spectrometry (GC-MS) and the PFAAs with ultra performance liquid chromatography tandem mass spectrometry (UPLC-MS/MS), following previously published methods (Shoeib et al., 2016). 2.2. Quality assurance/quality control Air concentrations (pg/m3 or ng/m3) of target analytes were derived from the mass of the chemical collected on the SIP-PAS divided by an effective air sampling volume. This air volume was determined using the GAPS template (Harner, 2017), using the average temperature during the deployment period, octanol-air partition coefficients for each target chemical and site specific sampling rates determined by Genualdi et al. (2010). The sampling rates are based on depuration compounds spiked onto co-located PUF disk samplers (Table S3). We note that due to the much greater sorptive capacity of SIP disks compared to PUF disks, the depuration compound approach for assessing site-specific sampling rates cannot be used for SIP disks. However, because the geometries are identical, sampling rates derived for PUF disks can be applied to co-located SIP disks. For Mount Revelstoke a site specific sampling rate has not been reported and 4 m3/day was used. Site specific sampling rates were used instead of the average rate of 4 m3/day (Ahrens et al., 2013), to improve the accuracy of calculated air concentrations. For future studies, an alternative to the depuration method for determining site specific sampling rates may be to use site specific sampling rates calculated by models that are being developed, such as the model recently reported by Herkert et al. (2017). Field blanks (a second prepared SIP-PAS) were sent to all sites to assess background contamination from shipping, handling, or extraction and analysis of samples. All samples were blank corrected by subtracting the mean mass determined in field blanks (ng) from the mass in the sample. Concentrations (ng/sample) detected in field blanks are listed in Tables S7 to S10. In 2015, unusually high concentrations of the PFCAs were detected in field blanks (Table S8). As every field blank saw elevated concentrations
96
C. Rauert et al. / Environmental Pollution 238 (2018) 94e102
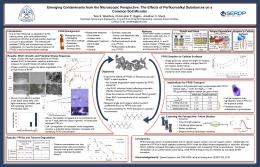
Fig. 1. Concentrations (pg/m3) of PFHxS, PFBS and PFOS at 21 GAPS sites in 2009, 2013 and 2015. All samples were collected in quarter 2 (AprileJune) of their respective sampling years. Note the scale of PFHxS is 10 times lower than PFOS and PFBS.
this is likely an analytical issue in the laboratory and was accounted for with higher method detection limits (MDLs) assigned for the 2015 samples. MDLs were determined as the mean of the concentrations from field blanks plus three times the standard deviation and instrument detection limits (IDLs) were calculated as the concentration (ng) of a peak providing a signal:noise ratio of 3:1. To convert IDLs and MDLs to pg/m3 an average sampling volume (m3) from all samples deployed in that year was applied. All analytes were surrogate recovery corrected and surrogate recoveries (mean ± standard deviation) ranged from 48 ± 18 to 51 ± 15% for the VMS, 43 ± 27 to 108 ± 28% for the PFAAs and 28 ± 11 to 136 ± 33% for the n-PFAS. All statistical analyses were conducted with Microsoft Excel 2010. The 2009 samples were previously analysed for PFAAs using high performance (HP)LC-MS/MS (Genualdi et al., 2010), whereas the 2013 and 2015 samples were analysed with UPLC-MS/MS. To check comparability between the two methods the 2009 extracts were rerun using UPLC-MS/MS, and good agreement was seen with the concentrations reported in Genualdi et al. (2010). Concentrations from both analyses are listed in Tables S11-S12 in the Supporting Information. The improved instrument detection limits of the UPLC-MS/MS method also saw detection of the PFAAs in more samples than previously reported (Table S11). The largest discrepancy was with PFOS, as the linear and branched isomers were not separated with the HPLC-MS/MS method and total PFOS was reported in 2009. With the UPLC-MS/MS method, the isomers were
separated and only the concentration of the linear isomer is reported as analytical standards of the branched isomers were not included in the analysis method. For comparisons of PFAAs between the sampling years, the 2009 concentrations determined from the rerun with UPLC-MS/MS were used. For the n-PFAS, the 2009 concentrations reported by Genualdi et al. (2010) were used for comparisons between sampling years and for the VMS the 2009 results reported by Genualdi et al. (2011) were used for comparisons.
3. Results and discussion Concentrations of PFAS (pg/m3) and VMS (ng/m3) from each deployed SIP-PAS are listed in Tables S13-S20 in the SI. PFBA and PFPeA are reported for the SIP-PAS collected in 2013 and 2015 in Tables S15 and S16, respectively, and 2009 in Table S11, however, as only one ion transition is monitored for both these compounds (i.e. no qualification trace), the analysis has a greater level of uncertainty. The authors also note that the concentrations of PFBA are highly elevated compared to previously reported atmospheric concentrations (Wong et al., 2018). For these reasons the results of PFBA and PFPeA are included, however, they are listed in a qualitative manner and are not used in comparisons and trends analysis further in this study. To overcome this quality assurance issue in the future, it is suggested that complementary methods be used (such as high resolution mass spectrometry) to confirm the
C. Rauert et al. / Environmental Pollution 238 (2018) 94e102
presence of PFBA and PFPeA. 3.1. n-PFAS The majority of the FOSA/FOSEs had low detection frequencies in both 2013 and 2015, except for EtFOSA with detection frequencies of 63 and 47% in 2013 and 2015, respectively. The FTOHs generally had higher detection frequencies with >68% detection of 8:2 FTOH and 10:2 FTOH. Concentrations of the FTOHs, and EtFOSA at each site were generally within a factor of two between the three years, and there were no significant differences in concentrations between the sampling years (paired t-test, p > 0.05). The other FOSA/Es were not assessed due to low detection frequencies in each year (