1999
POINTS OF VIEW
623
Syst. Biol. 48(3):623–633, 1999
Reconstructing Ancestor States with Maximum Likelihood: Support for One- and Two-Rate Models ARNE Ø. MOOERS1,3
AND
DOLPH SCHLUTER2
Department of Biology and Zoological Museum, University of Amsterdam, Amsterdam, The Netherlands; E-mail:
[email protected] Zoology Department and Centre for Biodiversity Research, University of British Columbia, Vancouver V6T 1Z4 Canada; E-mail:
[email protected] 1
2
Many evolutionary theories make predictions about the order and timing of character evolution, and inferring ancestral states is considered a powerful tool for testing these theories (Maddison, 1994; 1995; Yang et al., 1995; Schluter et al., 1997). The most common method of inference is maximum parsimony (MP; see Maddison and Maddison, 1992, and references therein). Although MP may offer reasonable estimates of ancestors for characters chosen to meet the assumptions of the method, or for closely related species, it may perform poorly when much opportunity for change exists (i.e., when the rate of character change is moderate to high or when much time has elapsed: see Maddison, 1994; Collins et al., 1994; Yang et al., 1995; Omland, 1997; Zhang and Nei, 1997). Yet, many traits of interest are expected to change rapidly, and new methods must be devised to accommodate this. Such reconstruction methods now exist for molecular sequences and amino acids (Yang et al., 1995; Koshi and Goldstein, 1996; Felsenstein, pers. comm. [1995]) and for two-state discrete and continuous data (Martins, 1994; Schluter, 1995; Schluter et al., 1997, Pagel,1999), but they have yet to be extensively assessed and utilized (Cunningham, et al., 1998). Most of the new methods are based on simple statistical models and maximum likelihood (ML) estimation techniques. Here, we consider one such method (Schluter, 1995; Schluter et al., 1997), which uses the Markov-transition rate model to infer changes in two-state discrete characters 3 Address correspondence to Arne Ø. Mooers, Department of Biology and Zoological Museum, University of Amsterdam, P. O. Box 94766, Amsterdam 1090GT, The Netherlands.
(Pagel, 1994). Because we are constrained to a single observation per tip (rather than many DNA sites or amino acids per tip), the behavior of these ancestral reconstructions is not expected to be the same as that for genetic data. Crucial to the success of the method is an accurate estimate of the forward and backward rates of change between states. Because most data sets are too small to warrant tting unequal forward and backward rates, Schluter et al. (1997) suggested that accuracy is best achieved by constraining rates to be equal. Using empirical examples, we now ask whether this was a reasonable caution, and whether much can be gained from estimating two rates simultaneously. We rst offer a brief review of the ML method. We then present results from a small survey of published trees on the level of statistical support for one- and two-rate models of trait evolution. We nally introduce a second sort of two-rate model, in which the rate of change differs between ingroup and outgroup.
THE METHOD The approach employs Pagel’s (1994, 1997) Markov-transition rate model for estimating the rate of change of a trait X that occurs in either of two states, 0 and 1. It is a two-step process that rst uses the data (the tree and the states observed at the tips) to estimate rates of change, and then conditions on these estimates to infer the likelihoods of the alternative ancestral states at internal nodes on the tree. Schluter et al. (1997) have presented the general method fully and so our outline here is brief.
624
VOL. 48
SYSTEMATIC BIOLOGY
We take as our model of evolution a random walk in continuous time (Felsenstein, 1993; Frumhoff and Reeve, 1994; Pagel, 1994, 1997; Maddison, 1995; Schluter, 1995; Schluter et al., 1997). This model assumes: (a) that the probability of change of a character depends only on the character state at that time, and not on previous states; (b) that transitions along each branch are independent of transitions elsewhere on the tree; and (c) that rates of change are constant along all branches of the tree. Later in this paper we consider departures from assumption (c), in which rates of change are different in outgroups and ingroups but are in fact constant within these groups. Consider rst the case where we constrain forward and backward rates q to be equal (the one-rate model). The likelihood for a given q is: L(q) =
X
P(X1 , X2 , . . . XN )
(1)
X1 ,X2 , ...XN
Here X1 , X2 . . .XN make up one of the 2N possible set of ancestral values for a tree with N nodes and N + 1 tips. States at the tips are observed as S1 , S2 , . . . SN+1 . P(X1 , X2 , . . . XN ) is the probability associated with this set of nodal and tip values, calculated as the product of the transition probabilities for every branch. Each transition probability refers to the probability of a branch, starting in state Yi (Yi is one of the set X1 , X2 , . . . XN ) and ending in state Yj (Yj is one of X2 , X3 , . . . XN , S1 , S2 , . . . SN+1 , i =¤ j). The transition probability for each branch is a function both of q and of the opportunity for change (branch length); the formulae can be found in Pagel (1994: Equations 1–4). If q or the branch length is very small, then the probability that a branch beginning in one state (e.g., 0) and ending in the other state (e.g., 1) is also small. Conversely, if q is large or the branch length is long, then the probability that a branch begins in one state and ends in the other approaches 0.5. The likelihood associated with any given value of q is the sum of the probabilities P(X1 , X2 , . . . XN ) over all 2N possible sets of ancestral values (Eq. 1). The parameter value ˆq that maximizes Equation 1 is the ML estimate.
The likelihood of the state m i (m = 0 or = 1) for node i is simply its contribution to L(ˆq); that is, ancestral state estimates are conditioned on qˆ . For example, the likelihood for a particular state m for ancestor 1 is X L(m | qˆ ) = P(m , X2 , . . . XN ) (2) m
X2 , X3 ,...XN
The state m with the highest likelihood returned from Equation 2 is the ML estimate. The ratio of the likelihoods of each character state at a given node (larger divided by the smaller) measures the level of support for the ML estimate. The ratio is a measure of the weight of evidence for the ML state. Edwards (1972) advocates a “rule of thumb” measure of increased support of 7.4 [equal to a difference of 2 between the ln(likelihood) of the two states] for comparing nonnested but equally complex models. We consider support in excess of 7.4 a rough minimum for gauging level of certainty. Nodes with likelihood ratios less than 7.4 are deemed too uncertain to rely upon. The likelihoods can also be interpreted in a Bayesian context (e.g., Yang et al., 1995). Given a at prior expectation for internal states, the posterior probability is proportional to the likelihood ratio. Here, support for the ML estimate of 7.4 corresponds to a posterior probability of 88% (i.e., 7.4:1). Pagel (1999) develops this Bayesian perspective further. Figure 1A presents an example of ancestor reconstructions under the one-rate model. The canid trenchant heel (Wayne et al., 1997) is an adaptation of teeth to extreme carnivory found in 3 of 24 (fairly closely related) species. Under the one-rate model, the rate of change has been fairly low (ˆq = 0.08), and no ancestors are reconstructed to express this trait. Reconstructions in the portion of the tree near the three species that exhibit the trait, however, are not unequivocal. The two-rate model (where a separate forward rate, q01 , and backward rate, q10 , are to be estimated) is similar, except now L(q01 , q10 ) is substituted for L(q), and the transition probability per branch is a function of both q01 and q10 . The larger q01 is relative to q10 , the greater is the probability that a branch that begins in state 0 ends in state 1
1999
POINTS OF VIEW
625
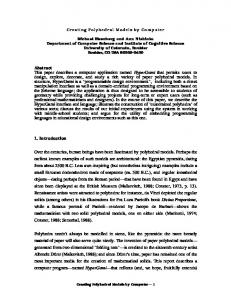
FIGURE 1. The reconstruction of presence/absence of the trenchant heel (cutting edge of carnassial molar) on a molecular phylogeny of the canids (Wayne et al., 1997: Fig. 2b). Three species (Bush dog, African wild dog, and Dhole, represented by black circles) express this trait. (a) Reconstruction of the trait under the one-rate model (ˆq = 0.08). Signicant support for an ancestral state under ML (7.4:1) occurs between 1 and 2 o’clock on the pie. Note that the branch lengths shown do not represent relative opportunity for change; all branches are considered to be of equal length. (b) Reconstruction of the trait under the two-rate model (ˆq01 = 3.20; ˆq10 = 22.42). The relative areas in the pies represent the relative support for the two reconstructions, and all ancestors are equivocal.
(Pagel, 1994). Figure 1B offers an estimate of ancestral states for the trenchant heel if we assume two rates. We return to a comparison
of these two estimates later. Pagel (1999) refers to this ML method (Schluter, 1995; Schluter et al., 1997) as
626
SYSTEMATIC BIOLOGY
“global” because each node is reconstructed by using the same xed estimates of the values of q that have been obtained with use of all the information in the tree. Our likelihoods then condition on the ML estimates for q in the same way that they condition on the phylogeny and on the observed tip values. We advocate this global approach for its simplicity and because it evaluates likelihoods of both states at every node against the same “background” of other parameter settings, facilitating comparison. An alternative (Schluter, 1995; Pagel, 1999) is to recalculate transition rates separately for each possible ancestor state at a node, and to use the t of the data to the respective ML values as a direct measure of support for the corresponding states. Pagel (1999), who refers to this as the “local” method, offers a detailed comparison with the global method. We present a simple recipe for calculating ancestor states under the global method with use of Discrete 1.01b (Pagel, 1997) in the Appendix. ONE RATE OR TWO—IMPROVEMENTS IN FIT The main question to be addressed here is whether to use one rate (q) or two rates (q01 and q10 ). If separate forward and backward rates are to be estimated, the model requires an extra parameter, and consequently more data are needed to maintain accuracy. Model complexity is a major issue in molecular phylogeny reconstruction—we can choose between the simplest one-parameter model (Jukes and Cantor, 1969), to some models that t > 200 parameters to amino acid sequences (e.g., Yang et al., 1999). Fitting this many parameters while at the same time not compromising their accuracy requires vast amounts of data, however. Schluter et al. (1997) argued that sufcient data are rarely available to justify tting two rates and advocated using a single rate when reconstructing ancestor states. Here we explore this claim further. One approach to the question is to ask whether a two-rate model of discrete trait evolution ts the data signicantly better than a one-rate model. These alternative models are nested—the one-rate model
VOL. 48
(equal q values) is a special case of the tworate model (unequal q values). Therefore, a x 2 approximation to the log-likelihood ratio test or Monte Carlo simulations may be useful for choosing among models (Goldman, 1993; Pagel, 1994, 1997). Under the x 2 approximation, a model with n extra parameters (here n = 1) is preferred over the simpler version (at a given signicance level a ) if the improvement in ln(likelihood) is half as large as the critical value for a x 2 distribution having n degrees of freedom. More work is necessary to evaluate the justication of the x 2 approximation in this case, and we use an increase in support of 7.4´ as a conservative value for judging signicant improvement, corresponding to a x 2 approximation with a = 0.045 on n = 1 df. We can now explore the effects of tting one- versus two-rate models for the types of data usually considered by evolutionary biologists. We surveyed phylogenetic trees published in Evolution and Systematic Biology from 1993 through 1998. We conned ourselves to binary characters that showed > 1 transition under MP, which gave us 28 studies to examine. We constrained all branches to be of equal length, as does MP. This destroys one of the prime advantages of ML over MP but is necessary to achieve a common setting (Ree and Donoghue, 1999, consider the effects of modifying branch length in a specic case). For the 28 trees we found, we recorded (a) the number of tips, (b) the number of transitions inferred by using MP, (c) the proportion of the tips in the minority state, (d) the proportion of the internal nodes reconstructed to be in the minority state under MP, and (e) the improvement in t of a two-rate model over a one-rate model (see Table 1). Over all 28 trees, the mean improvement is 1.85 ´ , and the gain in support is signicant for only 2 of the 28 trees. Thus our initial claim holds: Data as presently collected rarely warrant tting a second rate parameter. If we examine the correlations among our measures, we can ask which parameters are likely to affect increased t for the two-rate model. Of the variables measured, tree size and the number of reconstructed
1999
627
POINTS OF VIEW TABLE 1.
Improvement of two-rate over one-rate ML model for discrete trait evolution.
Reference
Basolo, 1996 Benambib et al., 1997 Bond and Opell, 1998 Cognato et al., 1997 Collins et al., 1996 Dobler et al., 1996 Emerson, 1996 Fink and Zelditch, 1995 Hart et al., 1997 Janz and Nylin, 1998 Kohn et al., 1996 Livezey, 1996 Normark, 1996 Omland, 1997 Petren and Case, 1997 Pitnick et al., 1997 Prum, 1994 Rosenberg, 1996 Schluter et al., 1997 Shaw, 1996 Siddall et al., 1993 Sillen-Tullberg, 1993 Spicer and Jaenike, 1996 Stern, 1998 Titus and Larson, 1996 Vogler and Kelly, 1998 Wayne et al., 1997 Wray, 1996
Traita
Nb
n MPc
Tail elongation Viviparity Vertical webs Ipsdienol absent < 5% gastropods in diet Chemical defense No advertisement calls Modied shape Feeding larvae Feeding on herbs Tristyly Coloniality Parthenogenesis Monochromatism Large size No insemination reaction Coordinated displays Marine habitat Substage foraging Living on Maui Nonparasitic lifestyle Cryptic colouration Breeding on plants Horned soldiers Long larval period Benzaldehyde present Trenchant heel Nonfeeding larvae
22 20 65 10 7 20 7 5 12 35 24 26 31 59 16 22 27 11 11 24 9 95 7 33 20 44 24 19
4 4 8 3 2 3 2 2 2 3 3 5 4 9 3 4 5 3 2 3 2 8 2 3 2 7 3 5
P(tips)d
P(tree)e
0.454 0.3 0.492 0.4 0.428 0.45 0.285 0.4 0.25 0.4 0.333 0.384 0.258 0.491 0.437 0.363 0.444 0.454 0.363 0.333 0.222 0.326 0.428 0.303 0.35 0.272 0.125 0.315
0.333 0.157 0.562 0.111 0.5 0.421 0 0 0.090 0.294 0.173 0.2 0.133 0.534 0.4 0.285 0.269 0.6 0.2 0.217 0 0.319 0.166 0.343 0.157 0.209 0 0.055
Improvementf
1.03 1.00 3.63 1.24 1.07 2.98 1.93 1.12 1.70 2.22 1.30 1.00 2.91 1.36 1.00 3.10 1.84 1.03 1.16 1.31 3.63 13.60 1.02 1.38 1.23 2.77 9.78 3.03
a The rst binary character listed in the paper for all the included species that was not used to construct the tree. The minority state is given. In a few cases, multistate characters were rescored to produce simple binary characters. For Sillen-Tullberg (1993) we considered only one well-resolved monophyletic group with 95 species. Outgroups were not included. For three studies, polytomies were resolved arbitrarily so as to minimize the number of state changes inferred by MP. Because every branch supplies information about q, regardless of whether change is observed to occur on it or not, we arbitrarily resolved monophyletic groups (by adding tips) in the one tree where single tips represented such invariant groups (Sillen-Tullberg, 1993). b Number of tips in tree. c Number of transitions inferred under MP. d Proportion of tips in minority state. e Proportion of internal nodes reconstructed unequivocally to be in minority state, under MP. f Improvement in support of the two-rate model over the one-rate model.
changes under MP are highly positively correlated, as are proportion of tips and proportion of internal nodes found in the minority state. In a general linear model, however, tree size explains signicant variation independent of the number of reconstructed changes ( F1, 25 = 6.11, P = 0.02), and the proportion of tips in the minority state explains signicant variation in the improvement of t even after controlling for the proportion of internal nodes in the minority state ( F1, 25 = 8.88, P = 0.006). Each pair of correlated variables also explains different portions of variation in improvement
in t [general linear model of tree size and P(tips in state 1) on improvement in t: for N, F1,25 = 18.73, P = 0.0002 ; for P(tips in state 1), F1,25 = 15.11, P = 0.0007]. Based on this limited empirical dataset, two-rate models are expected to do better for larger trees with many transitions and for trees with the majority of tips (or internal nodes inferred by MP) in state one. The rst result is unsurprising if sample size is a limiting step. If we observe few tips in state one, moreover, this may be because the forward rate (q01 ) has been low relative to the backward rate (q10 ), and two-rate models
628
SYSTEMATIC BIOLOGY
might better describe this. Simulation studies would help illuminate the behavior of these variables, though two-rate models are still likely to be rarely justied. ONE RATE OR TWO—CONFIDENCE IN RECONSTRUCTIONS A second way to address the question of whether to prefer two-rate models is to ask if the reconstructions based on a tworate model are more or less reliable than are one-rate reconstructions. This is difcult to evaluate when the true ancestral states are unknown, but some progress may be made with indirect methods. Consider the case of the canid trenchant heel (Table 1, Fig. 1). Here the two-rate model offers a signicantly better t (Table 1). The ML estimates of forward and backward rates under the two-rate model are extremely high, however, implying that the character changed many times per internode—and this makes all the reconstructions equivocal (Fig. 1B). The reconstructions do not t with intuition. Intuition is a risky criterion, however, since the best science often proves it wrong (see also Pagel, 1999). More objectively, we can ask whether these parameter values are well-enough estimated to be relied upon. In this case, they are not. The likelihood surface for these data under the two-rate model is very at and there is little improvement over a wide possible range of forward and backward rates. For example, forcing q01 and q10 rates to be 10% of their ML rates worsens the t by only 8%. So, although the estimated rates are high, we have very little condence in them. Because the reconstructions are very sensitive to the global transition rates, we believe it is better to estimate one rate well than each of two badly. Another indirect criterion might to ask whether support for individual reconstructions tends to be stronger in general under 2 rates than under 1. Of the 677 internal nodes in our 28 survey trees, 24% of the nodes are equivocal (i.e., supported by < 7.4) under the one-rate model, and 25% are equivocal under the two-rate model (the equivalent number under unweighted MP is only 7% of the nodes, where equivocal simply means
VOL. 48
that both states are equally parsimonious). Again, estimating 2 rates does not seem to increase condence in individual ancestral reconstructions. Let us consider an example from our Table 1 in more detail. Basolo (1990, 1995) used ancestor reconstruction to test the “sensory bias hypothesis” (Ryan and Keddy-Hector, 1992) for the evolution of exaggerated male characters. This theory states that female preferences for exaggerated male traits are by-products of previous natural selection on female sensory systems. The male traits evolve as variation arises and is selected by the female preference. Basolo (1990) suggested, using MP reconstructions on a preliminary tree of swordtails and platysh (genus Xiphophorus), that the female preference for male swords evolved before the sword, consistent with predictions from the theory. In 1995, Basolo reported that in a member of the sister genus Priapella, where males lack swords, females prefer swords, suggesting the preference evolved before the two genera split. Using the molecular phylogeny of Xiphophorus + Priapella from Meyer et al. (1994), Basolo’s (1990, 1991) definition of a sword, and a one-rate model of character change, Schluter et al. (1997) suggested that the data did not offer strong support for a swordless ancestor to these two clades. The data by themselves do not suggest we use a two-rate model (Table 1), but we may still choose to consider such a model, since the sensory bias hypothesis suggests gain of a sword should occur more often than loss of a sword. The tworate model suggests that the rate of loss of swords is very slightly higher than its gain, contrary to prediction (ˆq01 = 0.13, qˆ 10 = 0.18). Figure 2 presents the supports for the two models: With these data, allowing two rates to be tted decreases our condence in the state of the common ancestor even further. In partial response to the analysis of Meyer et al. (1994), Basolo (1996) pointed out that the “sword” is actually a composite character. She identied at least ve traits that might be necessary to constitute a sword. If we assume that the ve traits are independent, we can calculate the relative support for each trait separately in the com-
1999
629
POINTS OF VIEW
*
*
*
*
No Sword Sword
(a)
One Rate
(b)
Two Rates
(c)
Varying Rates
FIGURE 2. Reconstruction of the sword (dened as a colored elongation) in Xiphophorus and Priapella sh based on the molecular phylogeny of Meyer et al. (1994). Experimental evidence from the starred species indicates that females prefer males with swords. The root is reconstructed as equivocal under MP. (A) Under the one-rate model (ˆq = 0.15), relative support for a swordless ancestor is 2.6:1. (B) Under the two-rate model (ˆq01 = 0.13; ˆq10 = 0.18), support for a swordless ancestor drops to 1.7:1. (C) Under the variable-rates model (ˆq = 0.003, k = 60), support for a swordless ancestor is high (148:1).
mon ancestor, and multiply these together to arrive at the overall support for the presence or absence of this ve-traited sword at the basal node. For the topology presented by Meyer et al. (1994), the ML estimate for each of the ve traits is to be absent in the common ancestor, and the relative support for this reconstruction versus the hypothesis that all ve traits are present is high (under the one-rate model, relative support = 579´ ; under the two-rate model, relative support = 916 ´ ). Though little is yet known about what is necessary before a sword is recognized as a sword, this example highlights how different evolutionary assumptions can change our condence in reconstructions. It also highlights how we must be explicit with
our assumptions, or risk being accused of getting the answer we want by simply varying the appropriate parameter. INGROUPS AND OUTGROUPS —TOWARDS A BETTER MODEL Given the above, we advocate that one should begin with a model with equal forward and backward rates, because estimates are likely to be more accurate for moderately sized trees. Another advantage, however, is that this simpler framework allows us to inquire about other departures that we believe might better reect the evolutionary process and lead to more realistic reconstructions. In this section we introduce the issue of a
630
SYSTEMATIC BIOLOGY
variable-rates model, in the context of outgroups. Our approach as implemented above does not use information about outgroups. The tree is rooted by using an outgroup (or some other method), but the outgroup is then removed, and the root node is treated the same as other nodes: As we search for qˆ , we consider it equally likely that the root is in either of the two states (Pagel, 1994). The approach effectively snips the clade in question out from the tree of life and considers it in isolation (this is also true for the methods presented by Yang et al., [1995] and Koshi and Goldstein, [1996] for reconstructing molecular sequences). Root nodes in our survey trees were twice as likely as other nodes to be equivocal (cf. Schluter et al., 1997), and using information from outgroups might be expected to help increase our condence in these reconstructions (see also Pagel, 1999), much as including outgroups often helps increase the ancestral-state designation at ingroup nodes under MP (Maddison et al., 1984; Swofford and Maddison, 1987). Although including outgroup information seems desirable, at least two problems arise. First, because every branch in a tree offers information about rates of change, substituting single lineages for entire clades may produce very biased estimates of rate (this is why we have to add tips to trees where a single taxon is made to represent a larger invariant monophyletic group; see footnote to Table 1). Outgroups are almost always single representatives of larger clades. This problem is not grave, because outgroups could be expanded. More critically, recall that under the Markov-transition model, the rate of change is assumed to be the same in all parts of the tree. Outgroups are different from ingroups by denition, however, and we may have little reason to expect that the rate of change in the two will be the same. Indeed, if we have enough information about outgroups, we can t a different sort of two-rate model, where q varies. We can specify different rates q and q0 for the outgroup and ingroup. If q0 = kq, we can simply specify the branch where the rate changes (e.g., the branch between the ingroup and
VOL. 48
the outgroup node), and then search for ML estimates of both q and k simultaneously and reconstruct ancestors based on these estimates. We applied this simple approach to the Xiphophorus + Priapella phylogeny from Figure 2, rst designating all ve known Priapella species as the outgroup (Basolo, 1996) and assuming that the rate q0 = kq in Xiphophorus is greater than the rate q in Priapella. Using a manual grid search with Discrete 1.01b, we nd qˆ = 0.003, and k = 60. Conditioned on these estimates, the support for swordless (as a single character) at the root of this larger tree is now 148´ , a result in agreement with the sensory bias hypothesis (Fig. 2C). Our analysis, though instructive, is not ideal. The Xiphophorus + Priapella clade is still being considered in isolation from its outgroup (see Pagel, 1999). We also chose arbitrarily the branch along which to search for a new rate of change. An outgroup clade with ve species and no transitions may not offer enough data to warrant tting a second transition rate. We also note that the approach need not be restricted to ingroups and outgroups. For any tree, we can search for the most likely branch where a change in rate has occurred and simultaneously t two rates to the tree. The clumping of instances of the trenchant heel in canids (Fig. 1) is a possible case where there has been an increased rate of change in a particular subclade. CONCLUSION Our survey results do not mean that forward and backward rates for most traits are generally the same, but rather that mediumsized trees (median = 21 tips, range 5–95 from Table 1) will rarely offer enough data to allow us to prefer two-rate models. We will therefore need other reasons to do so. We maintain that the tting of complex models must be evaluated on a case-by-case basis. For those lucky enough to have enough data or well-founded prior expectations, morecomplex models will be more enlightening (see, e.g., Ree and Donoghue, 1999; Yang et al., in press). For the rest of us, although our hard-earned data sets may bend to our particular views of the world, we must not ex-
1999
631
POINTS OF VIEW
pect the data to support these convictions in a statistical sense, given the models now in use. This cursory consideration points to several areas that require study, probably with the aid of computer simulation. If most medium-sized trees give us only mild support for preferring more-complex (though more-realistic) models, what criteria do we use to choose among models? This may be a simple power issue, and our minimum level of increased support (7.4´ ) may be too strict. One way to avoid searching for ML estimates of two rates with few data would be to test explicit alternative hypotheses concerning expected differences in forward and backward rates under a two-rate model (e.g., that forward rates should be twice the backward rates). These hypotheses, however, must be generated with external data. Though it might also be reasonable to consider that rates vary in different parts of a tree, we have yet to implement a method that searches for the ML branch along which transition rates may change. Finally, we expect that tree shape and the distribution of characters among the tips generally will be important parameters affecting the accuracy of ancestor state reconstructions, for both the one-rate and variable-rates models. This implies that different topologies may affect our conclusions (cf. Donoghue and Ackerly, 1996). The same may hold true for inclusion and exclusion of outgroups (Pagel, 1999). This sensitivity to included data is in the spirit of ML, but should be borne in mind by biologists more accustomed to the hypothetico-deductive approach. A detailed look at the dependence of reconstructions on tree topology, character distribution, branch lengths, and tree size might reveal some useful patterns. The complex problem of incorporating fossil evidence as data in these models must also be confronted. ACKNOWLEDGMENTS We are grateful to Kevin Omland and Cliff Cunningham for organizing the symposium where much of this work was presented and for their comments and discussion. Mark Pagel, Sally Otto, and Trevor Price continue to offer insight on maximum-likelihood approaches to
evolution and Don Ludwig and Trevor Price were instrumental in this research. Sally Otto, Ziheng Yang, and Emilia Martins offered helpful comments on an earlier version. We thank the Society for Systematic Biology, NSERC Canada, the Hamilton Foundation, and the Zoological Museum of Amsterdam for nancial support.
REFERENCES BASOLO , A. L. 1990. Female preference predates the evolution of the sword in swordtail sh. Science 250:808–810. BASOLO , A. L. 1991. Male swords and female preferences: Response. Science 253:1426 –1427. BASOLO , A. L. 1995. Phylogenetic evidence for the role of a pre-existing bias in sexual selection. Proc. R. Soc. Lond. B 259:307–311. BASOLO , A. L. 1996. The phylogenetic distribution of a female preference. Syst. Biol. 45:290– 307. BENAMBIB , M., K. M. KJER, AND J. W. SITES JR. 1997. Mitochondrial DNA sequence based phylogeny and the evolution of viviparity in the Sceloporus scalaris group (Reptilia, squamata). Evolution 51:1262–1275. BOND, J. E., AND B. D. OPELL. 1998. Testing adaptive radiation and key innovation hypotheses in spiders. Evolution 52:403–414. COGNATO , A. I., S. J. SEYBOLD , D. L. WOOD, AND S. A. TEALE . 1997. A cladistic analysis of phermone evolution in Ips bark beetles. Evolution 51:313–318. COLLINS , T. M., K. FRAZER, A. R. PALMER , G. J. VERMEIJ , AND W. M. B ROWN . 1996. Evolutionary history of northern hemisphere Nucella (Gastropoda, Muridae): Molecular, morphological, ecological and paleontological evidence. Evolution 50:2287–2304. COLLINS , T. M., P. H. WIMBERGER, AND G. J. P. NAYLOR. 1994. Compositional bias, character–state bias, and character–state reconstruction using parsimony. Syst. Biol. 43:482–496. CUNNINGHAM, C. W., K. E. OMLAND , AND T. H. OAKLEY . 1998. Reconstructing ancestral character states: A critical reappraisal. Trends. Ecol. Evol. 13:361–366. DOBLER , S., P. MARDULYN , J. M. PASTEELS , AND M. ROWELL RAHIER . 1996. Host-plant switches and the evolution of chemical defenses and life history in the leaf beetle genus Oreina. Evolution 50:2373–2386. DONOGHUE, M. J., AND D. D. ACKERLY. 1996. Phylogenetic uncertainties and sensitivity analyses in comparative biology. Phil. Trans. R. Soc. Lond. B 351:1241–1249. EDWARDS , A. W. F. 1972. Likelihood. Cambridge University Press, Cambridge, England. EMERSON , S. B. 1996. Phylogenies and physiological processes—the evolution of sexual dimorphism in South East Asian frogs. Syst. Biol. 45:278–289. FEINSTEIN , J. 1993. PHYLIP (Phylogeny Inference Package) v. 3.0. Distributed by the author, Seattle. FINK, W. L., AND M. L. ZELDITCH . 1995. Phylogenetic analysis of ontogenetic shape transformations: A reassesment of the piranah genus Pygocentrus (Teleostei). Syst. Biol. 44:343–360.
632
SYSTEMATIC BIOLOGY
FRUMHOFF, P. C., AND H. K. REEVE. 1994. Using phylogenies to test hypotheses of adaptation : A critique of some current proposals. Evolution 48:172–180. Goldman, N. 1993. Statistical tests of models of DNA evolution. J. Mol. Evol. 36:182–198. HART , M. W., M. BYRNE, AND M. J. SMITH . 1997. Molecular phylogenetic analysis of life-history evolution in asternid starsh. Evolution 51:1848–1861. J ANZ, N., AND S. NYLIN . 1998. Butteries and plants: A phylogenetic study. Evolution 52:486–502. J UKES, T. H., AND C. R. CANTOR. 1969. Evolution of protein molecules. Pages 21–123 in Mammalian protein metabolism (H. N. Munro, ed.). Academic Press, New York. KOHN , J. R., S. W. GRAHAM , B. MORTON , J. J. DOYLE, AND S. C. H. BARRETT . 1996. Reconstructing the evolution of reproductive characters in Pontederiaceae using phylogenetic evidence from chloroplast DNA restriction-site variation. Evolution 50:1454–1469. KOSHI, J. M., AND R. A. GOLDSTEIN . 1996. Probabilistic reconstruction of ancestral protein sequences. J. Mol. Evol. 42:313–320. LIVEZEY, B. C. 1996. A phylogenetic analysis of geese and swans (Anseriformes: Anserinae), including selected fossils. Syst. Biol. 45:415–450. MADDISON , D. R. 1994. Phylogenetic methods for inferring the evolutionary history and processes of change in discretely valued characters. Annu. Rev. Entomol. 39:267–292. MADDISON , W. P. 1995. Calculatin g the probability distributions of ancestral states reconstructed by parsimony on phylogenetic trees. Syst. Biol. 44:474–481. MADDISON , W. P., M. J. DONOGHUE, AND D. R. MADDISON . 1984. Outgroup analysis and parsimony. Syst. Zool. 33:83–103. MADDISON , W. P., AND D. R. MADDISON . 1992. MacClade, version 3.00. Academic Press, New York. MARTINS , E. P. 1994. Estimating the rate of phenotypic evolution from comparative data. Am. Nat. 144:193– 209. MEYER, A., J. MORRISEY, AND M. SCHARTL. 1994. Recurrent origins of a sexually selected trait in Xiphophorus shes inferred froma molecular phylogeny. Nature (Lond.) 368:539–542. NORMARK , B. J. 1996. Phylogeny and evolution of parthenogenetic weevils of the Aramigus tessellatus species complex (Coleoptera: Curculionidae: Naupactini): Evidence from mitochondrial DNA sequences. Evolution 50:734–745. OMLAND , K. E. 1997. Examining two standard assumptions of ancestral reconstructions: Repeated loss of dichromatism in dabbling ducks (Anatini). Evolution 51:1636–1646. PAGEL, M. 1994. Detecting correlated evoluton on phylogenies: A general method for the comparative analysis of discrete characters. Proc. R. Soc. Lond. B. 255:37–45. PAGEL, M. 1997. Inferring evolutionary process from phylogenies. Zool. Scr. 26:331–348. PAGEL, M. 1999. The maximum likelihood approach to reconstructing ancestral character states of discrete characters on phylogenies. Syst. Biol. 48:612–622.
VOL. 48
PETREN , K., AND T. J. CASE . 1997. A phylogenetic analysis of body size evolution and biogeographyin Chuckwallas (Sauromalus) and other Iguanines. Evolution 51:206–219. PITNICK, S., G. S. SPICER, AND T. MARKOW. 1997. Phylogenetic examination of female incorporation of ejaculate in Drosophila. Evolution 51:833–845. PRUM, R. O. 1994. Phylogenetic analysis of the evolution of alternate social behaviours in the manakins (Aves: Pipridae). Evolution 48:1657–1675. REE , R., AND M. J. DONOGHUE . 1999. Inferring rates of change in ower symmetry in asterid angiosperms. Syst. Biol. 48:633–641. ROSENBERG , G. 1996. Independent evolution of terrestriality in Atlantic Trucatellid gastropods. Evolution 50:682–693. RYAN , M. J., AND A. KEDDY -HECTOR . 1992. Directional patterns of female mate choice and the role of sensory biases. Am. Nat. 139(suppl.):S4–S35. SCHLUTER , D. 1995. Uncertainty in ancient phylogenies. Nature 377:108–109. SCHLUTER , D., T. PRICE , A. Ø. MOOERS , AND D. LUDWIG . 1997. Likelihood of ancestor states in adaptive radiation. Evolution 51:1699–1711. SHAW , K. L. 1996. Sequential radiation and patterns of speciation in the Hawaiian cricket genus Laupala inferred from DNA sequences. Evolution 50:237–255. SIDDAL , M. E., D. R. BROOKS, AND S. S. DESSER . 1993. Phylogeny and the reversibility of parasitism. Evolution 47:308–313. SILLEN -TULLBERG , B. 1993. The effect of biased inclusion of taxa on the correlation between discrete characters in phylogenetic trees. Evolution 47:1182–1191. SPICER, G. S., AND J. JAENIKE . 1996. Phylogenetic analysis of breeding site use and a-amanitin tolerance within the Drosophila quinaria species group. Evolution 50:2328–2337. STERN , D. 1998. Phylogeny of the tribe Cerataphidini (Homoptera) and the evolution of the horned soldier aphid. Evolution 52:155–165. SWOFFORD, D. L., AND W. P. MADDISON . 1987. Reconstructing ancestral character states under Wagner parsimony. Math. Biosci. 87:199–229. TITUS , T. A., AND A. LARSON . 1996. Molecular phylogenetics of Desmognathinae salamanders (Caudata: Plethodontidae): A re-evaluation of evolution in ecology, life history and morphology. Syst. Biol. 45:451– 472. VOGLER, A. P., AND K. C. KELLY . 1998. Covariation of defensive traits in tiger beetles (genus Cicindela): A phylogenetic approach using mtDNA. Evolution 52:529–538. WAYNE , R. K., E. GEFFEN, D. J. GIRMAN , K. P. KOEPFLI, L. M. LAU , AND C. R. MARSHALL . 1997. Molecular systematics of the Canidae. Syst. Biol. 46:622–653. WRAY , G. A. 1996. Parallel evolution of nonfeeding larvae in echinoids. Syst. Biol. 45:308–322. YANG , Z., S. KUMAR, AND M. NEI . 1995. A new method of inference of ancestral nucleotide and amino acid sequences. Genetics 141:1641 –1650. YANG , Z., R. NIELSEN , AND M. HASEGAWA . 1999. Models of amino acid substitution and applications to mitochondrial protein evolution. Mol. Biol. Evol.
1999
POINTS OF VIEW
ZHANG , J., AND M. NEI . 1997. Accuracies of ancestral amino acid sequences inferred by the parsimony, likelihood, and distance methods. J. Mol. Evol. 44 (suppl. 1):S139–S146.
APPENDIX ESTIMATING ANCESTORS WITH D ISCRETE 1.01B Discrete, version 1.01b (Pagel, 1997), is a DOS-based program that can be used to estimate individual ancestral values. Discrete was written to test for correlated evolution between two discrete characters, and producing ancestor reconstructions in such a way requires several steps. First, Discrete deals with two characters at a time; therefore, for the purposes of estimating ancestors for a single character, the states must be entered twice. For example, for a tip (tipA) in state 1 on a branch 2 units long and whose immediate ancestor is nodeA, the entry would be “tipA, nodeA, 2, 1,1.” Because two characters are input, Discrete estimates two (or four) rates: a 1 and b 1 refer to ˆq01 and ˆq10 for the rst character, and a 2 and b 2 refer to qˆ 01 and ˆq10 for the second character. With this in mind: 1. Estimate ˆq (or qˆ 01 and ˆq10 ), using the command “testi.” To estimate one rate, use the “restrict a 1 =
633
b
1 ” option. The program will return the ML estimates for ˆq. Leaving out this restriction yields two rates (ˆq01 and ˆq10 ) for each trait. Record the ML rate estimates. 2. Revise the input le by modifying the data corresponding to the node of interest. Place either :0,0 or :1,1, respectively, after the branch-length data for that node. This triggers the “fossil” option in Discrete. For example, the row entry for a focal nodeA that is separated from its immediate ancestor nodeB by a branch of length 2 would be “nodeA, nodeB, 2:0,0” or “nodeA, nodeB, 2:1,1”. 3. Run “testi” on the revised input le; repeat for the “0,0” and “1,1” alternatives . In both cases, restrict all a ’s and b ’s to the ML values estimated in step (1). Use the “restrict” command (e.g., restrict a 1 = 0.08) to set a 1 , a 2 , b 1 , and b 2 to ˆq, or to set both a ’s to ˆq01 and both b ’s to qˆ 10 ; 4. Obtain the likelihood for the two trees you have made. Discrete returns negative ln(likelihoods), so the ML estimate at the node (0 or 1) will be that associated with the smaller of the two output values. The relative support for the ML state at the node will be e raised to a power equal to half the difference in the returned –ln(likelihoods) for the two trees (we must halve the difference because Discrete deals with both characters simultaneously) .
Syst. Biol. 48(3):633–641, 1999
Inferring Rates of Change in Flower Symmetry in Asterid Angiosperms RICHARD H. REE1 AND MICHAEL J. DONOGHUE Department of Organismic and Evolutionary Biology, Harvard University Herbaria, 22 Divinity Avenue, Cambridge, Massachusetts 02138, USA; E-mail:
[email protected] u
The question of whether evolutionary change in a character is more likely to occur in one direction than another is of general interest to evolutionary biologists, and the development of quantitative comparative methods has allowed hypotheses of bias in character gain/loss in phylogenies to be tested with increasing rigor. Parsimony algorithms are commonly used to infer ancestral character states, and thereby the location and direction of character changes in phylogenetic trees (e.g., Maddison and Maddison, 1992; Swofford and Maddison, 1992). 1
Corresponding author.
Ancestral states can be used in statistical tests of gain/loss bias, e.g., using the method of Sanderson (1993). One drawback to using parsimony to derive ancestral state estimates is that the estimates themselves are contingent on a particular set of transformation costs (step matrix), and parsimony itself does not provide any criterion to optimize such costs (Ree and Donoghue, 1998). Maximum likelihood methods of estimating instantaneous rates of evolution between categorical character states avoid this issue, by optimizing the rate parameters of a continuous-time Markov model over all possible ancestral state reconstructions