Sep 1, 2010 ... No. of received signals ≥ 3 (for 3D) .... and to do it in an automatic way, they
used the accelerometer (it measures the acceleration .... follow up in the
implementation of sockets was the desire to simplify and organize the ...
....
Antonio Arf`e, Pierre Deguy, Lou Guillot, Thibaut Le Guilly and Regis Louge
Android Application for Aalborg University
SSE3 Project Sept 2010 - Dec 2010 To be evaluated on January 17th 2011
Department of Computer Science Aalborg University Selma Lagerl¨ ofs Vej 300 DK–9220 Aalborg Ø DENMARK
Faculty of Engineering and Science Aalborg University
Department of Computer Science SYNOPSIS: Nowadays, all universities provide their own dedicated intranet systems. However, only few of them provide students and teachers features like internal communication system, context aware information in the campus and perhaps, all of this accessible from a smartphone. We propose an Android OS application dedicated to the students of Aalborg University, capable to achieve two main functionalities accessible from a smartphone: a Chat System and an Indoor Geolocation System. The Chat is based on a Peer-To-Peer architecture, no server either administrators intervention is needed. Building a Zero Configuration network, the system uses the XMPP protocol combined with JmDNS in order to allow students to multicast their presence over the network and see other connected users in order to discuss with them. The Indoor Geolocation System uses the access points’ RSS of the already existing WiFi infrastructure; no administrator’s intervention neither particular hardware is needed. We apply a Fingerprinting methodology. It creates on each smartphone, with a user-based training, a database of fingerprints containing sniffed RSS, BSSID and location-name. An algorithm is later applied to estimate the user’s location against the database. The results of different experiments and several prototypes’ implementation are also presented. We detail the difficulties that have been encountered and the possible solutions using concepts such as election algorithms, the final results and future improvements.
TITLE: Android Application for Aalborg University PROJECT PERIOD: SSE3, Sept 1st 2010 Dec 20th 2010 PROJECT GROUP: d522a GROUP MEMBERS: Antonio Arf`e, Pierre Deguy, Lou Guillot, Thibaut Le Guilly, Regis Louge SUPERVISORS: Mads Christian Olesen, Arne Skou CENSOR: Rene R. Hansen NUMBER OF COPIES: 8 REPORT PAGES: 84 APPENDIX PAGES: 7 TOTAL PAGES: 92
2
Contents 1 Introduction 1.1 Summary . . . . . . . . . . . . . . . . . . . . . . . . . . . . . . . . . . . . . . . .
5 7
2 Requirements 2.1 User’s requirements . . . . . . . . . . . . . . . . . . . . . . . . . . . . . . . . . . . 2.2 System’s requirements . . . . . . . . . . . . . . . . . . . . . . . . . . . . . . . . .
8 8 8
3 Prerequisites 3.1 Indoor Geolocation and Smartphones . . . . . . . . . . 3.1.1 Geolocation: the broad picture . . . . . . . . . 3.1.2 Geolocation in Android based smartphones . . 3.2 Chat Systems Technologies . . . . . . . . . . . . . . . 3.2.1 Existing Chat Systems . . . . . . . . . . . . . . 3.2.2 Overview of the Architectures . . . . . . . . . . 3.2.3 Peer-To-Peer system middlewares . . . . . . . . 3.2.4 Pure Peer-To-Peer XMPP Middleware: Smack tensions . . . . . . . . . . . . . . . . . . . . . . 3.2.5 XMPP security considerations . . . . . . . . .
. . . . . . . . . . . . . . . . . . . . . . . . . . . . . . . . . . . . . . . . . . . . . . . . . . . . . . . . . . . . . . . . . . . . . . . . . . . . . . . . . . . . API and the XMPP . . . . . . . . . . . . . . . . . . . . . . . .
. . . . . . . . . . . . . . ex. . . .
. . . . . . .
13 13 13 20 21 21 22 26
. 28 . 33
4 Experiments 4.1 Wireless Received Signal Strength fluctuations . . . . . . . . . . . . . . . . . . . 4.1.1 Merging the Probabilistic Analysis with the Distribution graphs information 4.1.2 Comparison with the Redpin Experiment . . . . . . . . . . . . . . . . . . 4.2 The basic sniffer application on Android . . . . . . . . . . . . . . . . . . . . . . .
34 34 43 44 46
5 Design 5.1 Indoor Geo-positioning on a smartphone: Feasible approach . . . . 5.1.1 Feasible Technologies . . . . . . . . . . . . . . . . . . . . . . 5.1.2 Feasible Methodologies . . . . . . . . . . . . . . . . . . . . . 5.1.3 The Design of the Fingerprinting system . . . . . . . . . . . 5.2 Chat Design . . . . . . . . . . . . . . . . . . . . . . . . . . . . . . . 5.2.1 Feasible Chat middlewares . . . . . . . . . . . . . . . . . . 5.2.2 Feasible technologies to set up P2P networks . . . . . . . . 5.2.3 Setting up the P2P chat system using XMPP and JmDNS .
48 48 48 48 51 56 56 57 57
. . . . . . . .
. . . . . . . .
. . . . . . . .
. . . . . . . .
. . . . . . . .
. . . . . . . .
. . . . . . . .
. . . . . . . .
6 Implementation 60 6.1 Geolocation Prototype . . . . . . . . . . . . . . . . . . . . . . . . . . . . . . . . . 60 6.1.1 Introduction . . . . . . . . . . . . . . . . . . . . . . . . . . . . . . . . . . 60 6.1.2 Application Class Description . . . . . . . . . . . . . . . . . . . . . . . . . 61
3
6.2
6.1.3 Positioning Algorithm . . . . . . . . . . . . . . . . . . . . . . Peer-to-Peer Chat Prototype . . . . . . . . . . . . . . . . . . . . . . 6.2.1 Introduction . . . . . . . . . . . . . . . . . . . . . . . . . . . 6.2.2 First Prototype: Multicast Issues on Android Phones and the network . . . . . . . . . . . . . . . . . . . . . . . . . . . . . . 6.2.3 Second Prototype: Using the Link Local Smack API . . . . . 6.2.4 Third Prototype: JmDNS Presence . . . . . . . . . . . . . . .
7 Conclusions 7.1 The Geolocation System . . . . . . . . . . . . . . . . . . . . 7.1.1 The accuracy . . . . . . . . . . . . . . . . . . . . . . 7.2 The Communication System . . . . . . . . . . . . . . . . . . 7.3 Future Work . . . . . . . . . . . . . . . . . . . . . . . . . . 7.3.1 Geolocation . . . . . . . . . . . . . . . . . . . . . . . 7.3.2 Chat . . . . . . . . . . . . . . . . . . . . . . . . . . . 7.3.3 Merge the Geolocation and Communication systems References . . . . . . . . . . . . . . . . . . . . . . . . . . . . . . . Appendix . . . . . . . . . . . . . . . . . . . . . . . . . . . . . . . Long time experiment graphs over AP2 and AP3 . . . . . . Long and Short experiment, mass distribution of the data . Geolocation Testing and Accuracy . . . . . . . . . . . . . . CD-Rom . . . . . . . . . . . . . . . . . . . . . . . . . . . . .
4
. . . . . . . . . . . . .
. . . . . . . . . . . . .
. . . . . . . . . . . . .
. . . . . . . . . . . . .
. . . . . . . . . . . . .
. . . . . . . . . . . . . . . . . . University . . . . . . . . . . . . . . . . . .
. 64 . 65 . 65
. . . . . . . . . . . . .
. . . . . . . . . . . . .
. . . . . . . . . . . . .
. . . . . . . . . . . . .
. . . . . . . . . . . . .
. . . . . . . . . . . . .
. . . . . . . . . . . . .
. 65 . 73 . 76 78 78 79 80 81 81 81 81 84 85 85 85 85 91
Chapter 1
Introduction People, and especially the new generation, spend more and more time using new technologies: computers, mobile phones, MP3 players and similar devices are essential for anyone. In addition to this, now more than ever, these devices are constantly connected among each other, often using the Internet as a common medium, eventually creating a large, highly mobile and ubiquitous network. Looking at this from a student’s point of view, without access to the Internet, he could not access his courses’ schedule, register to courses, receive or send e-mails and be quickly aware of the latest news concerning exam dates, meeting times or simple Friday bar meeting. In addition to that, if we think about new students just arrived at the university (number which could have an order of hundreds of people in Aalborg University), they are also in strong need of guidance through all the services which are offered. These can be printers or wireless networks, library access or secretary opening hours. Moreover, a lot of new students could be wondering: “Where am I in the campus right now? And where is the main Auditorium?”. Hence, for this purpose, the Internet is even more effective when provided on a phone, since a student will usually be in need of these information when he is around the campus, in his department, or just going from his room to the library, wondering if the latter would still be open. The type of access to the Internet, through a mobile, makes the communication and the retrieving of information “real-time”. Moreover, nowadays a smartphone is inevitable in a student’s pocket, and in order to realize our SSE3 project, we decided to develop an application that might be useful for the students of Aalborg University (AAU). The main idea we had in mind concerned the possibility for a student to fetch information on his mobile using the university website (or specifically the department’s website). Then we thought that it could be practical for teachers to directly communicate with students, maybe with a chat system, and last, for students to know where they are in the campus, allowing possibility to receive context-aware information. Eventually, our application focuses on two features that demonstrated to be the most challenging, summarized below: • Communication among students and teachers in the campus area. • Geolocation of a student in the campus. The application will be helpful for the students as well as the teachers. It will make communications easier and more straightforward. For a teacher it could be possible to cancel a course shortly before its beginning, or just to change the room without having to go around looking for the students who did not know about the last-minute changes. With the Geolocation feature, new students will be able to get quickly use to the new campus, classrooms, buildings and other facilities. 5
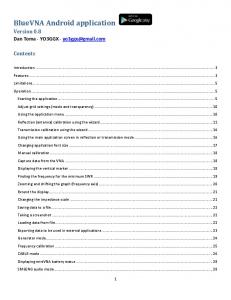
Figure 1.1: Market Share of Android Phones and iPhone from January 2010 to August 2010
Having well defined the main purposes, we immediately went through an important choice: to make this application as useful as possible and to reach a large amount of people, we had to choose between the two most popular mobile operating systems: Android OS and iPhone OS. As students interested in new technologies, we have observed the growing of Android over iPhone all around the world and especially in Aalborg University. To confirm this observation, the Nielsen company [19] published a survey on acquired smartphones from January to August 2010. We see in Figure 1.1 that Android has climbed and is now the most popular operating system. These two kind of smartphones combine cell phone, email, internet, camera, GPS and other features. Apple phones provide an intuitive interface on a large and clear screen, and its security is reinforced by the fact that Apple must approve all applications distributed on the Apple Application Store. On the other hand, Android is an open platform, thus, manufacturers have the choice of which hardware to use and developers do not need a license to program. By combining all these points, we thought that for our university it would be better to provide an open application, not specifically bounded to any vendor, either of software or hardware. That meant targeting the Android OS. Moreover, if the trend of Figure 1.1 will be confirmed in the following months, the number of sold smartphones equipped with Android OS could rapidly increase, giving the possibility to our application to reach a longer life-cycle and more possibilities of testing/improvements. This choice will also give us the ability to try the application on different mobiles, since the Android OS is available for several devices, thing which is not possible when using the Apple iOS only available on iPhone and iPad. Our attempt is then to provide AAU with an Android application that responds to the students’ needs in terms of communication and context-aware information through the possibility of knowing where they are.
6
1.1
Summary
As the application is formed by two different parts, namely, the communication among students and the location service, the report will usually provide two different sections in each Chapter. The first one regarding the location and the other one regarding the communication system. This would hopefully bring clarity to the whole report, avoiding to mix requirements, prerequisites, design choices and implementation descriptions which are related to two completely different topics. The remainder of this report is structured as follows: Chapter 2 shows the requirements of our project, both in terms of user requirements and in term of system requirements. In Chapter 3 we describe the prerequisites for the two main parts of our application. Concerning the location, Section 3.1 gives an overview of different Geolocation techniques, to later go through the existing technologies and the methodologies built upon them. We finish the section by providing information about how to use Geolocation technologies on Android based phones. The other section 3.2, concerning the Communication System, which we implement in the form of a chat, starts describing three of the most famous chat systems available nowadays, chosen for their different architectural designs. Later on in the section, we formalize advantages and disadvantages of the two main architectural design possibilities: the Client-Server and the Peer-to-Peer (P2P). Then we focus on giving an insight on some middlewares which provide P2P communications. We conclude this section by introducing pure P2P XMPP middleware and some security considerations about the XMPP protocol. The following Chapter 4, reports the experiments we have made to strengthen our understanding of the Geolocation topic. Section 4.1 provides the result of an experiment concerning the power fluctuations of wireless signals in an indoor environment. Section 4.2 explains our attempt to build a basic sniffer application using the Android OS, to test the ease of use of the Geolocation technologies provided by the Google OS. The next Chapter 5 provides key aspects of our design. For the Geolocation, Section 5.1, based on the knowledge acquired in the prerequisites, gives the reasons why we chose the wireless technology and the Fingerprinting methodology. Moreover, the high level design of the system and its components’ interactions are shown as well. Section 5.2, shows the Design of the Chat system. We discuss the opportunities given by XMPP and the reasons why we preferred it. Then we present the technologies available to set up a network with minimal efforts, in particular, a P2P network. At the end, we give an overview of the steps needed to create a chat connection using XMPP and JmDNS. Chapter 6 contains information about Geolocation and the Chat prototypes. We will see first how the Geolocation one (Section 6.1) has been implemented, taking a look at its structure, and at the positioning algorithm (Section 5.1.3.4) that was used. Then we will go through the implementation of the different P2P chat prototypes in Section 6.2. The first one will reveal us multicast issues on some of the Android phones and on the University wireless network. The second one will test the functionalities of the Link Local Smack API. We will see for this prototype a deeper description of its structure, and the JmDNS issue that was revealed by it. The third prototype has been implemented to find out if the previously mentioned issue was coming from the JmDNS library or from the Smack API. Finally Chapter 7 discusses the conclusions and possible future work to improve the application for both the Geolocation and the Chat system. For the Geolocation the testing and accuracy results are also provided.
7
Chapter 2
Requirements This project’s goal is to create an optimal and reliable solution for an Android Application for the university. Overall, this application will integrate several functionalities. In this part user’s and system’s minimal requirements are presented.
2.1
User’s requirements
Several requirements could be coming from the choice of creating a Communication/Geolocation system. We go through them to later pick the most interesting and challenging ones. The first functionality of the application is the RSS, shown in Figure 2.1 which is meant to show news from the departments’ RSS feed and it allows the user to subscribe to them. The second one is the course functionality shown in Figure 2.2, where the user is able to subscribe to courses in order to have links and information about them. It is directly linked to the third function which is the schedule. Indeed, for all the selected courses, their schedule appears directly linked to the information about the different lectures. Then the last basic functionality shown in Figure 2.3 is a simple Frequently Asked Questions that allows the user to have answers and to add new questions. Moreover, context-aware information, like knowing if the room we are standing in front is used by a teacher, could also be available. Having all that figured out, we wanted to focus on the two following functionalities: the real time indoor positioning and the communication system; this because several other requirements could be built on the top of these. The first one shown in Figure 2.4(a) will allow the user, at all time, to know his position inside the buildings. The idea is to create an indoor mobile Geolocation system for the Computer Science Department at first and for the whole university in a second time. On the top of it, we could add functionalities such as guidance system or context-aware information. The chat system functionality shown in Figure 2.5 will be an indoor chat system which will allow students to communicate together. There will also be chat rooms where people are able to discuss about specific topics. This may also allow the teacher to make announcements, last minute modifications, etc. Incoming events will be announced to the users using notifications, as shown in Figure 2.4(b), so that it will not be necessary to use the application at all time to receive them.
2.2
System’s requirements
In order to satisfy user’s requirements, the system must be composed by a mobile phone using the Android operating system. The application can be downloaded for free. This system is ini-
8
(a) RSS functionality main screen
(b) RSS functionality secondary screen
Figure 2.1: RSS Functionality screens
(a) Course Selection Functionality main screen
(b) Course Selection Functionality pop up adding course to calendar
Figure 2.2: Course Selection Functionality screens
9
(a) FAQ functionality main screen
(b) FAQ functionality secondary screen
Figure 2.3: FAQ Functionality screens
(a) Positioning Functionality screens
(b) Notifications Functionality screens
Figure 2.4: Positioning and Notifications Functionalities
10
(a) Chat functionality Contact screen
(b) Chat functionality Chat Rooms screen
(c) Chat Chats screen
(d) Chat functionality Conversation screen
Figure 2.5: Chat Functionality screens
11
functionality
tially developed only for the Cassiopea building, then it will evolve to cover the entire University. The chat system is a service: • created for both personal and professional use. Indeed teachers and students can exploit it to exchange information on courses, general topics, etc. This is why the technology needs to be strong and rely on several users in order to avoid a single point of failure. • that should not use any server to be instantiated. This allows the system to obtain the equality of the peers, avoiding set up mechanisms to decide who is a server and who is a normal user. • which needs to provide alerts about the incoming messages. Indeed the problematic is that the user should be able to know that messages have arrived when he is not using the application. • which would also provide presence status in order for the user to be aware of who is using the application. Indoor positioning system has to be implemented: • using an existing infrastructure and only technologies available on modern smartphones, such as GSM, GPS, WiFi or Bluetooth. This avoids to spend money and time on the deployment of new infrastructures and research time focusing on specific techniques and methodologies for indoor positioning. • having a mean distance error of less than 10 meters in order to achieve a room accuracy. • having a minimal intervention from administrators to set up the application. Thus, the system can be autonomous. • in a way that when few information sources are available, it is still possible to estimate the user’s location. The technical explanations concerning all these modules are provided further. Eventually, the indoor Geolocation and the Chat systems are the kernel of our application in terms of research, time and difficulties.
12
Chapter 3
Prerequisites The section will be structured in two main parts describing the different methodologies and possibilities we have to realize the modules of: • Indoor Geolocation and Smartphones • P2P Chat
3.1
Indoor Geolocation and Smartphones
This section briefly introduces the concept of Geolocation and provides an overview of the today’s technologies and different methodologies built upon them. After presenting the general concepts and background, it will narrow down its focus to the indoor Geolocation, giving more information on the techniques feasible for its requirements. In the end, the possibilities that the Android platform provides concerning the use of the technologies required for the Geolocation are shown.
3.1.1
Geolocation: the broad picture
Geolocation[42] is the practice of retrieving the geographical position of a device. Nowadays it has become a recurrent and requested feature to accomplish a variety of different tasks and to provide a wide range of services. Just to mention some of the services already available or in current development: Turn by Turn navigation, context-aware information supply, locationbased games and social networking. To achieve Geolocation of a device, we cannot set the context in which we are trying to realize it apart; that is because different contexts will have different requirements concerning accuracy, energy consumption, reliability and several other demands. Figure 3.1 gives an overview of the different contexts and accuracy requirements in which Geolocation can be applied; the figure will be further discussed as soon as the different technologies are presented. Thus, given a specific context, different methodologies and technologies might be helpful to reach the goal of locating a device, some of them are interchangeable and others are only suitable for a specific need (e.g. the GPS technology in its basic form, even though it is one of the most accurate and reliable methods, cannot be used in an indoor environment). 3.1.1.1
Overview of the Geolocation Technologies and Methodologies
One important point to clarify before going on is that, concerning Geolocation, technologies and methodologies are two different concepts, even though they seem strictly correlated and 13
sometimes overlap each other. Technologies concern all the hardware, transmission systems, receivers, protocols and infrastructures used to gather the information needed for the location, e.g. the strength of a received signal or the identifiers of some transmitting towers. The methodologies instead, are usually seen as built upon the technologies; they compute the final position of the device using different algorithms and measurement techniques1 . This section will follow a two-step structure, briefly presenting: 1. Geolocation Technologies, Section 3.1.1.2. 2. Geolocation Methodologies (measuring principles and positioning algorithms), Section 3.1.1.3. Even though the overview is quite wide, the point of this section is not to go deep in overwhelming details on all the methodologies and technologies; it is only meant to show the product of our research in finding the best suitable combination of technology and methodology for our final purpose: the indoor location of a smartphone device. Further references and links to all the information presented in the following paragraphs can be found in [32]. 3.1.1.2
Geolocation Technologies
Geolocation technologies can be categorized in several ways, taking into account features such as cost, coverage scale, hardware complexity and many others characteristics. As suggested in the indoor positioning techniques overview provided by Liu et al. [32], the Geolocation technologies can be summarized in 5 main groups, further explained in the following paragraphs. Others solutions are also available, such as the mix of different basic technologies and sensors or the positioning “Cordless Phone System” (CPS), but we do not include them in our survey as they might be seen as extensions of the basic technologies. • UWB, proprietary microwave solutions. • RF and IR, RF and Ultrasonic hybrid methods. • WLAN, Bluetooth, Zigbee, HomeRFPositioning. • GPS, DGPS, Wireless assisted GPS. • GSM, CDMA /3G mobile cellular network. The corresponding positions on the scale/accuracy graph can be seen in Figure 3.1. The vertical axis shows the scale of applicability, from indoor to broad and open space scenarios while the horizontal axis shows the resolution which might be achieved, from an order of 10 centimeters to some kilometers. UWB (Ultra WideBand) and proprietary microwave solutions The UWB technology (see Figure 3.2(a)) uses dedicated hardware capable of transmitting very short-pulsed frequency signals (from 3.1 to 10.6 GHz). Using such a short cycle of frequencies, it overcomes the problem of interferences with other radio systems and the presence of walls and objects. It can achieve a very high accuracy (20 cm) and the energy consumption is kept low by the use of these high frequencies. 1
In this paper we will often use the term Geolocation methodologies or positioning algorithms/measurement techniques with a similar meaning.
14
+ Figure 3.1: The five Geoposition families and the place they cover on the scale/resolution graph [32]
Radio Frequency Identification: RF and IR, RF and Ultrasonic hybrid methods The Radio Frequency technologies (see Figure 3.2(b)) use two main components: RFID readers (fixed) and RFID tags (movable, active or passive). For example, a reader can be placed on a door, and a tag applied on the device (or the person) which needs to be positioned. The range and the consumption depend on the use of the active or passive tags; the range usually varies between 1-2 meters to tens of meters, while the energy consumption may considerably vary. WLAN (Wireless Lan) and WPAN (Wireless Personal Area Network) The Wireless Lan IEEE 802.15 (see Figure 3.3(a)) is the dominant local wireless networking standard, while other minor technologies using a different range of frequencies, fall in the WPAN category (Wireless Personal Area Network, IEEE 802.15.4-2006 or ISO/IEC 18000-7). The main difference is the distance range and the data rate: WLAN usually goes between 50-100 meters with a high data throughput, while the WPAN has a range of 10 meters at most, and data rate around 250 Kbit. It is worth mentioning the most used WPAN technologies on the market: • Bluetooth, IrDA, UWB, Z-Wave. • DASH7 (ISO/IEC 18000-7). • ZigBee. • 6LoWPAN. GPS (Global Position System) and its variance: Wireless Assisted-GPS GPS (see Figure 3.3(b)) is the most successful system for outdoor environment Geolocation. It uses 27 satellites in orbit around the Earth and as soon as four of them are visible by the mobile receiver the position can be calculated. It needs a GPS receiver installed. The accuracy varies from 2 to 100 meters. The original version of the GPS is bounded to the possibility of the receiver
15
(a) UWB technologies and its scale/resolution
(b) RF technologies and their scale/resolution
Figure 3.2: Geolocation technologies and the range of applicability
to have a direct line of sight (LOS) with 4 satellites. Indeed, a variance has been created for indoor positioning: the Wireless Assisted-GPS [20] and SuperSense2 . These improved versions of the GPS aim to locate the mobile device even in a city-like scenario, where no line of sight is available. When the power of the received GPS signal is too low they will lean on a network (it might be wireless internet network) to obtain information about the position of the device. GSM, CDMA/3G mobile cellular network It is the network commonly used for mobile telephonic communications (see Figure 3.3(c)). The strength of the signal received by the mobile can be measured and used to calculate the distance from the transmitting antenna (often more than one) and hence the position of the mobile. The position is calculated using different algorithms, such as: Enhanced Observed Time Difference (EOTD), Time Of Arrival (TOA), Angle of Arrival (AOA) and CELL ID (the most commonly used). The accuracy varies from 200m to 10+ Km. 3.1.1.3
Geolocation Methodologies
A precise and complete positioning system is very difficult to obtain, due to the presence of not always measurable variables (e.g. walls and floors’ thickness) and the low probability of having a direct line of sight. The information provided by the different technologies section (Section 3.1.1.2) concerning the strength (in dBm) of these signals, says that it may considerably vary depending on the number of people present in the building, their movements and the possibility of having a direct (and clean) LOS. For example, an empirical experiment reporting the variations of wireless access points’ signal strength, measured from a static point (laptops placed in the same position for a week), during typical office workdays, can be found in the paper describing the Redpin application [12], which is an indoor localization system through user collaboration and in our experiments section (Section 4.1). There are mainly three methodologies, each of them uses different algorithms and calculations to elaborate the position of an object in space: 1. Triangulation. 2. Proximity. 3. Scene Analysis (Fingerprinting). 2
created by the two companies Atmel and U-blox, http://www.atmel.com and http://www.U-blox.com
16
(a) WLAN technologies and their scale/resolution
(b) GPS technologies
(c) GSM technologies
Figure 3.3: Technologies and scope
Triangulation It mainly consists of 6 different techniques. These techniques calculate an approximate value of the distances between the mobile target and one (usually more) station, using time, strength, phase and angle of the signals 3 . Figure 3.4 gives an idea of how the Triangulation works for the methods which includes the estimation of the distance; it estimates the distance of (at least) 3 points around the location to build 3 circumferences and find the unique intersection point among them. The location of the target is usually triangulated with some mathematical or probabilistic calculations. 1. TOA - Time Of Arrival It uses the idea that the distance between the mobile target and the stations is proportional to the propagation time of a signal. 2. TDOA - Time Differences Of Arrival It performs several TOA measurements and examines the difference in time among them, avoiding to rely on only one value. 3. RTOF - Roundtrip Time Of Flight of the signal It measures the time of flight of the signal traveling from the target to the receiver and its way back. 3
triangulation, in the main paper we have used for this literature review ([12]) is often used as a synonymous for Trilateration. Actually Triangulation is retrieving a location measuring the angles around the point we want to locate, while Trilateration attempts to measure the distances from it and the known points around. We will keep them as synonymous.
17
Figure 3.4: An example of Triangulation using one of the distance-based method. The distance between the location and three surrounding known points is estimated. From the distances (acting as a radius), 3 circumferences can be drawn. From the intersection of the 3 circumferences an unique point will be retrieved, representing an estimation of the location we were looking for
4. RSS-based - Received Signal Strength based The idea is that the received signal strength is proportional to the distance from the transmitter. Empirical models are used to obtain the distance from the measured strength. 5. POA - Phase Of Arrival It uses the phase of the signal, which, during the transmission, suffers from a delay that can be measured at the receiver station. 6. AOA - Angle Of Arrival It uses directional antennas to draw a line from the receiver to the target. Then, it uses the crossing of three or more lines to retrieve the target position. The main requirements and possible problems of the 6 triangulation techniques are summarized in Table 3.1. The time-based methods are usually in need of timestamps, and timesynchronization. The RTOF though, only needs one clock, residing on one device, to calculate the timing [12]. Of the 3 problems presented, the last one, the responder’s delay, concerns the fact that if the device that sends out the signal is very close to the device to locate, the time the signal will take to ”fly” from one place to another will be very short, and the time spent by the devices to receive and elaborate the signal could be much longer than the time of flight we want to measure. All the Triangulation methodologies have one or more a-priori requirements. For example Triangulation, with all of its variants, needs a map with the absolute or relative positions4 of the signal sources (e.g. when a device receives 4 signals from 4 different transmitters, to apply a triangulation method it is necessary to know the 4 transmitters’ positions). Thus, Triangulation heavily relies on the availability of a map of all the interesting transmitters’ 4 absolute location means locating a device using a coordinate system, while relative location means locating a device using some other environment information (e.g. the device is located in number 23 at the 2nd floor of the Computer Science Department)
18
Requirements Map of the receivers’ locations Time synch. between trans. and receiver Add timestamps into the signals LOS (Line Of Sight) No. of received signals ≥ 3 (for 3D) Complex hardware Problems Environment (walls, buildings etc.) Multipath Effect and Shadowing Responder’s answer delay in short distances
TOA
Triangulation techniques TDOA RTOF RSS-b POA
x x x
x x x
x
x
x
AOA x
x
x
x
x
x
x x
x x x
x x x
x
x
x
x x x x
x
Table 3.1: The Triangulation Methodologies: a-priori requirements and possible drawbacks affecting them.
position. Triangulation methods, especially the ones based on time measurements, suffer from the presence of environmental variables, such as walls or lack of LOS and other problems such as the Multipath Effect5 or the Shadowing6 which might attenuate or heavily reduce the speed and strength of the signal; for these reasons, combinations of the above mentioned techniques are often implemented. Proximity It is the simplest and least accurate method. It approximates the position of the device to a circumference around the closest and strongest antenna receiving the signal. Scene Analysis (Fingerprinting) This method[32] collects, for the place where we want to achieve Geolocation, an a-priori list of information concerning, for example, the measurements of the signal strength of the available access points. After that, the location of the user is calculated by comparing the current signal strength with the ones in the a-priori list; eventually, the predicted location will be the one where the values of the measured signal strengths are as close as possible to the ones in the list. To sum up, the Fingerprinting methodology consists in two phases: Offline Phase : Creation of a table containing coordinates and labels of the environment (e.g. room number, city name) plus the corresponding observed signal strength values. Online Phase : The current signal strength values are compared with the ones in the table. To compare and pick the location with the highest probabilities, different methodologies can be applied. 5 A wireless signal emitted from a known source can be received two or more times by a station, due to several causes (e.g. the signal will follow, if possible, the direct LOS to the station, but it can also start bumping on some walls before reaching the destination for the second time). These different components of the same signal might interfere with each other, creating the so called Multipath Effect. 6 It is a special case of the Multipath Effect where two or more received components of the same signal interfere with each other to the point that they are not discernible anymore (e.g. they arrive to the destination with the same frequency and amplitude but with an opposite phase, the result will be an empty signal).
19
Related work on Fingerprinting in an indoor environment: The Redpin project To gather information, either theoretical and practical, concerning the Fingerprinting location methodology, a good start is the Redpin project[11] which describes a method and an implementation of a Fingerprinting system applied to a company or university-like environment (several floors, numbered rooms, good wireless access points coverage, either in power or in numbers). The Redpin application has very few constraints and a-priori requirements; the most important is that it needs the collaboration of the users to train the system, especially during the initial phase. To support their choice of user-trained system, they also cite website such as Wikipedia or OpenStreetMap, completely based and running on users’ intervention. The Redpin project implements the Fingerprinting system above a distributed architecture, composed of mobile smartphones working as RSS’s sniffers from the APs and a server to which is addressed the storing of the fingerprints and the positioning calculation. The Database of fingerprints is created by collecting the received signals from all the available sources among GSM towers, wireless access points and static Bluetooth equipments. As the calculations and the storing is done on a server, the system is continuously working, retrieving data from the phones and checking the user’s location in the Database. In case the server considers the user’s location as unknown, which means that no fingerprint in the Database is “close” enough according to a manually set threshold, the user will be asked with a popup to insert the name of the new location. As they state in Chapter 4, using a server to store fingerprints and retrieve the location sacrifices the users’ privacy, but it is necessary to guarantee the collaboration, higher accuracy and area-coverage. Concerning the location calculations, it is done on the server by using a simple algorithm: it measures the “distance” between the current measured fingerprint and all the entries in the Database; the distance is a number which decreases if an AP is present both in the current fingerprint and in the Database entry and increases if it is not present. Moreover, the distance increases or decreases also depending on the measured RSS values, if the RSS of an AP in a fingerprint in the Database is very close (it is not specified in the Redpin paper if they use different threshold levels or just one) to the current one, the distance will decrease. At the end, the fingerprint with the smallest distance is elected as the estimated user’s location. In a further improvement, described in [13] and called Asynchronous Interval Labeling, they noticed through an experiment (see Section 4.1.2 for a comparison of this experiment with our experiments) that an important source of uncertainties is the high short-time variations of the APs’ RSS. Moreover, in their system, the user is asked to intervene whenever the application does not recognize a location, even when he is not moving. So the user can get annoyed by the redundant queries. For that they decided to measure many fingerprints for each location, and to do it in an automatic way, they used the accelerometer (it measures the acceleration of the mobile, namely, if the device is moving and in which direction) to notice when the mobile is moving or not. As far as the phone is still, they measure multiple fingerprints for the same location. This way they avoid with overwhelming the user of redundant location labeling queries.
3.1.2
Geolocation in Android based smartphones
Android has three ways to perceive users’ location [7]: • GPS (accurate but energy consuming and presenting reception problems when indoor). • Cell tower. 20
• WiFi. Possible sources of error are: • Trade-off among number of location sources versus speed, battery efficiency and accuracy. • The user is moving. • Accuracy of the different location sources. Eventually, Android has a class, LocationManager, which might retrieve either the GPS position (method GPS PROVIDER()) or a mix of both Cell tower and WiFi spot information (method NETWORK PROVIDER()). For both techniques Android will provide latitude/longitude data plus some optional data if available. The reliability and the accuracy of the information heavily rely on the possibility to use GPS satellites and the number and distance of GSM antennas connected to the mobile [41] 7 . These classes provide the geographical position and the possibility to run an application once reached a specific location[6].
3.2
Chat Systems Technologies
This section introduces the notion of a chat system and provides an overview of the different existing systems, their features and architectures. After having given the general information about what already exists, the section will focus on the architectures’ possibilities, namely, Client-Server, Peer-to-Peer (P2P). For each one of them, we list the advantages and disadvantages. This gives us a deeper insight on the possibilities we have to build a Chat system and will help us make reasonable choices during the Design part.
3.2.1
Existing Chat Systems
Instant messaging is a real-time text-based communication between people who use devices able to connect to networks, such as computers, phones, etc. 3.2.1.1
Windows Live Messenger
This instant messaging client was created by Microsoft in 1999 and is now used by about 330 millions users per month [45]. The protocol used by Windows Live Messenger consists in sending messages between a client and a server. For instance if a contact signs out, the server sends a particular message to the client, which will mark the contact as offline. This network relies on different types of servers to handle the communications. They are detailed in Table 3.2. 3.2.1.2
Facebook Chat
More than 500 million persons use the Facebook chat, which was created in April 2008. The chat service is directly available in the browser, at the bottom of Facebook pages. In order to receive messages from a user, the client pulls update from the server, the Web layer takes care of these web requests. Chat loggers are servers which store conversations between the page loads. Presence servers receive periodic updates from channel clusters. In each cluster we find an array that keeps available users. This system is illustrated in Figure 3.6. 7
To calculate the mobile position through the GSM signal, Android uses a map where each antenna is linked to its specific location. The map is created by continuously retrieving information from Android users which are using a GPS and WiFi equipped mobile
21
Figure 3.5: MSN Messenger architecture
Server Dispatch Server
Function Tracks locations for the notification servers and communicate the IP address of these server to clients.
Notification Server
Provides a presence service (notifications about online status for instance)
.NET Passport Login Server
Part of the authentification process, provides a single sign in for all Internet services.
Switchboard Server
Provides an instant messaging service between two clients.
Table 3.2: MSN Messenger Servers and Functions
3.2.1.3
Skype Chat
Even if Skype is famous for allowing people to make voice calls over the Internet, it is also an instant messaging system, which is based on a P2P protocol. Thus it requires minimal centralized infrastructure. The information about users using Skype is distributed among clients (or nodes) in the network [9]. There are three kinds of entities called ordinary nodes, supernodes, and login server. Figure 3.7 shows the architecture of Skype. Each client keeps the IP address and port numbers of reachable supernodes. A supernode can be attributed to a client with good bandwidth, no firewall, and adequate processing power. Supernodes relay communications for clients behind firewalls.
3.2.2
Overview of the Architectures
This section provides an overview of the two main architectures which could be used to implement a chat system. For each of them, we focus on describing the advantages and disadvantages, in order to compare them and to pick the one that best suits our requirements for the Chat system. One more thing to notice is that these two architectures can also be mixed and used in ways that allow to take advantage of both of them. 22
Figure 3.6: Facebook chat architecture [31]
3.2.2.1
Client-Server
The client-server model of computing is a distributed application structure that partitions tasks or workloads between the providers of a resource or service, called servers, and service requesters, called clients [2]. Often clients and servers communicate over a computer network on separate hardware, each one of them being customized for their designed purpose, but both client and server may reside in the same system. A server machine is a host that is running one or more server programs which share their resources with clients. It often features higher-powered central processors, more memory, and larger hard disks than clients. A client does not share any of its resources. We can find a lot of different servers: for example web, FTP, Database, mail, chat and terminal servers. For example, web services are implemented on servers. For each kind of server, there is the associated client: a Web browser will be in communication with a Web server for example. History Client-server communication principles and techniques have closely paralleled the development of the open source operating system movement, as well as trends in programming language design and use [25]. The first use of the concept of client-server programming, as it is represented in its current form came with the 1977 release of the Unix operating system for the DEC VAX computer, as implemented at the University of California, Berkeley. With the introduction of networking in minicomputers, the Unix system was enhanced with the addition of ”sockets”. The implementation of sockets gave rise to the now familiar system of host names, domain names and common service-port associations. The immediate follow up in the implementation of sockets was the desire to simplify and organize the process of creating connections between programs. For this project, engineers at Sun Microsystems, implemented a system called ”remote procedure call” (RPC). The driving philosophy is that requests from a server should look, as much as possible, like local function requests in the user’s application. Hence the terminology ”procedure call”. Sun used RPC to implement their ”network file system” which was the first successful attempt to make the file systems of many computers appear to users as one file system.
23
Figure 3.7: The architecture used by Skype
Composition of a Client-Server network Client devices are typically computers with network software applications installed that request and receive information over the network. Mobile devices as well as desktop computers can both function as clients. One server generally supports numerous clients, and multiple servers can be networked together in a pool to handle the increased processing load as the number of clients grows. How it works The client-server model can be used on the Internet as well as local area networks (LANs). Network clients initiate communication sessions making requests to a server (that is to say sending messages). Servers respond to their clients by acting on each request and returning results. Thus, they are able to provide a function or a service. Functions can be e-mail exchanges, web accesses and Database accesses. Many business applications being written today use the client-server model, as well as the Internet’s main application protocols, such as HTTP, SMTP, Telnet, and DNS.
24
Advantages and Disadvantages Advantages 1. Because a client-server architecture enables the roles and responsibilities of a computing system to be distributed among several independent computers that are known to each other only through a network we have an additional advantage to use this architecture: greater ease of maintenance. For example, it is possible to replace, repair, upgrade, or even relocate a server while its clients remain both unaware and unaffected by that change. 2. Since data storage is centralized, updates to that data are easy to administrate. 3. Client-server networks generally offer advantages in keeping data secure. In fact all data is stored on the servers, which generally have far greater security controls than most clients. Servers can better control access and resources, to guarantee that only those clients with the appropriate permissions may access and change data. Disadvantages 1. As the number of simultaneous client’s requests to a given server increases, the server can become overloaded. 2. The client-server paradigm lacks robustness. With this model, if clients’ requests can not be fullfiled, resources are not available anymore. More precisely, clients could not access to the data from the server. If it is a mail server, persons running clients will not be able to access to their mail anymore. 3.2.2.2
Peer-to-Peer
P2P is a communication model in which each part has the same capabilities (and responsibilities) and all of them can initiate a communication session [44]. It uses distributed resources (i.e. computing power, networking resources) to perform a task (like content delivery, collaboration or e-commerce) in a decentralized manner. It differs from the client-server and the master-slave model. In some cases, P2P communications are implemented by giving each communication node both server and client capabilities. P2P provide opportunities for real-time communication and ad-hoc collaboration. It is usually used as a file sharing mechanism too, and it allows files to be swapped directly between user’s computers using the same networking program instead of having the file first stored on a server. This means that when you use P2P services, people are actually connecting directly to your computer to retrieve files, and not to a server which would act as a “middle man” [3]. This type of sharing became very popular with the famous Napster service as well as Gnutella, Grokster, KaZaA, etc. It was used to share copyrighted files. Movie productors and record labels showed their concern by suing some P2P users. In recent years the P2P abbreviation has taken another meaning: People-to-People. Thus it has become a marketing abbreviation for selling P2P software and for creating businesses that can help individuals on the Internet to meet one another or to share some common interests [36]. Composition of a Peer-to-Peer network A P2P network is made of ”peers”. Each peer is an equal partner. All client versions of Windows, Mac and Linux can function as nodes in a P2P network and allow their files to be shared thanks to an additional software [4]. 25
How it works Generally speaking, the user must first download and execute a P2P networking program [44]. After launching the program, the user enters the IP address of another computer belonging to the network (typically, the Web page where the user got the download will list several IP addresses as places to begin). When the computer finds other network members online, it will connect to them. Users can choose how many member’s connections to seek at one time.
Advantages and Disadvantages Advantages • First, it does not depend on a centralized server. There is no central decision point and it is dynamic in the sense that there is an unpredictable set of participants. Thus, we avoid the loss of our system in case of a breakdown of one or several servers (no single point of failure). • A P2P system is self organizing, that is to say there is no permanent infrastructure and no centralized administration. • It can share load by using computer resources (memory and CPU). • It is possible to avoid the expenses involved in maintaining a centralized server. Moreover, it can provide anonymity in case it is needed. Disadvantages • The system is not centralized, making administration difficult. • The security could be an issue, as a malicious client can try to be a part of the network. There is no filter by default to avoid a specific client to join the network. Maybe a mechanism for the identification should be implemented. • Data updates may need to be distributed and applied to each peer in the network, which is both time-consuming and error-prone, as there can be thousands or even millions of peers.
3.2.3
Peer-To-Peer system middlewares
Middleware is a term that is difficult to define. A popular definition given by Bernstein [10] defines middleware as programming interfaces and protocols that sit ”in the middle”, in a layer above the operating system and networking software and below industry specific applications. A middleware provides services that can be used to rapidly develop and deploy distributed applications. CORBA, J2EE, JMS and COM are some popular middleware solutions. These existing middleware solutions were not designed for P2P computing. The infrastructure provided by the existing middlewares can be used for synchronous/asynchronous communication between peers, but they do not support P2P specific concerns like overlay network management, message multicast and resource discovery. P2P middlewares address these concerns which were not supported in the older middlewares, and provide services which can be used in the P2P domain. They can be developed using existing lower-level middleware solutions like SOAP or CORBA.
26
P2P middlewares provide software components that can be used for rapidly developing P2P applications. P2P applications developed using P2P middlewares built upon tested components and services and hence tend to be more reliable and bug-free. Current middlewares have different levels of support and use different approaches, for developing P2P applications [38]. We have focused ourselves on few middlewares to select the one which fits the best. 3.2.3.1
XMPP (eXtensible Messaging and Presence Protocol)
XMPP (also known as Jabber) is a technology for real-time communication. XMPP is an open technology for streaming XML over a network [1]. It is well-known and it is intended for instant messaging but it can be used for developing other type of P2P applications [38]. The connecting peers are able to receive presence information about other peers. Thanks to XMPP, we can have a state of presence for each contact and we can chat in real-time. We can talk with several persons at the same time too. We are able to use voice and video (thanks to Jingle). XMPP is an open standard and the authentication is ensured by SASL. The connection is secured by TLS between clients and servers and the encryption uses GPG or E2E (see Section sec:security). Extensibility is one of the greatest strengths of XMPP. Peers in Jabber networks can be uniquely identified by a Jabber Identifier (JID). A JID is of the form [peername@]domain[/resource]. The domain name represents the Jabber server to which the peer connects. Jabber enables any two peers on the Internet to exchange XML documents containing communication messages (message document), resource availability information (presence document) or query/response messages ( Info/Query (IQ) documents). The structure of these XML documents is defined by Jabber. All the XML documents can be extended to include extra information within a tag. IQ(Info/Query) documents provide a simple request/response framework within Jabber. It allows peers to pass XML-formatted queries and responses back and forth. A query tag can be used to extend IQ documents. One of the drawbacks of XMPP is that it uses a hybrid P2P architecture. The Jabber server is used for authenticating peers and resolving JID to a physical network address. But peers can exchange data directly by establishing a connection which is brokered using Jabber servers [38]. XMPP is decentralized: it is similar to the e-mail network. That is to say anyone could implement their own Jabber server. There are tens of thousands of Jabber servers running on the Internet today. The most famous service using XMPP is Google Talk. It is used by clients such as Trillian, Pidgin or Adium (for Mac OS X) 3.2.3.2
Pastry
Pastry is a decentralized object location and routing sub-system for P2P applications. It is self-organizing. Pastry provides an API which can be used to develop P2P applications. Each node in the pastry network is assigned a unique node id. When presented with a message and an ID, Pastry efficiently routes the message to a peer with the node id that is numerically closest to the key, among all currently live pastry nodes. The expected number of routing steps is O(log2 N ) where N is the number of peers in the network. Eventual delivery of a message is guaranteed in Pastry. It chooses a route which is likely to be the best respect to proximity metrics [38]. To support the routing procedure, each pastry node maintains its routing state consisting of three tables providing information about nearby and numerically close nodes. Pastry has the ability to take into account network locality when routing messages: a message is not only sent to the numerically closest nodeId to the message key, it also chooses the physically shortest way to go there.
27
New nodes joining a Pastry network send a join message with a key to the network through a boot strap node obtained through external means. The join message is routed to the numerically closest node. All the nodes in the route path of the message respond with their state tables (used for routing messages) and the information is used to populate the state tables of the new node.[27] Pastry cannot be used to multicast messages on the overlay to search for an object matching a search criterion.[38] 3.2.3.3
Other P2P Middlewares
There are other P2P system Middlewares that we could use. To quote few of them: JXTA, SpeakEasy and Chedar. 1. JXTA (content-management application domain): JXTA is a specification for developing P2P applications. A JXTA specification does not guarantee interoperability among different JXTA implementations. It is based on 6 different protocols. They use XML schema to describe the format of the exchanged messages between peers to perform a service. It uses TLS for security. 2. SpeakEasy (or ObjE): SpeakEasy is a technical framework for developing P2P applications which support ad-hoc collaboration. In SpeakEasy any entity that can be accessed over a network (eg, printer, file, URL) is cast as a component. It contains a security layer. 3. Chedar (CHEap Distributed ARchitecture): Chedar is totally decentralized and can be used as a basis for P2P applications. It combines four different topology management algorithms and provides functionality to monitor how the P2P network is self-organizing.[8] These systems have been developed for general purpose applications and they do not provide any specific features dedicated to a chat module.
3.2.4
Pure Peer-To-Peer XMPP Middleware: Smack API and the XMPP extensions
Based on the fact that we will maybe need XMPP for the implementation of our chat module, we decided to search for appropriate tools to implement it. To do so, we focuses our research on three main points: • These tools have to be Java based as the Android implementation is so. • They have to be compatible with Android or at least possible to make it compatible. • They have to provide serverless functionality as we want our chat to be based on P2P. 3.2.4.1
XMPP Java based tools
Throughout all the research, we found out that people all around the Internet tried to implement their own Java tools to use XMPP. Indeed, as XMPP is a technology used to create a lot of chat clients for the well-known server such as Google Talk, programmers tend to provide a lot of XMPP tools. Nevertheless our attention was attracted by the work of Ignite Realtime [18]. This community aims at providing tools for the users and the developers of their open source Real Time Communication projects. Among others, they implemented a tool called OpenFire which is used to set up servers for Real Time Collaboration using XMPP. Not only do they provide this kind of software, they also provide their APIs to implement clients for them. Among them, the 28
Smack API which is an Open Source XMPP client library for instant messaging and presence. And the main characteristic that attracted us was that this API is pure Java. This API differs in many ways from the other APIs that we managed to find. Indeed, the fact that it comes from a strong programmers community makes it evolutive and effective. For example, during the whole implementation process, we experienced some troubles with the multicast that we will describe later on, and so we asked for some help to one of the programmer and he had no problems helping us enjoyed by the fact that we wanted to implement his work on new technologies. 3.2.4.2
Overview of the Smack API
This API provides useful and easy to use tools for XMPP Clients. For example, sending a text message to a user can be accomplished in only a few lines of code: XMPPConnection connection = new XMPPConnection( ” jabber . org ” ) ; connection . connect ( ) ; connection . l o g i n ( ”mtucker” , ”password” ) ; Chat chat = connection . getChatManager ( ) . createChat ( ” j s m i t h @ j i v e s o f t w a r e . com” , new MessageListener ( ) { public void processMessage ( Chat chat , Message message ) { System . out . p r i n t l n ( ” Received message : ” + message ) ; } }) ; chat . sendMessage ( ” H e l l o ! ” ) ;
These tools provided by the Smack API allow the developer not to code at the packet level or not to be familiar with XMPP XML. 3.2.4.3
Compatibility with Android
The next step of this research was to make sure that this API was compatible with Android and so implementable on an Android phone. One strong point is that the majority of the applications that aim at testing XMPP clients Android applications uses the Smack API. We wanted to make sure that there were no problems and we implemented a little application using the API recreating a Gtalk client (see Chapter 6). We experienced an easy way to implement such an application and had good results. 3.2.4.4
XMPP Server
One of the main problems with this API is that it is using an external XMPP server. For our example implementation it was a Google Talk server. And this brought issues since we do not want to use any server and only Link Local connections between the peers of our network. 3.2.4.5
Link-Local Implementation
We thus searched for an implementation of this feature throughout the community website and forum. It happened that in the years 2008/2009 there was a project of doing a patch for the API integrating such a feature. Unfortunately this patch was not efficient for an Android implementation at that time. Indeed, the developers have encountered issues with the phones that were random and unpredictable. As those studies were made on Android 1.0 and 1.5, we decided to take a look at it with the new version of Android, the 2.1-update1. We thus dug into the Link Local Smack API designed by Jonas Adahl [30].
29
3.2.4.6
XEP-0174 Extension for XMPP - Serverless Messenging
Among all the possible extensions available for XMPP, listed on the XMPP webpage ([22]), the number XEP-0174 called Serverless Messaging provides the possibility to start direct XMPP client-to-client interactions, without the need of a server for the authentication of the participants. The previously cited API aims at adding this feature to the actual Smack API. It uses the principles of the zero-configuration networking. It is called Zeroconf [15], namely, it attempts to create a usable Internet protocol (IP) small/local network without manual operator intervention or any special configuration servers. Zeroconf, main technologies This paragraph briefly presents the main Zeroconf technologies that allow a user to automatically connect computers, networked printers, and other network devices without being expected to know all the set-up parameters. Here are listed its three main technologies: • Assignment of IP addresses for networked devices (link-local address autoconfiguration). it makes that sure all the devices have got an IP address that is unique over the local network. • Multicast Domain Name System services (mDNS). It provides automatic resolution and distribution of computer hostnames in a small/local network where no conventional DNS server has been installed (e.g. a printer service could be named “printer.local“). • Automatic location of network services. A service will advertise itself over the whole local network (e.g. the printer service will advertise itself on the networks as ”printer-local“). Without Zeroconf, one must previously set up special services, like Dynamic Host Configuration Protocol (DHCP) and DNS, or set up each computer’s network settings manually. The XMPP Serverless messaging extension is typically restricted to a local network (or ad-hoc wide-area network), because of how zero-configuration networking works. How ServerLess Messaging XMPP works In this paragraph we attempt to describe how the serverless mechanism works, and we will do it thanks to an example, inspired by the XEP-0174 documentation. We have two hosts, A and B. We want to know how A can start a connection with B on an ad-hoc basis. First of all, A has to advertise itself (as a service) as a serverless address in order for B to dynamically find it. A does this by running a daemon supporting both: • DNS-based Service Discovery (”DNS-SD”, defined in DNS-Based Service Discovery [14]). • Multicast DNS (”mDNS” as defined in Multicast DNS [39]). By running this deamon the client A obtains the publication of its service via mDNS and the start of a listener to get incoming connections from B (or others) directed to A. On the other side, B can receive these multicasted messages and reply back.
30
3.2.4.7
Multicast DNS (mDNS)
Multicast DNS [39] is a way of using standard DNS programming in small networks where no DNS server is available. It has been provided by the participants of the IETF (Internet Engineering Task Force) ZeroConf Network and DNSExt working groups. While this requirement could have been met by designing an entirely new protocol, they chose to adapt the DNS protocol. In this way, programmers would not have to implement their application in different ways if they want it to work in large configured networks and small ZeroConf ones. It also allows the application currently released to work with mDNS in ZeroConf networks without any changes. What is Multicast ? Multicast is a way of distributing information from a sender to a group of receivers. The receiver that is interested in the messages sent to that group just joins it. Those subscriptions to groups allow the switches and routers to establish a route between the sender and the receivers. In multicast, each packet is issued only once and then is routed to all machines within the multicast group without any content being duplicated on a physical line. Thus the network copies the data [43]. A multicast group consists of a set of machines. It is fully dynamic and open, that is to say that a station can join or leave the group at any time, there is no limitation of sources, a station can even send a packet in a group without joining. The Internet Protocol (IP) uses addresses from 224.0.0.0 to 239.255.255.255 for multicast. The 28 least significant bits represent the group address. Multicast addresses 224.0.0.1 to 224.0.0.255 are local and reserved for the operation of network protocols. When a machine wants to send a packet to a multicast group, it sends the packet to the IP address that identifies the group (for instance 224.1.5.6). The reception is performed by a router subscribed to the group and then the packet is duplicated and sent. mDNS Names Multicast DNS specifies a special DNS top-level domain ”.local.” for link local domains. The names in these domains are meaningful only on the link where they originate. The DNS request for names ending with ”.local.” must be sent to the mDNS multicast address 224.0.0.251. The DNS request for other names may also be sent to this address if no DNS server is available. This allows computers in a local network to be able to communicate with each other even when disconnected from the internet. mDNS queries There exist three types of multicast DNS queries. One-shot queries made by conventional DNS clients, one-shot queries accumulating multiple responses made by multicast aware DNS clients, and continuous ongoing multicast DNS queries made by IP network browser software. Multicast DNS clients have to send multicast DNS queries from UDP port 5353 (which is assigned to mDNS), and listen to multicast DNS replies sent from the same UDP destination port, at the mDNS multicast address 224.0.0.251. One-shot mDNS queries The basic mDNS client can simply send DNS request blindly to the address 224.0.0.251:5353. When a client queries a name that falls into the reserved mDNS 31
domains, instead of using a unicast DNS server, the query is sent to 224.0.0.251:5353. These simple rules are enough to implement a minimal mDNS client. This kind of clients will typically take into consideration only the first DNS response that they will receive, which in some cases can be insufficient. One-shot mDNS queries accumulating multiple responses For certain tasks, it can be useful for mDNS clients to wait for multiple replies to a single mDNS query. This kind of clients have to be aware that receiving a reply does not indicate that it might not receives other. And while simple mDNS clients will retransmit their queries until they receive one response, more complex clients could retransmit their queries until they receive a satisfying collection of replies. When such clients retransmit a query for which they have already received responses, they must indicate to responders which have already replied, that their replies have been received, in order to improve the network efficiency. Continuous mDNS querying When using one shot querying, the transaction starts when the query is issued by the client, and ends when the desired responses have been received. But in certain systems, such as a software displaying a list of printers in a network, it can be useful to have a mechanism which would be aware of the incoming and outgoing devices in order to insure to the user a reliable list of available printers. Such kind of software should use the Time To Live (TTL) value included in the replies, which indicate the time for which a response is valid. Before the TTL for a reply has expired, the software should reissue a query in order to check if the device which replied before is still alive. Multiple questions per query It is possible for mDNS client to embed multiple questions in a single query. The result of that is exactly the same than issuing several questions in multiple queries, but it improves the efficiency of the network. Questions requesting unicast responses Responding to question with multicast has the benefit that all the participants of the network are able to see the response. However, in some case, it may be unnecessary that all the participants receive a response. The first bit in the class field of a DNS question can be set in order to ask for a unicast response from the repliers. The unicast responses can be useful for a incoming client in the network, since it may ask for a lot responses that all of the others participant may already be aware of, and would flood the network for useless purpose. However, if a responder sends a respond that has not be sent for a long time (according to TTL), it may choose to multicast this response anyway. Responding Response can be issued by responder when responding to a question from a querier, or when a responder has an announcement that it considers useful for the other participants of the network. When responding to a multicast question, a random delay is inserted for responding, in order to avoid that all the responders replies at the same time, which would lead to a collision in the network. When a responder responds to a multiple question query and has multiple responses to deliver, it should aggregate as many as it can to send them in a single multicast DNS response packet, in order to improve the network efficiency. 3.2.4.8
JmDNS
JmDNS is a Java implementation of mDNS. The project was created in 2002 by Arthur Van Hoff and was originally called JRendezVous.
32
Java, as a high level language, is not the most appropriate one for low level networking, but is really convenient for service registration and discovery. JmDNS provides a pure Java and easy to use mDNS implementation that runs on most of the Java virtual machines.
3.2.5
XMPP security considerations
The following information come from the XMPP standards foundation [34] and Wikipedia. Authentication and Encryption XMPP networks use: • TLS (Transport Layer Security) for channel encryption. TLS is a cryptographic protocol that provides confidentiality and integrity of exchanged data. It uses symmetric cryptography for privacy and a keyed message authentication code for message reliability. • SASL (Simple Authentication and Security Layer) for authentification. SASL is a framework for authentication and authorization. It decouples authentication mechanisms from application protocols, allowing any authentication mechanism supported by SASL to be used from any application protocol capable of using SASL. Authentication mechanisms can also provide a layer of data integrity that can provide services for data security and confidentiality of data. • DNS (Domain Name System) for validation of server hostnames. DNS allows to a establish a correspondence between an IP address and a domain name and more generally to find information from a domain name. These 3 different technologies allow to ensure the identity of sending entities and to encrypt XML streams. The use of TLS and SASL for the XML stream have to be negotiated to secure communication between serverless entities. Sometimes an entity can accept an unencrypted and unauthenticated channel and in this case the client has to warn the user that the channel is neither authenticated nor encrypted.
33
Chapter 4
Experiments In this section we describe the experiments we have carried out, before starting the architecture design of our system. The aims of these experiments are the following: (i) to give us a better understanding on some characteristics of the wireless signals (namely, the signal strength fluctuations over short and long term), which will be useful for our Geolocation system; (ii) to have a quick glance on what is possible to gather, in term of network data, with the Android OS on a mobile. On the results of these experiments we eventually base or refine some of our final design decisions.
4.1
Wireless Received Signal Strength fluctuations
One thing we have noticed, during our review of Geolocation methodologies in section 3.1.1.3, is that the RSS values may suffer high fluctuations, due to several different causes. One of them is the presence of fixed or mobile objects, as well as people, covering/uncovering the line of sight (LOS) between the transmitter and the receiver, thus absorbing a part of the signal power. Another cause is the presence of other signals overlapping the frequency range of the standard WLAN IEEE 802.11 [28], thus interfering with it. Actually, even the presence of different transmitters carrying the same wireless signals may create a background noise which may interfere with the final RSS value. Why we carry out this experiment Given the above mentioned problems, with this experiment we want to measure, in a university-like indoor environment, how strong and frequent the fluctuations of the RSS values are. We do this to be able, once obtained the measurements, to study the RSS variation ranges over time, the minimum and maximum values in which we could assume the variation will take place, and to look for possible patterns, like peaks or general RSS degradation/improvement in particular time of the day. Deployment As we are interested in the global wireless RSS signal fluctuations, it seems fair to assume that the same variations will affect in similar ways all kind of wireless devices. Thus, using a laptop equipped with an internal wireless network card, a workstation with a wireless antenna, or a WiFi equipped smartphone, should provide similar patterns and fluctuation ranges. We carried out the experiment from our grouproom, which is the only place where we have access to workstations that can run for a long time. We used both a laptop and a workstation, equipped with the network cards provided in Table 4.1:
34
Installed on
Brand
Network Controller
No. Antennas
Laptop
Intel
1(internal)
Workstation
D-Link
Workstation
SMC
Intel Corporation PRO/Wireless 3945ABG [Golan] Network Connection (rev 02) Texas Instruments ACX 111 54Mbps Wireless Interface Atheros Communications Inc. AR5008 Wireless Network Adapter (rev 01)
1(external) 3(external)
Table 4.1: Network Cards used to deploy the experiment
Settings and Timing Basically, we sniff all the access points (AP) in range and write down a tuple for each of them, with BSSID (which is the MAC address for an access point), RSS value, the NOISE (not all the network cards provide this information) and a timestamp. It is important to notice that we were not associated to any of the university’s wireless networks, in order not to create interferences or RSS variations due to dataload or similar causes. To gather the data, we used a Unix Bash script, split up into two main parts: a small client which permits to set the number and the frequency of the scans and the actual scanner routine, which uses the command: iwlist [interface] scan where interface is just the name of the wireless interface used (e.g. wlan0 or wlan1), plus an egrep command executing a regular expression [24] to get only the MAC address, relative RSS value in dB and noise (if available on the network card). The data were stored for further analysis in a file with a Database-compatible format like: MAC; RSS(dB) ; Noise (dB) ; Timestamp (AAAA/MM/DD−HH:MM: SS ) 0 0 : 2 3 : F8 :DA: A5: 3C; −79;90;2010/11/04 −19:09:51 0 0 : 1 5 : F2 :DF: 3 4 : 9E; −68;90;2010/11/04 −19:09:51
Concerning the amount of measured data, due to the large number of APs present in the building (around 35) and the frequency/length of the experiments (see next paragraph for details), we ended up having files containing around 20.000 tuples for each network card. Thus, we decided to create a Database to easily perform query operations and make the analysis phase easier. We chose an SQLite Database among other possibilities for one main reason: it is the standard Database used by the Android OS and it could turn out useful in case we would need some data to setup a small archive of fingerprints during the testing. Eventually, we carried out two experiments which we call Short Time Experiment and Long Time Experiment. Short Time experiment We used the workstation and the laptop in the grouproom to perform short but very frequent measurements of the signals in a couple of hours during the morning of a typical working day. This experiment was focused on understanding what could the variation range of a particular AP’s signal strength be, measuring it with different devices at the same time and in an ordinary office-day (people entering the room, using mobiles and laptops close to the receiving antennas etc.). The experiment has been carried out from 10:30 35
AM to 12:30 AM, sniffing the wireless channel every 10 seconds; all of the available network cards have been used. Long Time experiment We wanted to measure the fluctuations over a week, looking for possible patterns due to the crowding of the building in the early morning or emptying of the same in the afternoon/evening. We used only the workstation in the grouproom, equipped with two PCI network cards: the Dlink and SMC ones. We carried out measurements every 2 minutes for 8 days. Results and graphs The number of APs sniffed was quite large, sometimes more than 40, and the value of the average RSS measured over 2 hours, was often strangely equal for groups of 5-6 APs. For example, 5 different MAC addresses, supposingly bounded to 5 different APs in different rooms, were retrieving the same average power regardless their position. This lead us to discover that the wireless network in our department uses a particular infrastructure from Cisco, which has affected the experiments throughout their time. We briefly introduce the system and its characteristics below in this section. After all, we decided to analyze the data coming from the three strongest sources that we call AP1, AP2 and AP31 . This data selection has actually good reasons to stand: • in an office/university environment, it is likely that the wireless system in the building has been set up in a manner where only two or three main APs can be sniffed from a single room (this is obviously caused by the optimization of the ratio between covered area versus the number of APs needed). • the minimum RSS gap between the third average strongest received signals (measured on all the 3 network cards), and the 4th, is at least 10dB, while the average gaps between the 1st and the 2nd or the 2nd and the 3rd goes in average from 1-2dB to a max of 9dB (measured on the laptop). Thus, we are very interested in understanding their behaviour which will be probably be the same in other places in the building. We describe the obtained results in two separated paragraphs for the short and the long time experiments, but right before, we introduce the Cisco infrastructure of our university. The Cisco Wireless Control System (WCS) in our department . The WCS [16] is a centralized management system which groups all the information and activities related to a Wireless network deployed on a large scale building or campus area. The WCS system relies on Cisco proprietary hardware, in our case, the Wireless System Module (WISM) [17]; this is a controller on which can be attached hundreds of Cisco wireless switches and routers2 . The WCS actually aims to carry out an efficient Wireless network with minimum administrators intervention. It creates a self-optimizing WLAN, that means the network will automatically react to different workload situations, catch interference sources and optimize the coverage area and connection quality, operating on the endpoints APs. Among the different self-optimizing features offered by WCS, two of them have directly affected our experiment: the MAC splitting technology and the RSS automatic leveling. Both of these features are Cisco proprietary systems and, especially for the MAC splitting, it has been hard to find more information than a brief overview in the Cisco documentation. Hence, we mainly describe here the effects they have produced on the experiments. 1 2
only AP1 and AP2 have been used in the Short time Experiment in our department the Cisco Aironet lightweight access points are in use
36
• MAC splitting technology: it associates several virtual MAC addresses to one AP. That means that one could sniff several different signals (each associated with a unique MAC) with several different RSS strength, all coming from the same physical AP source. This, of course, creates confusion as it is hard to understand which signals carry a real physical MAC (a known AP in a known position) and which are just carrying a virtual MAC and could be associated to any APs in the building. • RSS leveling: this creates controlled fluctuations of the APs emitted signal power, in case of either overcrowding or high inactivity in a given spot. (e.g. the emitted power of an AP present in an auditorium might be increased/decreased in case of a lecture). Now, these two particular Cisco features apply in our department, but not in all the environments (especially the ones not covered by a Cisco system), so we did not try to dig and completely solve the matter. Instead we just used the list of the real MACs present in the building and filter them out. Later on, we also noticed that the real MACs were always associated with one particular network BSSID, which is ”AAU-1X” the main campus network. This could probably apply to all the networks covered by the Cisco WCS, but, as we could not find further information in the Cisco documentation, we cannot be sure about it. The presence of this particular system, dynamically changing the behaviour of the APs, makes it difficult to find reliable patterns and trends on the RSS sniffed values as the values are not only affected by workload and noises, but also by interventions of the WCS controller. Short Time experiment results The results of the experiment can be seen in Figure 4.1 and Figure 4.2, where the data are represented without any interpolation to catch the whole possible variations and the min and max values. The transparent stripes indicate the probable data variations around the mean value, according to the standard deviation values, explained later in Table 4.2. The first thing that can be noticed is the high fluctuation of the value received by the Intel card on the laptop compared with the two workstations. Moreover, not shown on the graphs, we have noticed that the laptop’s card was usually sniffing a larger number of different APs. This could be for two reasons: • being a laptop network card devoted to a mobile use, it could have a lower threshold concerning the minimum RSS necessary to connect to an AP; namely, to be connected is more important than having a good connection. It will try to connect to any available (and accessible) networks, despite the possible low RSS and consequent low quality. This is probably due to the fact that it could be used in places where there are few or no networks at all. • in a mobile device, to reach the aim of connecting even in low-power wireless signal situations, a very sensitive radio receiver could be used. This could lead to a noisyer listening (due to the presence of other signals) and a subsequent difficult filtering of the noise. On the other two workstation’s network cards, the Dlink and the SMC, the sniffed APs were far less (the Dlink has even an hardware limit to 16 received APs) and the values were, similarly, varying far less than on the mobile card, probably for the opposite reasons addressed for the mobile card environment.
37
Short Time experiment conclusions This discussion confirms that we have to take great care while analyzing the data provided by our application based on a smartphone: it could apply the same idea as the laptop network card concerning the wireless networking: promoting the connectivity over the quality, resulting in a more highly variable RSS. In addition to this difference among the mobile and fixed network cards, Table 4.2 shows that the value of the standard deviation is lower on the 2 workstation’s network cards compared to the one on the laptop. That means that in average the measured values will fluctuate over 5 or 6 dB around the mean value for the laptop. If the same experiment would be carried out on a smartphone, the value of the standard deviation could prove to be very useful in case there is the possibility of several (real-time) measurements of the same AP. That is because it could be used to retrieve from the measured data an estimation of the RSS mean value. Thus, we have to keep this in mind, in case we need to improve the reliability and accuracy of the Geolocation. One more problem is that, as can be seen in Figure 4.2(a), the variability of the RSS measured by the laptop, is not related to the same variations observed by the other two network cards; e.g. the RSS of the laptop in the end of the graph is going down, while the RSS of the Dlink is going up. Hence, looking at the graphs, it does not appear a clear and evident correlation in the way the different cards perceive noise or disturbances. Moreover, over the total number of measurements made in 2 hours (this number is different among the 3 cards due to the different scan speed, reasonably related to hardware parameters), the cards were sometimes not able to sniff AP1 and AP2 at all, even though they are the strongest and closest APs (see last two lines of Table 4.2). Fortunately, this phenomenon does not happen with a high probability. The probability that an AP is not sniffed at all is usually 0% but in two cases. On the Dlink card, the 34% might be explained by the fact that the card is sniffing only the 16 most powerful sources, namely, the AP1 could have been sniffed with a lower RSS compared to the other 16 APs. When the same problem occurs on the laptop, with a 14% of disappearance, we could address a similar reason, where instead of cutting the number of observed APs, a threshold is applied: an AP is not provided if the observed RSS is lower than a certain threshold. To conclude, now we know that card manufacturers deal in different ways the measuring and retrieving of RSS values, and this also applies to a smartphone’s network card. To summarize what we learnt from the Short time experiment: • The RSS observed variations depend more on the used network card than on the noise and disturbance conditions • A laptop/mobile network card seems to present a higher variance and standard deviation than workstation cards. • Even the strongest and closest AP RSS might not be retrieved in case, in the measurement, its value is particularly low (e.g. minus 20dB from the average), according to hardware specific parameters.
Long Time experiment results Table 4.3 shows the statistical results, while Figure 4.3, 7.3 and 7.4 show the variations over one week of the three strongest APs received from our room. The data observed by the two cards don’t seem to follow an homogeneous pattern. If noise sources are present, affecting at the same time all the signals present on the channel, it is not
38
(a) Intel network card (laptop)
(b) Dlink network card (workstation)
(c) SMC network card (workstation)
39 Figure 4.1: Short Time Experiment data: measurements for 2 hours on the strongest sniffed AP, AP1 with MAC 00:17:DF:2D:B2:90
(a) Intel network card (laptop)
(b) Dlink network card (workstation)
(c) SMC network card (workstation)
40 Figure 4.2: Short Time Experiment data: measurements for 2 hours on the second strongest AP, AP2 with MAC 00:1C:0E:42:D0:00
AP1 Average(dB) Variance Standard Deviation Max Variation observed (dB) No. measures / AP presence Prob. AP not sniffed (%)
AP2
Intel(L) -59,12 33,53 5,8 33
Dlink(W) -60,3 7,92 2,82 28
SMC(W) -55,96 21,59 4,65 37
Intel(L) -67,25 47,23 6,88 32
Dlink(W) -63,59 6,38 2,53 13
SMC(W) -64,9 14,32 3,79 34
700/678
700/465
684/683
700/600
700/699
684/683
0%
34%
0%
14%
0%
0%
Table 4.2: Short Time Experiment: statistical analysis over the measurements made by the three different network cards on the two strongest APs, AP1 and AP2, in two hours on a Thursday morning. The row “No. of measures / AP presence“ represents, on the left, the number of total measurements performed by the card and on the right, the number of times the AP has been detected (see the Short Time Experiment Results paragraph for more information). L=laptop and W=workstation
easy to identify them on the graphs, as the Cisco WCS might be unevenly changing the APs transmitted power to counteract an re-optimize the interferences or network loads. We were looking for patterns over this mass of measurements (more than 4400), for example, if at a certain time the RSS received from a particular station were going up or down on both network cards. Despite the possible problems created by the Cisco system, we wanted, observing the data over a whole week to be able to detect worst-case bounds. For example, knowing the maximum range of variation (in dB) of an AP over a week, it is possible to retrieve a good bound for it, in case we will use a methodology based on the RSS measurements. Moreover, some large scale pattern (over a day or just 6-8 hours) can be observed indeed: • On Saturday and Sunday the signals observe the same range of variation (5-10dB) over the whole day, for both cards and all the APs, creating a solid stripe on the graphs. Probably this is because there are almost no people in the building during these 2 days, so the dataload of the WiFi network does not change and the Cisco system does not intervene. • Every working day, from 8:00 to 18:00, the signals show clear fluctuations compared to the rest of the nightly hours. This is caused by the people’s presence in the building, moving, using the WiFi network or just gathering in a room for a lecture. • The cards don’t follow the same pattern while measuring the same signal. However they do show a similar pattern as the two described above. • The problem of the AP’s RSS not received at all is still present, in different percentages, again depending on the hardware used.
41
42 (a) Dlink AP1
(b) SMC AP1)
Figure 4.3: Long experiment: AP1
AP1 Average(dB) Variance Standard Deviation Max Variation observed (dB) No. measures / AP presence Prob. AP not sniffed (%)
AP2
AP3
Dlink(W) -60,54 21,40 4,63 36
SMC(W) -59,13 16,13 4,02 44
Dlink(W) -62,07 23,52 4,85 34
SMC(W) -63,10 13,85 3,72 38
Dlink(W) -66,72 4,57 2,14 17
SMC(W) -67,57 18,90 4,35 33
5397/4284
4597/4527
5397/3086
4597/4548
5397/5130
4597/4581
21%
2%
43%
1%
0,5%
0%
Table 4.3: Long Time Experiment: statistical analysis over the measurements made by the two different network cards on the three strongest APs, AP1, AP2 and AP3. The row “No. of measures / AP presence“ represents, on the left, the number of total measurements performed by the card and on the right, the number of times the AP has been detected. W=workstation
4.1.1
Merging the Probabilistic Analysis with the Distribution graphs information
To understand which were the most probable RSS values coming out from the measurements, we decided to graph their probability mass function; even though our data do not perfectly match any known probability distributions, in some cases they resemble to a non balanced Gaussian bell which can be seen in Figure 4.4, while, especially in the long time experiment more than one mean value is present (probably caused by the variations created by the Cisco system. See Figure 4.5), creating two or more peaks inside the bell. Connecting together the information about the standard deviation found in Table 4.2 and 4.3, and the information coming from the non balanced bell of the mass distributions, we can notice one important thing: even though the standard deviation is in average quite low for all the measurements (from 2 to 7dB) because the mass of data just moves around the mean value, we could still end up in the situation where a sniffed RSS is on the low side of the unbalanced bell. Namely, we get an RSS much smaller than the mean value (in Figure 4.5 can be seen an example of this problem: the values in the bottom of both the graphs, being very distant from the middle of the bell). Moreover, as stated in the experiments’ conclusions, we also observed a percentage of total ”disappearance” of an AP, where even the strongest APs are sometimes not retrieved at all in a measurement. This could be seen as a particular case of unbalanced bell, where the observed AP’s RSS value is so low that it is not retrieved at all. These problems have to be addressed in our application, as the risk to get RSS values very far (in negative) from the mean value, or even disappear, could heavily influence the reliability and accuracy of the location system. One possible technique to measure an RSS value as close as possible to the “real” mean value, could come from the observation that the bells created by the distributions are either quite balanced (especially in the case of the workstation’s cards), or unbalanced with the highest point of the bell being a high RSS and the rest of the bell fading away with smaller RSS (see Figure 4.4). This can lead to a technique were, given several measurements made in a short 43
time, more importance will be given to the highest ones, which should be closer to the “real” mean value of the bell. All the graphs are shown in an overview picture for both Short and Long Time experiment in the Appendix, in Figure 7.5 and 7.6, where it is easy to appreciate the similar distribution pattern followed by all the measurements.
4.1.2
Comparison with the Redpin Experiment
A similar experiment has been carried out by the earlier mentioned Redpin project (see Section 3.1.1.3). They used 5 laptops in 3 different rooms of the same building, but close enough to be able to sniff the same APs. They ran the experiment for a week sniffing measurements every minute. Their conclusion are mainly: • The RSS of an AP varies depending on the used network card • A short and a long term variation are observed • Different APs have different variances For these reasons, they came up with the Asynchronous Labeling Technique described in Section 3.1.1.3, using the accelerometer to detect the stillness or the moving of the phones and later on averaging a large number of measurements from the same location, in order to cope with these variations. This experiment can be compared to our Long Time Experiment, they have a similar frequency of the scans (1 minute versus 2 minutes in our experiment) and the same duration of one week. Concerning the Short Time Experiment, we can’t really relate to their experiment, as the frequency we used was much higher (10 seconds). We have actually performed the experiment with such a high frequency because, first of all, we noticed that the RSS values measured by two fast (5-10 seconds) consecutive scans were different, and we were also addressed of this problem by Scientific Assistant R. Hansen, which is working in our department on algorithmic strategies to improve Geolocation using Fingerprinting [26]. In the following paragraphs we show the similarities and the differences among our experiments’ conclusion and the ones from Redpin Similarities • Different network cards present different variations. • The patterns are different. From a room one could receive a pattern and from another room the pattern could be different. We experienced the same with two laptop receiving the same AP’s RSS from the same point. • High long-term variations during the morning. We noticed the same, even with the presence of the Cisco System (see Section 4.1). Differences • Their results are more stable than ours on long-term variations, because in our experiments the signals are affected by the university’s Cisco system, which rises or lowers the single AP’s signal power depending on network load and usage. • They do not talk about the AP disappearance problem, either they did not experience it, or they just did not notice it. In our case, it is important to take it into account, because, as in each room we usually sniff 2, 3 or 4 APs, one completely missing AP can make the difference while performing the Geolocation. 44
Figure 4.4: Short Time Experiment, snapshot of the mass distributions of the data measured in 2 hours from AP1, by the Laptop and the SMC network cards (around 1000 measurements). Vertical axis: scale of observed RSS values - Horizontal axis: number of time a particular RSS value has been observed.
Figure 4.5: Long Time Experiment, snapshot of the mass distributions of the data measured in one week from AP2 by the Laptop, and from AP3 by the SMC network card (around 5000 measurements). Vertical axis: scale of observed RSS values - Horizontal axis: number of time a particular RSS value has been observed.
45
• We measure short time variations even in less than a minute. • As the RSS variance heavily depends on the Network card used, it is important to make things clear about which network card is being used for measuring. It is not clear in their experiment.
4.2
The basic sniffer application on Android
Why we carry out this experiment In order to be able to implement a Geolocation application under Android, we had to know if some WiFi sniffing tools were available. In fact, we could have implemented our own sniffing tool but this would have been a long and hard work. After searching for a while the Android website, we found a WifiManager that is able to detect all the APs surrounding the device. So we decided to look for some example of this tool in order to see what information we would be able to retrieve thanks to it. The best example we found [23] was listing all the configured networks on the device. We then modified it a little in order to make it list all the available APs. Thanks to this simple example, we were able to see that it was possible to retrieve the MAC addresses, the RSS and the names of the networks, as we can see in Figure 4.6.
Figure 4.6: Screenshot of the experiment
46
Main Used Code Here are listed some snapshots of the main methods we used from the Android libraries to make the basic sniffer work. // Setup WiFi , r e t r i e v e t h e WifiManager s e r v i c e w i f i = ( WifiManager ) getSystemService ( Context . WIFI SERVICE) ; // S t a r t t h e scanning w i f i . startScan () // The scanning i s done asyncronously // We have to r e g i s t e r a r e c e i v e r to r e c e i v e t h e r e s u l t s r e g i s t e r R e c e i v e r ( r e c e i v e r , new I n t e n t F i l t e r ( WifiManager . SCAN RESULTS AVAILABLE ACTION) ) ; // R e t r i e v e t h e scan r e s u l t in a l i s t List r e s u l t s = w i f i . getScanResults ( ) ;
47
Chapter 5
Design In this chapter we show the decisions we made based on the notions presented in the previous prerequisites Chapter 3 and on the practical experience given by the experiments reported in Chapter 4. The structure of the chapter follows the same scheme as before: first, the Design choices and reasons for the Geolocation part are presented, then, in the following section, the same information are provided for the chat system.
5.1
Indoor Geo-positioning on a smartphone: Feasible approach
After the overview given on the broad topic of Geolocation, we can focus on the technologies and methodologies which could fit our scenario: Indoor Geolocation on a Smartphone.
5.1.1
Feasible Technologies
First of all, concerning the technologies, we were interested in picking only the ones widely available on modern smartphones. As of today (2010), smartphones from different manufacturers are usually equipped with GPS, WiFi, GSM and Bluetooth. That means, if we look back at Figure 3.1, we can see that all the UWB, proprietary solutions and the RF family are not attractive in our case; the remaining choices can be seen in Figure 3.3. Moreover, we have a requirement concerning indoor positioning, that means we would like to achieve a room-resolution location, preferably less than 10 meters. This choice curtails down the options to actually only one family: the WiFi technology. The GSM family, even though it overlaps the WLAN technologies in a small zone of the diagram as we can see in Figure 5.1, is discarded because it only retrieves an accuracy of 10 meters on the border of its scope; that means one would try to implement a state of the art GSM location system, integrating the most reliable methodology, just to reach the goal of the 10 meters accuracy. Thus, we will focus our attention on the WiFi network, namely on the access points antennas carrying its signals.
5.1.2
Feasible Methodologies
Of the three main methodologies outlined in Section 3.1.1.3, two are actually the real competitors: Triangulation and Scene Analysis (Fingerprinting). The third solution, the Proximity, although very simple, provides an accuracy which is surely lower than the other two. This is because, taking into account only one antenna, it will retrieve the same position for all the points in its range, and sometimes antennas are placed very far from each other, definitively more than 10 meters.
48
Figure 5.1: Overlap zone between WLAN and GSM technologies. GSM reaches a 10 meter resolution, equivalent to the WLAN, only at the border of its scope.
Triangulation versus Scene Solution (Fingerprinting) Comparing the requirements we have shown in Chapter 2 with the methodologies description provided in Section 3.1.1.3, we outline the following results: • Triangulation needs an a-priori map with the relative or absolute positions of the access points. • Fingerprinting permits to deploy the system without having a pre-specified map, though, it needs the participation of the user to train the system (see Redpin [11]). Moreover, using a Database of the fingerprints on the phone, the users can asynchronously participate in the deployment of the system (by collecting fingerprints in different locations), requiring no server and less administrator intervention. • Triangulation needs to calculate the approximate distance to an access point using the received power of the signal (which is a source of uncertainties). Fingerprinting does not; it just compares the received values with the ones in the Database. • Triangulation needs at least 3 access points (4 in case of floor detection) to be applied. Fingerprinting might still give a result (probably imprecise) with 2 access points. • The experiments we made show that the RSS values can vary in average, between plusminus 30dB on a value of 70dB, even if the device is in the same place. Retrieving a distance from these data is more difficult than just comparing these data. In both cases one needs a probabilistic model, and it seems to be a good idea to process the data as little as possible, as every mathematical or probabilistic approximation might deteriorate the possibility of getting the right location. In the Fingerprinting method there is one step less: the calculation of the distance is not done, that means one less possible cause of errors (see Table 5.1) Table 5.1 actually shows the steps needed by the two methodologies. The Triangulation will always start with getting or making a precise map of the building, providing the exact 49
position of the antennas, either in terms of GPS or just the position relative to the building size. For the Fingerprinting method, the first step concerns the creation of a Database containing several measurements (fingerprints) which will be used as a base to compare the location observed by the user. The second step is common to both: the reading of the RSS value from the surrounding APs. The third step is actually present only in the Triangulation, and it retrieves (applying probabilistic methods) the distance of the AP given its RSS. The fourth and last step is, for the first methodology, the triangulation of the position using at least three known points while for the Fingerprinting it concerns the lookup and comparison operation in the Database containing the list of fingerprints collected in the first step. • Fingerprinting could be implemented using a shared map between the devices and sharing information among them while Triangulation will usually not be in need of sharing information among the devices. This way, as in the Redpin project, the users could help during the deployment phase, requiring very few administrators’ intervention.
Phase 1
Phase 2
Phase 3
Triangulation
Map
Get RSS
Estimate Distance
Fingerprinting
Create Database
Get RSS
-
Phase 4 Triangulate Estimation against the Database
Table 5.1: Triangulation and Fingerprinting Geolocation methodologies, the general steps needed to perform a location estimation
Even though Fingerprinting has its own drawbacks, compared to Triangulation and matching our requirements, it seems to suit well our Geolocation system. Moreover, after having a meeting with a scientific assistant, Rene Hansen, who is working in our department on algorithmic strategies to improve Geolocation using Fingerprinting [26], we were able to point out some more features favoring Fingerprinting. We report them here. • On the question of why the Redpin project [11] uses an easy algorithm to calculate the closest fingerprint, while we have reviewed several different methodologies concerning probability and mathematical equations, and whether it is better to use the same approach as Redpin or to focus on the more formal and known approaches, he pointed out that in the last decade everybody was focusing on getting the best possible accuracy, hence probabilistic methodologies and mathematical approaches flourished in several studies. But sometimes this approach is not worth the effort, especially in common practical applications where an accuracy of 4 or 5 meters is still considered room-accuracy. Thus the focus moved more on the real life applications and the functionalities, which do not require a particular accuracy as far as the system accomplishes its task. Hence, it is fine to use a simple algorithm if it provides the necessary accuracy and gives good practical results. • On the matter of why the Fingerprinting methodology is being preferred to Triangulation, he pointed out that Triangulation is usually less precise than Fingerprinting, for one main reason: its exact calculation of the location relies on data which are not exact. Actually these data are estimated as distances over the RSS values received from the different APs. If there is no a line of sight (our case) these data are highly changeable, that means estimated distances themselves will be highly changeable, resulting in a highly changeable 50
final location. The Fingerprinting instead, gets the same highly changeable RSS data, but it does not retrieve a distance from them, it only compares them with the other available fingerprints in the Database. Moreover, the officer of the building will not always be able to provide the position of all the access points in the building.
5.1.3
The Design of the Fingerprinting system
Our Fingerprinting system will be composed of 4 main components. Here we introduce them one by one and then we report the use case diagram to highlight the possible user’s interactions with the system, and the sequence diagrams of the main activities, namely, the addition of a new fingerprint in the Database and the retrieving of the user’s position. Moreover, not listed as a stand-alone component (but just referenced as part of the GUI) there is the user’s intervention which plays an important role to make the system work. • Android GUI - retrieving the results and receiving user’s inputs • Sniffer - sniffes the available APs and their RSS, to get the current fingerprint. This component is very similar to the one described in the experiments section (see Section 4.2) • Fingerprinting Database - to store the fingerprints for further analysis • Algorithm - to compare current fingerprint with the Database’s entries 5.1.3.1
Android GUI and the user intervention
The simple GUI we have created shows on the mobile the options that a user have concerning the Geolocation: insert a new fingerprint and retrieve its position. As explained in the prerequisites in Section 3.1.1.3 about the Fingerprinting methodology, we need an offline and online phase. To keep these two phases as less separate as possible (in order to make the system usable right away), we use the user’s intervention to build a Fingerprinting Database. The user, in order to be able to use the system in a particular location, has to insert some fingerprints of that location in the Database. This procedure is shown by the sequence diagram in Figure 5.2. The objects that we do not describe here as main components are just objects which are supposed to help during the sequence, and are not playing an important role. At first, the user will press the button in the GUI (MainActivity) concerning the insertion of a new fingerprint. Then the application will ask him to insert a new name for the location. After having inserted the name, a scan will be started and a new fingerprint will be created in the Database, containing the name of the location plus the list of APs and relative RSS values currently sniffed. So far, in our system, we do not address any ways to check the validity and the accuracy of the data provided by the user. This could be added later on with an input checking and maybe some standardized ways to input the names of the rooms, corridors, entrances etc. The second functionality, the retrieval of the user position, is shown in Figure 5.3. The user clicks on the button “Where am I” on the GUI and a sniffing procedure will start, obtaining the currentFingerprint of the user’s location. The currentFingerprint will be given to the AlgorithmPerformer which will read all the fingerprints in the Database, compare them with the currentFingerprint (see Section 5.1.3.4 for details about the algorithm), and give back the estimated location. 5.1.3.2
Database Design Possibilities
Need For Database As we saw before, we want to store the fingerprints in the phone. There are several solutions to do so. The first one would be to write all the data into a file and search 51
Figure 5.2: Sequence diagram showing the insertion of a new fingerprint in the Geolocation application
in this file every time we need to retrieve the data. But this solution is not optimal because we would need to create complex functions and to organize the file really well in order to make sure that we do not make mistakes. Database Manager A more obvious solution is to use a Database. In fact, Database manager already included tools that facilitates the management of the data. Moreover, Android proposes the use of SQLite, which is a really easy way to use Database manager. Given that choice, we still have to decide the structure of the Database. Two possible structures of the Database: 1. The first idea we had was to use a unique Database table to store all the data. Since the number of access point can be different for each fingerprint, the data would have been stored in one cell, separated by punctuation signs in order to be able to differentiate them. 2. The second solution is to use two separated Database tables. In the first one, we would record each fingerprint with a unique ID. In the second one, we would record the data of the fingerprints, as well as the fingerprint ID which each data is associated with, in order to have a link between the fingerprints and their data. Stored Information When designing the Database, we had to think about which data we would store in it. We chose to store the current date of each fingerprint, the name of the room corresponding to it (entered by the user/recorder), and then for each sniffed access point, the MAC address and the power of the received signal. 5.1.3.3
Database Design Choice
Choice Of The Database Structure After analyzing the different solutions that we saw before, we decided to go for the second one. In fact, in the first solution, in order to retrieve the 52
Figure 5.3: Sequence diagram showing the steps needed to retrieve the user’s location
data of one fingerprint, it would have been necessary to load all of them into the RAM memory before being able to use them while the second solution allows us to make queries for particular data without having to retrieve the other ones. ID
Date
Room
0
10/10/2010
0.1.12
1
23/10/2010
1.0.1
2
29/10/2010
Cafeteria
3
11/11/2010
1.0.5
Table 5.2: Example of the Database table used to store the fingerprints
5.1.3.4
Positioning Algorithm
Here we will describe the algorithm that we will use to determine the position of the user. This algorithm has been inspired by the algorithm used in the Redpin project [11]. It compares a scan of the access points which has been performed right before, and the data of the scans stored in the Database (the fingerprints). The goal is to give points to the fingerprints in the Database to determine which one matches the best the current position of the user. The points are given by comparing the strength of the signals, and the number of sniffed access points. Here are the three main points that will compose this algorithm: • Retrieve all the fingerprints that contain identical access points
53
ID
FPID
MAC Adress
RSS
0
0
00:22:3f:c2:0f:90
-70
1
0
00:13:5e:56:0a:c0
-83
2
1
00:23:be:46:ae:30
-67
3
1
00:25:33:12:c1:50
-81
Table 5.3: Example of the Database table used to store the fingerprints’ data
• Compare the signal strength of each retrieved fingerprint for each access point. if the difference is less than 10, give 3 more points to the fingerprint. else if the difference is less than 30, give 1 more point to the fingerprint. else take 1 point back from the fingerprint. • Compare the number of access points contained in the fingerprints, and subtract a number of points from the fingerprint corresponding to the difference. Additional logic to perform the Location As discussed in Section 4.1.1 we are aware of three main problems which could influence the sniffed RSS value and the accuracy of our location system as a side effect: 1. The Cisco System which uses virtual MAC addresses and can “randomly” rise up or lower down the strength of the APs depending on several factors (see Section 4.1). 2. The measurements of RSS values very low and far from the mean value. 3. The probability of not sniffing an AP at all, even if it is one of the strongest ones (we also call this the ”disappearance” problem). For the first problem, we do not have a final solution as the information we gathered about this proprietary system are not enough. For the virtual MAC addresses we just use the list of real MAC addresses present in the building. For the “random” RSS variations, we mainly rely on the probabilistic characterization of the problem done in the experiment Chapter (see Section 4.1), particularly in the Long Time Experiment. With this experiment we manage to know the worst case of RSS variations observed during a week and try to empirically come out with a threshold which permits our algorithm to give a reasonable amount of points during the fingerprints comparison routine. We cannot know if the worst case variations created by the Cisco System might be bigger in the future (e.g. an AP’s RSS mean value is 80dB and change to 40dB at some point in the future). In that case, our system might suffer from inaccuracy problems. For the other two problems, we addressed a possible solution at the end of Section 4.1.1. Both when we insert a new value in the Database and when we retrieve the user’s position, we make three consecutive scans and get the highest RSS value observed for each sniffed AP. This way, with very high probability, we avoid to store in the Database a fingerprint in which there is one main AP missing 1 . Concerning the highest value, as shown in Figure 4.4 (especially 1
Moreover, as we usually sniff only from 2 to 5 APs, the lack of one of them could create big issues
54
concerning the Laptop results) and in the Appendix in Figure 7.5, we count on the fact that the distribution bell is not perfectly balanced, but is actually inclined with its mean toward the highest RSS values. Thus, the highest value should be the closest to the ”real” mean. This technique should give us good accuracy on the short term, but we cannot be sure to be able to overcome the problems introduced by the Cisco System over the long term. For example, as shown in Figure 7.6, during the long term the Cisco System introduces different peaks which represent several highest RSS values that an AP has had during the whole week. Of course, the choice of the highest value will not be static, we will try to implement it in a way that it could be changed at any time, maybe by getting an average instead of a maximum. A possible problem: the moving of the access points One last problem we have thought about during the Design phase is what would happen if an AP is moved or replaced. This is, of course, a situation which should not happen every day, but it can affect the accuracy of the system as the Fingerprinting Database will be inconsistent after the moving. To address some possible solutions, we directly asked by mail the Redpin project author Philipp Bolliger [11]. He said that the current (implemented) version of Redpin only marginally takes this into account. The basic idea of Redpin is to train the system while using it, hence the users will train the system over a long period of time. Should the environment change, e.g. moving APs, Redpin just creates new readings and adds these to the known fingerprint of a location. As fingerprints get bigger and bigger this way, we could think of a mechanism to automatically delete old readings, more precisely the ones that contain measurements of the ”old” APs. This, however, is not implemented in Redpin yet. Another possible solution has been given to us by Rene Hansen [26]. He said that it was a known problem and different solutions might help. One of them clusters the fingerprints in the Database and erases the whole cluster if some new measurements addressed by the same APs are found very different from the ones in the Database. Eventually, we decided not to dig into this matter as our main aim is to create a working Geolocation Prototype which could be lately refined with these solutions.
55
5.2
Chat Design
This section provides the design decisions we made for the chat part of the application. We first discuss the architecture we chose, among the two main types presented in the previous prerequisites Chapter 3. Later on in the section we explore the choice of the middlewares providing support for the chosen architecture. We will then figure out how to merge the different technologies we decided to use in order to create an efficient application.
Figure 5.4: Use case diagram of the chat system
In this use case diagram, we can notice that there are two main activities for the chat: one user (either a student or a teacher) will be able to: 1. see a list of available persons connected to the network. 2. communicate with a specific user of this network by reading and writing messages.
5.2.1
Feasible Chat middlewares
1. First of all, we use XMPP instead of other P2P middlewares because it provides specific tools to develop instant messaging applications. 2. Moreover, XMPP is very widely used. There is a lot of XMPP servers running on the Internet today. Google has based its own chat system on it. Being an open source middleware, XMPP takes advantage of the huge community that works hard to make it more and more efficient, for example by building APIs for different programming languages including all sorts of extensions available with this protocol. It should indeed receive more improvements compared to other middlewares. This community also provides help during the development process, such as ours, in the form of forum threads, etc. 3. All the currently available P2P protocols have been designed with a desktop environment in mind [21]. But we are in an embedded environment, more precisely we use phone devices so we have to use a middleware which takes care of our resources. We need thin peers considering they are phones. According to the table of [21] we have thin peers with XMPP compared to JXTA for example. We have generally speaking better performance for XMPP. 4. In XMPP, the support for real-time data streaming is good, which is only average for JXTA according to [21].
56
5. We have a good interoperability with other clients using XMPP. It is not the case for all middlewares: for example JXTA has a poor interoperability. Moreover, thanks to the help of the community, it can be improved.
5.2.2
Feasible technologies to set up P2P networks
To use properly our middleware and to be able to launch the chat system, we need a network. Because we do not want the presence of a server at all (see Chapter 2) we have to set up a network composed of peers (to create the P2P network). Each of them has the same function and will run exactly the same program. To set up this network, we have to distinguish two different cases: the first one when a peer has to create the network (because it does not exist yet) and the second one when peers join the network. The XMPP middleware could allow us to create a network from the beginning to the end but the problem is it uses an hybrid architecture (see Chapter 3) and we do not want a server in our network (even for authentication for example). So we would prefer avoiding this situation considering the disadvantages already evoked. As stated in the Chapter 3, the Link Local implementation of the Smack API respects all of our needs. We thus decided to use this modified API made by Jonas Adahl to begin our implementation.
5.2.3
Setting up the P2P chat system using XMPP and JmDNS
In this section, we will introduce the functioning of the modified API called Link Local Smack API. We will go through the different steps of the two main used technologies XMPP and JmDNS. 5.2.3.1
Setting up an XMPP chat system
To begin, here is the typical way of setting up an XMPP chat client: 1. Create an XMPP connection to the XMPP Server. 2. Authenticate to the XMPP Server. 3. (Server Side) Register the presence of the client. 4. (Server Side) Maintain a list of presences of the clients. 5.
a Engage a discussion with another client through the server. b Engage a direct link discussion with another client.
The sequence diagram shown in Figure 5.5 illustrates those points. 5.2.3.2
Setting up a JmDNS presence
Then, here is the typical way of setting up a JmDNS presence service: 1. Create a presence. 2. Listen to all the presences on the network. 3. Multicast our presence on the network. 4. Maintain a list of presences in the client. The sequence diagram shown in Figure 5.6 illustrates those points. 57
"+*&,()*-*).
!"##$%&&'()*%&
#7'6'&('=*6)'&'7
"'66+3'=*6)'&'7
$%&&'()1)%1)8'1(8+)16'7-*(' (7'+)'9:
,;)8'&)*(+)'9: /%01#+(2+3'4456'7 >9:
7');7�'6'&('=*6)9:
#7'6'&(',>>'>@"%>*A*'>@9: >*60?+.=*6)9:
7'B%-+?@+>>*&3@B%>*A*(+)*%&
$8+)C&*)*+)*%&9: +>>9:
/%01#+(2+3'4456'7
C&(%B*&3"'66+3'9: B'66+3'
>*60?+."'66+3'9:
Figure 5.5: Client Side Sequence Diagram for the setting up of a XMPP chat connection
Figure 5.6: Client Side Sequence Diagram for the setting up of a JmDNS presence discovery
58
5.2.3.3
Bypassing the XMPP server connection
Now that we do not want to have any server in the network, the goal is to bypass the 4 first steps of setting up an XMPP chat system using the first 3 steps of the JmDNS presence tool. When the presences are set up we use the step 5b of the XMPP set up to discuss with other clients: 1. Create a presence (JmDNS). 2. Listen to all the presences on the network (JmDNS). 3. Multicast our presence on the network (JmDNS). 4. Maintain a list of presences in the client (JmDNS). 5. Engage a direct link discussion with another client (XMPP). 5.2.3.4
Engage a direct link discussion with another client
When a chat is engaged between two clients, they engage an xml stream between themselves to exchange messages in close to real time [29]. The messages that are received are parsed by the client to be usable for the application. In order to engage the chat here are the steps for the engaging client: 1. Listen for Chat services on the network. 2. Create a chat with the information contained in the presence of the desired client. 3. Listen for Messages on that Chat service. 4. Exchange messages. Here are the steps for the engaged client: 1. Listen for Chat services on the network. 2. If a new chat is created listen for Messages on that chat. 3. Exchange messages. The sequence diagram 5.5 also illustrates this discussion process.
59
Chapter 6
Implementation 6.1
Geolocation Prototype
In this section we describe the prototype of the Geolocation application.
6.1.1
Introduction
When we finished designing the different properties of the Geolocation part, we decided to implement a first prototype in order to adjust the parameters and the decision algorithm. This prototype is able to record positions during an offline phase, and determines the current position of a user during the online phase. In order to debug this program and perform the scan, the easiest way would have been to use the Android emulator included in the Android SDK plug-in for Eclipse. But this emulator does not allow us to use the WiFi functionalities, and because the cell phones that we used were not made for developers, we were not able to access the files containing the results of the scans. So we decided to add to this prototype an activity that would allow us to display the scan results and to remove some records from it.
60
6.1.2
Application Class Description
Class Diagram Figure 6.1 is a class diagram of the application that allow us to visualize the structure of this application, and the relations between the different classes that compose it.
Figure 6.1: Class diagram of the Geolocation prototype
61
Main Menu class This class is the entry point of the prototype. As we can see on Figure 6.2, it allows the user to navigate through the different activities of the application thanks to a list.
Figure 6.2: Screenshot of the main menu of the application
Geopositioning (Geolocation) class This class is the one which performs the location process. It performs a scan of the available WiFi networks and uses the AlgorithmPerformer object to compare the current scan to the one stored in the Database. The result is given in a list of rooms that match the current position giving a specific rank . To each room is associated a grade that gives the probability of being the one in which the user is. For the final version of the application the user should only receive one result corresponding to the best match.
(a) Screenshot of the Geolocation activity while the application is computing the position
(b) Screenshot of the Geolocation activity when giving the results
Figure 6.3: Screenshots of the Geolocation activity
62
AddData class This class is used to add fingerprints to the Database. The user has to input a name for its current position, and click the scan button that will launch the recording process. This process is composed of scanning the available WiFi networks, and adding the results to the Database.
Figure 6.4: Screenshot of the activity that add data to the scan
WifiScanReceiver class This class is used to receive the event corresponding to the end of a WiFi network scan. In fact, since the scan is performed asynchronously, an object is needed to treat the end of it. This class is also used to parse the incoming data from the scan. In fact, the only data that are needed to perform the location are the BSSID (or MAC addresses) and the RSS. This object will then only transmit these information to the other objects. In the last implementation of the algorithm, we also decided to perform several scans in order to prevent any hardware from errors which could lead to not detecting some of the WiFi networks. This object is the one which will relaunch the scan a certain amount of times. It is also in this part of the application that the parsing of the ”real MAC addresses” is performed. In fact, we saw that the access points of the university are creating some virtual MACs that do not correspond to our APs, so we had to select only the real ones in order to avoid any issues. scanManager class This class manages all the scan functionalities. It is used to create the scan and the tables, to add, delete or retrieve data from these tables. Several functions have been implemented in order to be able to retrieve different data from different arguments. DisplayFPDB class This class has been created for debugging purposes, in order to be able to display the scan, and to delete some of the records from it. When in ”display mode”, the click on one of the items of the displayed list of fingerprints will show the associated data. When in ”deleting mode”, the click on one of these items will delete the fingerprint and all the associated data.
63
(a) Screenshot of the activity that displays the fingerprints contained in the scan, and allows to delete them
6.1.3
(b) Screenshot of the activity that displays the data of the fingerprints contained in the scan
Positioning Algorithm
This Section describes more deeply the positioning algorithm that is used to calculate the position of a user. The way of attributing points to fingerprints can be seen in Section 5.1.3.4. i n i t i a l i z e numberOfAPInScan to the number o f a c c e s s p o i n t s d etec ted by the scan i n i t i a l i z e c l o s e s t F i n g e r p r i n t to −1 i n i t i a l i z e f i n a l L i s t O f F i n g e r p r i n t s a hashtable o f p a i r s FOR each a c c e s s point dete cte d by the scan l i s t O f F i n g e r p r i n t s = a l l the f i n g e r p r i n t s from the database c o n t a i n i n g the c u r r e n t a c c e s s point FOR each f i n g e r p r i n t i n l i s t O f F i n g e r p r i n t s c l o s e s t F i n g e r p r i n t = check i f the l e v e l o f the c u r r e n t f i n g e r p r i n t i s c l o s e r than the p r e v i o u s one , i f yes , update closestFingerprint attributePointsToFingerprint ( fingerprint ) ENDOFFOR UPDATE c l o s e s t F i n g e r p r i n t i n f i n a l L i s t O f F i n g e r p r i n t with s c o r e = current score + 1 ENDOFFOR FOR each f i n g e r p r i n t i n f i n a l L i s t O f F i n g e r p r i n t s UPDATE f i n g e r p r i n t with s c o r e = c u r r e n t s c o r e − ( a b s o l u t e value o f ( number o f a c c e s s p o i n t s i n f i n g e r p r i n t − numberOfAPInScan ) ENDOFFOR
64
6.2 6.2.1
Peer-to-Peer Chat Prototype Introduction
For the implementation part of the P2P chat system, we went through several issues. In order to target the source of these issues, we implemented 3 main prototypes which are described in this section. The aim of having those prototypes is to make sure that the multicast is functional on Android phones with the Android OS and the university network as a requirement for XMPP Link Local, then to make sure that the Link Local Smack API is fully usable and finally to make sure that JmDNS works also on Android OS.
6.2.2 6.2.2.1
First Prototype: Multicast Issues on Android Phones and the University network Multicast Issues on Android Phones
When we conducted the research about the different usable tools, and chose JmDNS among them we discovered that a lot of Android developers did not manage to make a proper application due to the fact that Multicast has a lot of problems on Android. It appeared that the OS itself and for certain cases the phones refused to use Multicast. Why we implemented this prototype The main tool to use JmDNS is the Multicast, indeed all the services provided for that tool use a Multicast socket and Datagram Packages sent through that socket. It is thus very important that that functionality can be provided by the Android OS. Being a Java based OS, it is probable that thes tools are usable for Android. Since the problems were mainly encountered for old Android OS (mainly 1.0 and 1.5) we wanted to see if they remained on the newest versions of Android. Deployment This program is aimed at being really simple and only uses the basic requirements of the multicasting under Android. We based our implementation on an example program found on theInternet [5]. We decided to implement a little program aiming at sending and receiving messages through a Multicast socket between our two evaluation phones: • HTC Hero, firmware version: 2.1-update1, software version: 3.32.405.1. • HTC Wildfire, firmware version: 2.1-update1, software version: 1.25.405.1. The Multicast Lock Normally the WiFi stack filters out packets not explicitly addressed to one device. This is why Android provides a Multicast lock that allows the user to use Multicast by acquiring it as the following code shows: WifiManager w i f i = ( WifiManager ) getSystemService ( Context . WIFI SERVICE ) ; mcLock = w i f i . createMulticastLock ( ”mylock” ) ; mcLock . a c q u i r e ( ) ;
This basically counters the first issue of the Multicast not functioning by unlocking it. Then, we just initiate a TextEdit and a Button in order to get the message and send it. We use the following code in the onClickListener of the button: S t r i n g msg = e t . getText ( ) . t o S t r i n g ( ) ; s o c k e t . send (new DatagramPacket (msg . getBytes ( ) , 0 , msg . getBytes ( ) . length , InetAddress . getByName( ” 2 2 4 . 0 . 0 . 1 7 4 ” ) , 5353) ) ;
65
We send a Datagram Packet on the address 224.0.0.174, this is basically one of the address used to perform Multicast DNS. 5353 is the port. Now, for the receiver, we open a Multicast socket and join the group in which the messages will be sent as shown in the code below: [...] s o c k e t = new MulticastSocket (5353) ; s o c k e t . joinGroup ( InetAddress . getByName( ” 2 2 4 . 0 . 0 . 1 7 4 ” ) ) ; [...] new DatagramListener ( socket , tv ) . s t a r t ( ) ;
We use the address 224.0.0.174 again to send and receive the message properly and we initiate a DatagramListener (tv is the TextView for the output of the program). Here is how we receive the Datagram Packet using the socket opened before: DatagramPacket recv = new DatagramPacket ( buf , buf . l en g th ) ; s o c k e t . r e c e i v e ( recv ) ;
HTC Hero and HTC WildFire Multicast Communication We connected the two phones on the same WiFi network and ran this test application. For both of them the Multicast Lock was successfully acquired. • When we send a message with the HTC Wildfire, it receives its own message and the HTC Hero receives it too.
(c) HTC WildFire sends the message
(d) HTC Hero receives the message
Figure 6.5: Sending a message with the HTC WildFire
66
• When we send a message with the HTC Hero, it receives its own message but the HTC WildFire does not receive any message.
(a) HTC Hero sends the message
(b) HTC Wildfire does not receive the message
Figure 6.6: Sending a message with the HTC Hero
In order to know if the problem was coming from the HTC Hero or the HTC Wildfire, we ran an experiment with Wireshark, a network protocol analyzer [40]. This experiment showed us that the HTC Hero successfully sent its message, the problem thus seems to come from the HTC WildFire. After a lot of research, we managed to see that the problem comes from a file called ”wpa supplicant” in the HTC WildFire (and other phones such as the HTC Desire [35]). It is the daemon program that controls the wireless connection. For the WildFire, this wpa supplicant does not allow the reception of Multicast messages. Since JmDNS is working with services and service discovery, in order to discover services, we need Multicast questions and answers. This is why it is impossible to run JmDNS on HTC WildFire, and apparently with some similar other devices. HTC Hero and Computer Multicast Communication We connected the phone and the computer on the same WiFi network and ran this test application on the HTC Hero. We implemented also a little Java program that does exactly the same thing. • When we send a message with the computer, it receives its own message and the HTC Hero receives it too • When we send a message with the HTC Hero, it receives its own message and the computer receives it too
67
We could thus conclude that the P2P chat that we want to implement can be done on the HTC Hero using a Java application to test it. Peer-to-Peer chat for Android ? These experiments showed us that if such an application can be built, some devices will not manage to run it and it brings a problem of consistency. Indeed, this application is aimed to be used by all the students of the university whatever phone they are using. And it happens that if one of them has a ”non working” wpa supplicant he will not be able to use it. Possible solution In order to solve the problem of Multicasting there are several possibilities that could be implemented. One of them would be to use an election algorithm. The principle is to isolate two entities in the network. Election Algorithm Example: Bully Algorithm This solution is based on an election algorithm [33]. The goal is to elect a master that will have the role of coordinator of the ”working phones” entity. The election requirements are: • E1: (safety) A participant process pi has either electedi = ⊥, or electedi = p, where p is the non-crashed process having the largest process identifier. • E2: (liveness) All processes pi participate and will at some point in time set their electedi variable to a value different from ⊥ or crash. • ⊥ = undefined. One of these algorithm is called the bully algorithm, it is based on the election of a coordinator based on the process ID. Indeed when the coordinator fails, an election is initiated. This is how an election is done [37]: 1. p sends an election message to all processes with higher numbers. 2. If no one responds, p wins the election and becomes coordinator. 3. If one of the higher-ups answers, it takes over. p’s job is done. The idea is to select the process with the largest identifier as the coordinator: 1. When a process p detects that the coordinator is not responding to requests, it initiates an election: 2. If a process receives an election message from a lower numbered process at any time, it: a sends an OK message back. b holds an election (unless it is already holding one). 3. A process announces its victory by sending all processes a message telling them that it is the new coordinator. 4. If a process that has been down recovers, it holds an election. The Figure 6.7 is an example of the bully algorithm, the process 7 being the coordinator and having failed.
68
(a) Process 4 holds an election
(b) Process 5 and 6 respond, telling 4 to stop
(c) Now 5 and 6 each hold an election
(d) Process 6 tells 5 to stop
(e) Process 6 wins and tells everyone
Figure 6.7: Bully Algorithm Example
69
”Working Phones” Entity Inside this entity we will use the election algorithm (ringbased algorithm, bully algorithm, etc.) to elect a master. This master will be the central guide of all the ”non working” phones. Indeed, every peer, and so the master, possess a list of the ”non working” phones models. We can add the field ”model” in the presence of each peer for the master to retrieve it and check if it is in the list or not. If it is not, it will act normally and respond to the service discovery. On the other hand if it is, we begin the process of sending information. Based on the fact that a working peer knows about the presence of everyone in the network, the master will send, in an unicast way, the presences to the ”non working” phones. As every peer of this entity will receive the adding and the removing of the presence of a peer from the ”non working” phone entity, each and everyone of them possess the list of the ”non working” phones on the network. Thus when the master crashes, the new elected master would have all the tools to take its place. ”Non Working Phones” Entity The peers of that entity will just send their presence when they arrive on the network with their phone model and receive the information about the network from the master of the working phones entity so a user of a ”non working” phone is able to see the presence of everyone and chat with them. Connection between ”Non Working Phones” and the master Here are the different steps that should be followed by the network in order to establish a connection between the ”non working” phones and the master. • When the master is elected, it runs a TCP server in order to be able to establish a persistent connection with the ”non working” phones to send them presence modifications. • A ”non working” phone multicasts its presence to the mDNS network, and listens for a unicast response from the master. • The master detects that a ”non working” phone appeared in the network, and sends a message to it to give its network address. • The ”non working” phone receives the information from the master and establishes a TCP connection with it as a client, in order to receive all the presence modifications that could occur in the network.
70
Here is the pseudo code of the master behaviour when a presence is added in the network: List NonWorkingPhonesModels List PresencesOnTheNetwork S t r i n g MastersName List NonWorkingPhones List NonWorkingPhonesSockets When r e c e i v e P r e s e n c e ( pr ) PresencesOnTheNetwork . add ( pr ) I f myName == MastersName I f NonWorkingPhonesModels . geItemByName( pr . getModel ( ) ) != null UnicastSocket s o c k e t = new UnicastSocket ( pr . getIpAddress ( ) ) ForEach Presence p In PresencesOnTheNetwork s o c k e t . send (p) ForEach UnicastSocket us In NonWorkingPhonesSockets us . send ( pr ) NonWorkingPhonesSockets . add ( s o c k e t ) Else ForEach UnicastSocket us In NonWorkingPhonesSockets us . send ( pr ) EndIf EndIf End When
Here is the pseudo code of a peer behaviour when it has just been elected master: List NonWorkingPhonesModels List PresencesOnTheNetwork S t r i n g MastersName List NonWorkingPhones List NonWorkingPhonesSockets When iAmTheMaster ( ) NonWorkingPhonesSockets . c l e a r ( ) ForEach Presence pr In PresencesOnTheNetwork NonWorkingPhonesSockets . add (new UnicastSocket ( pr . getIpAddress ( ) ) End When
Figure 6.8(a) is a scheme of the network using the proposed solution. This solution respects the rule of not having a single point of failure. But the problem showed in the Figure 6.8(b) is that if there are only ”non working” phones on the network the communication fails. One of the solutions that we can have, shown in Figure 6.8(c) is to run a Java application on a fixed computer running in the network. This brings a single point of failure but in the only scenario where there are only ”non working” phones in the network.
71
(a) Election Algorithm Solution
(b) Election Algorithm Solution Failure Scenario, only ”non working” phones are present in the network
(c) Election Algorithm Solution Failure Scenario: possible solution, a Java application running on a machine in the ”working phones” entity
Figure 6.8: Election Algorithm Solution Scheme
72
6.2.2.2
Multicast Issues on the University Wireless Network
Why we carry out this experiment Not only does the Multicast needs to work on Android phones, it also have to work on the university network for the application to be completely usable by the students inside the university. Deployment We ran the same Multicast test Java program on two computers using the network AAU-1x. Observations We had absolutely no signs of messages received or sent on both of the applications, the universitynNetwork seems to not allow the Multicast or broadcast at all. Possible solution One of the main possible solution is to create a WiFi network like AAU-1x that allows Multicast.
6.2.3
Second Prototype: Using the Link Local Smack API
After having chosen to use Link Local XMPP using JmDNS services, we decided to implement a prototype of the P2P chat application. As we only have one phone that could handle Multicast (HTC Hero) we also used a test application in Java. We would like to thank Jonas Adahl who first implemented the Link Local Smack API based on the Smack API. He has been really helpful throughout the whole programming process. This prototype is based on the testMDNS program provided by the Link Local Smack API. 6.2.3.1
Class Description
Class Diagram The Figure 6.9 is a class diagram of the application that allows us to visualize the structure of this application, and the relations between the different classes composing it.
73
74 Figure 6.9: Class diagram of the Peer-to-Peer chat prototype
Chat Module Activity This is the main activity of the prototype, it is only aimed at launching the different activities inside the tabs of the application. Rooms and Chats Activities These classes are not implemented yet in the prototype, they exist because in the future they will be used for the Chat Rooms and the different discussions inside the Rooms as stated in the requirements. ContactsActivity class It is the main activity of the prototype, indeed it is the activity that initiates all the connections and displays the different users online, thanks to their presence. We begin by acquiring the Multicast Lock to allow us to use the Multicast. Then we retrieve the IP address of our phone that will be useful later on. We then set our name for our presence on the network and set this Link Local Presence, it can contain a lot of information such as the name, the nickname, the email address etc. Since JmDNS is a service registration and discovery protocol, we create what we call a Link Local Service that will be the core of our application using the presence. It initiates the JmDNS Daemon, creating the necessary tools provided by the library JmDNS (the Multicast socket, etc.) and running them. It also starts the presenceDiscoverer which is used to basically discover the adding and removing of the presences on the network. It also starts its own presence service. When the service is created, it is important to create Listeners in order to react whenever something happens on the network: • Service State Listener to provide tools whenever there is a changing in the state of the service. • Presence Listener to react whenever a new presence is added or removed. We use a custom Listener for the presence in order to add them in the list of contacts available. • We need to use a wrapper as we are using the service discovery, this wrapper is called Link Local Service Discovery Manager. • Chat Listener to react when there is an incoming chat or when you want to initiate a chat with a user. It uses the class LLChat (Link Local Chat) which is provided by the API and provides all the necessary tools to send and receive messages between users. We then initiate the Link Local Service Listener Daemon. Conversation Activity class This class aims at giving the Chat between two users a graphical interface. It is the direct link between the user and ContactActivity Chat Listener. 6.2.3.2
Presence issues
After having implemented the prototype we experienced many troubles with the presences. Indeed, the Android Application seemed to retrieve the presence of the Java application only once when it is launched first. After having studied the traffic with Wireshark, we discovered that the Android application did not respond to the queries sent by the Java application. After having discussed with Jonal Adahl, it seemed that the problem came from the API, not completely efficient.
75
6.2.4
Third Prototype: JmDNS Presence
As the chat was completely functional, we decided to build a second prototype using only JmDNS to implement the presences between the users. 6.2.4.1
Description class
As shown on Figure 6.11 the class diagram is fairly simple, we only have one activity ContactsActivity and another class CustomListener. The other classes are used for the graphical interface. ContactsActivity class After having created and set up the graphical interface, we initiate the JmDNS network. To do so, we create the Multicast lock and acquire it in order to be able to use Multicast. Then we create the JmDNS connection and register to our presence service. The third step is to add a service type listener and a service listener to our JmDNS connection. These listeners are implemented with the CustomListener class. CustomListener class This listener aims at adding to the friends list the name of a presence when it is Multicasted on the network and removing it from the list when its removal is multicasted on the network. It also implements a resolved listener to be able to retrieve all the information about the service. Thanks to the library JmDNS 3.2.2 this very important feature has been completely repaired. Conclusions This prototype works perfectly and we can see on Figure 6.10 that the adding and removing of the presences appear in the application.
(a) Application run on the first (b) Application phone phones
run
on
both (c) Application quit on the first phone
Figure 6.10: Screenshots of the presence prototype
76
Figure 6.11: Class diagram of the Peer-to-Peer chat presence prototype
77
Chapter 7
Conclusions We have presented a smartphone based application which provides two main features to Aalborg University: a way to easily communicate among students, teachers and employees, and a location system for them to know their position inside the campus’ buildings. Our choices to provide these two services lead us to the use of a P2P chat system for the communications and a Fingerprinting methodology based system for the Geolocation. We designed and developed the two systems separately, because the problems addressed were different and spanning over several topics, like Networking, Distributed Systems, etc. We had the opportunity to use Android OS equipped smartphones. This OS, not only does it provides the openness and free availability of its programming tools, but also is widely chosen by the smartphone users. In the following Sections we describe our conclusions for both the Geolocation System and the Communication System.
7.1
The Geolocation System
We first reviewed the five main categories of available technologies for the Geolocation, and found out that actually only two of them could fit our indoor environment: the GSM and the WiFi. The WiFi has been chosen because the maximum accuracy obtainable with the GSM is only 10 meters, and, in addition to the difficulty of achieving such a precision, it could have been barely enough to obtain a 10 meter room accuracy. The next step has been to review the Geolocation methodologies feasible over the WiFi technology. Actually, only two were a real possibility: the Fingerprinting and the Triangulation. The Fingerprinting methodology over the Wireless network has been chosen as it requires less a-priori requirements than for the Triangulation methodology. For example, the position of all the WiFi access points present in a building, the need of at least 3 access points to perform a location and the need of administrator’s intervention to deploy and set up the system are requirements affecting only the Triangulation methodology. We designed the system in 4 main parts, a GUI, a Sniffer, a Database and an Algorithm. All of them are deployed on the same phone in one application, in order to make each device stand alone, capable to run and geolocate itself without the need of any server or other mobiles. The logic of our system has, of course, taken the greatest effort. First of all, we tried to review and study all the problems which converge to create the main issue for a WiFi RSS-based Geolocation system: the access point’s signal strength variations. To do so, we made our own experiments and 2 prototypes of the application. Thanks to these, we were able to have an idea of the rapidity of these changes, their behaviour, and their average variances. Moreover, we also ran into a problem, the Cisco WCS System, actually confined to our university environment, which adds further variations to the RSS values.
78
7.1.1
The accuracy
Eventually, we made some tests to understand the overall reliability and accuracy of the system. We stored in the Database several fingerprints, measured at the ground floor and at the upper floor of our building, writing down on a map, as shown in Figure 7.1. The full map we have used is reported in the appendix in Figure 7.7.
Figure 7.1: Small snapshot of the Department’s map and the names we have given to the fingerprins measured at the ground floor (G), the same system has been used for the fingerprints at the upper (U) floor
We focused our measurements in the corridors, where the user is probably more willing to know their location than when they are inside a room. Moreover it is more difficult to differentiate two locations when they are not separated by any walls. The measurements were taken every 5 meters. Two testings have been carried out: one using only the ground floor, to simulate a building which has only one floor, and another one using the 2 floors present in the building. The results are shown in Figure and 7.2(b), where the colored dots should give a visual idea of the number of times the system has retrieved the user’s position: Green bullet: right position or within 5 meters; Orange bullet: within 10 meters; Red bullet: within 15 meters or at the wrong floor. For example, given the user’s position in location G32, if the system estimates its position as G32, we put a green dot in the table, if it estimates location G35 we put an orange dot, and a red one if the position it retrieves as best estimation is G25 (¡15 m) or U26 (wrong floor). The results we obtained show that the system is able to geolocate a person within an accuracy of 5 meters in roughly 80% of the cases, and within 10 meters in 97% of the cases, while almost no cases of accuracy within 15 meters have been observed. Some wrong floor estimations are present, in small number though, we think it might come from the fact that in our building mainly all the APs are upstairs (28) and just 6 are present at the ground floor. Making the estimation from the ground floor depends mostly on the upstairs’s APs. Of course, a much more intensive testing should be done, including a wider coverage of the building, which could lead to more uncertainties as the fingerprints Database will grow and the estimation will take into account several more fingerprints. Though, we can imagine good possibility for improvements, especially concerning the problems we have experienced. These are addressed in the future work Section 7.3.
79
(a) Accuracy of the Geolocation application considering only the ground floor, 37 user’s localization were performed. In the Database, only fingerprints from the ground floor were present
(b) Accuracy of the Geolocation application when fingerprints from both upper and ground floor are present in the Database. 45 user’s localization were performed.
Figure 7.2: Accuracy of the Geolocation System: percentage of the times the system manages to retrieve the exact user’s location (ok) and when it does it within 5, 10 or 15 meters. The colored dot represents the number of times (per each stored location) the user’s location has been found: GREEN - in the exact place (ok) or within 5 meters, ORANGE - within 10 meters, RED - within 15 meters or at the wrong floor (in both cases, out of the 10 meters requirement)
7.2
The Communication System
Based on our requirements, we had two major points that we needed to take into account for our Communication System: the fact that it is a chat system and the fact that it has to be purely P2P. We thus reviewed the existing chat technologies that could fit for our application. One of them was widely used by a lot of well known chat clients such as Google Talk, the Extensible Messaging and Presence Protocol (XMPP). The main problem about XMPP is that it is based on a hybrid P2P system. Indeed, it works with an XMPP server to authenticate and then lets the clients discuss in P2P. To bypass that authentication process, we discovered that XMPP integrates extensions. One of them called XEP-0174 is used to implement serverless XMPP messaging using a tool called multicast DNS which was fully implementable on Android based on the fact that a library called JmDNS (Java multicast DNS) was available. In order to implement such an application our attention was drawn into an API which provides all the tools in Java to use efficiently XMPP: the Smack API. Luckily a developer from the Jivesoftware community implemented a patch to this API to integrate the extension XEP-0174. Unfortunately this patched API called Link Local Smack API is not fully operational for Android phones, because of the fact that some phones do not allow the multicast, the implementation of this new API have thus been dropped. Nevertheless, we managed to implement a only presence prototype proving that the presence should be working with the API, as the P2P communication part of
80
the API works perfectly in our first implementation. To sum things up, our communication system is not fully operational for now, but all the solutions have been well thought and as shown in the future work Section 7.3, will be determinant for our application to work.
7.3 7.3.1
Future Work Geolocation
The Geolocation part of this project enabled us to be able to locate an user in a building thanks to the WiFi access points. But this work could be improved in many ways. Moving access points One of the improvements that could be implemented in the Geolocation is the correction of the problem of moving access points mentioned in Section 5.1.3.4. Using other kind of network In order to improve the accuracy of the positioning, a possible solution would be to use the GSM and Bluetooth networks and to incorporate these network in our fingerprints. In fact, the more data we have, the more precise the positioning will be. We note that this idea comes from the Redpin [11] project. Using BIM (Building Information Modeling) To improve our application, we could use BIM. This is the process of generating numeric data in order to model a building. It contains a lot of information, from the position of the walls to the composition of the ground. The part which could be interesting for us would be the modeling of the map of the building, and the position of the elevator and stairs. In fact, this could enable the generation of a map and the display the user’s position in it, and to guide the user through the building if he needs to know the path to a certain place. We are also aware that this kind of information is mandatory in Denmark for buildings bigger than a certain size.
7.3.2
Chat
Modifying the API After having discussed the issues we encountered during the experiments and implementation of the chat module with the programmer of the Link Local Smack API, we discovered that it is not working yet. The point is that the link local presences are not fully operational. Having that said and based on the fact that our implementation with JmDNS presences worked, we will be working on the modification of the API to make it operational for other users of the community. Android election algorithm As stated in our possible solutions in Chapter 6, we need to implement an election algorithm to make it work. In the future we will try to implement an election algorithm usable for P2P networks with Android OS. Based on this implementation we will be capable of making the application operational for every Android phone users.
7.3.3
Merge the Geolocation and Communication systems
As our prototypes are now distinct, we want to merge them into the application, not only as separated modules but also as evolutive tools for one another. Indeed, in order to update the Database of fingerprints of every user of the application, we will be working on XMPP extensions (XEP-0096) that provides File Sharing over XMPP in order to share the fingerprints on different phones and treat them in order to have efficiency on every phone.
81
Bibliography [1] ?, About xmpp. http://xmpp.org/about/. [2]
, Client server model - what is client server network technology. wikipedia.org/wiki/Client%E2%80%93server_model/.
[3]
, Peer-to-peer - definition. definition125.html/.
[4]
, peer-to-peer network definition from pc magazine encyclopedia (for picture napster and bittorrent). http://www.pcmag.com/encyclopedia_term/0,2542,t=peer-to-peer+ network&i=49056,00.asp/.
http://en.
http://www.bleepingcomputer.com/glossary/
[5] J. Adahl, Issue 2323: Setting interface for a multicast socket fails. http://code.google. com/p/android/issues/detail?id=2323. [6] G. Android, Locationmanager. http://developer.android.com/reference/android/ location/LocationManager.html. [7]
, Obtaining user location. http://developer.android.com/guide/topics/ location/obtaining-user-location.html, 2010.
[8] M. W.-N. K. Annemari Auvinen, Mikko Vapa and J. Vuori, Chedar: Peer-to-peer middleware acm,. [9] S. A. Baset and H. Schulzrinne, An analysis of the skype peer-to-peer internet telephony protocol, (2004), pp. 1067–1080. [10] P. A. Bernstein, Middleware: A model for distributed system services. communications of the acm,, (1996). [11] P. Bolliger, Redpin – adaptive, zero-configuration indoor localization through user collaboration, in Proceedings of the First ACM International Workshop on Mobile Entity Localization and Tracking in GPS-less Environment Computing and Communication Systems, San Francisco, USA, Sept. 2008. (Best Presentation Award). [12] P. Bolliger, K. Partridge, M. Chu, and M. Langheinrich, Improving location fingerprinting through motion detection and asynchronous interval labeling., in LoCA, T. Choudhury, A. J. Quigley, T. Strang, and K. Suginuma, eds., vol. 5561 of Lecture Notes in Computer Science, Springer, 2009, pp. 37–51. [13]
, Improving location fingerprinting through motion detection and asynchronous interval labeling, in Fourth International Symposium on Location- and Context-Awareness (LoCA 2009), 7-8 May 2009, Tokyo, Japan, A. Quigley and T. Choudhury, eds., LNCS, Berlin Heidelberg New York, 2009, Springer, Springer. 82
[14] S. Cheshire, Dns service discovery. http://www.dns-sd.org/. [15]
, Zero configuration network. http://www.zeroconf.org/.
[16] Cisco, Cisco wireless control system. http://www.cisco.com/en/US/products/ps6305/ index.html/. [17]
, Cisco wireless service module. http://www.cisco.com/en/US/prod/collateral/ modules/ps2706/ps6526/prod_qas0900aecd8036434e.html/.
[18] I. Community, Igniterealtime open source community. http://www.igniterealtime. org/. [19] T. N. Company, Google: Gsm antennas mapping. http://www.nielsen.com. [20] G. Djuknic and R. Richton, Geolocation and assisted gps, Computer, 34 (2001), pp. 123 –125. [21] J. A.-K. J. R. J. S. Erkki Harjula1, Mika Ylianttila1, Plug-and-play application platform: Towards mobile peer-to-peer, (2004). [22] T. X. S. Foundation, Available extensions for the xmpp protocol. http://xmpp.org/ extensions/. [23] M. Gargenta, Sniffer example. http://marakana.com/forums/android/examples/40. html. [24] J. Goyvaerts, Regex, Regular Expressions Tutorial. [25] J. Graf, History and trends in client-server software design. http://www.helium.com/ items/1309939-client-server-trends-xmlrpc-rpc-sockets-soap-mashup/. [26] R. Hansen, R. Wind, C. Jensen, and B. Thomsen, Algorithmic strategies for adapting 802.11 location fingerprinting to environmental changes, 2010. [27] N. Hatt, Middleware: A model for distributed system services. communications of the acm,, (1996). [28] T. W. G. f. W. S. IEEE 802.11 Wireless Local Area Networks, Wireless lan standards. http://www.ieee802.org. [29] IETF, Extensible messaging and presence protocol (xmpp): Instant messaging and presence. http://xmpp.org/rfcs/rfc3921.html#XMPP-CORE. [30] JonasAdhal, Xep 0174 (link local) support in smack). http://issues.igniterealtime. org/secure/ViewProfile.jspa?name=jadahl. [31] E. Letuchy, Erlang at facebook, Facebook, 2009. [32] H. Liu, H. Darabi, P. Banerjee, and J. Liu, Survey of wireless indoor positioning techniques and systems, IEEE Transactions on Systems, Man, and Cybernetics, Part C, 37 (2007), pp. 1067–1080. [33] B. Nielsen, Distributed mutual exclusions and elections. https://intranet.cs.aau.dk/ fileadmin/user_upload/Education/Courses/2010/DS/Slides/mutex.pdf.
83
[34] P. Saint-Andre, Xep-0174: Serverless messaging. xep-0174.html.
http://xmpp.org/extensions/
[35] P. Schauss, Issue 8407: Htc desire android 2.1-update1 does not receive udp broadcasts. http://code.google.com/p/android/issues/detail?id=8407. [36] B. Schell and C. Martin, peer-to-peer - computer dictionnary definition. http:// computer.yourdictionary.com/peer-to-peer/. [37] scribd, Bully election BULLY-ALGORITHM.
algorithm.
http://www.scribd.com/doc/6919757/
[38] A. Singh and M. Haahr, A survey of p2p middlewares, (?). [39] M. K. Stuart Cheshire, Dns-based service discovery. http://tools.ietf.org/html/ draft-cheshire-dnsext-dns-sd/. [40] R. Technology, Wireshark foundation. http://www.wireshark.org/. [41] X. website, Google: Gsm antennas mapping. http://eng.xakep.ru/link/50814/. [42] Wikipedia, Geolocalisation. http://fr.wikipedia.org/wiki/G%C3%A9olocalisation. [43]
, Multicast. http://en.wikipedia.org/wiki/Multicast.
[44] D. Wolff, What is peer-to-peer ? definition from whatis.com. searchnetworking.techtarget.com/definition/peer-to-peer/.
http://
[45] www.syngress.com, Msn messenger architecture and protocol. http://www.scribd. com/doc/6915637/Msn-Messenger-Architecture.
84
Appendix Wireless Signal Strenght variations experiment: Long time experiment graphs over AP2 and AP3 Wireless Signal Strenght variations experiment: Mass distribution of the data in the Short Time Experiment and in the Long time one over AP1, AP2 and AP3 Geolocation Testing and Accuracy: the department’s map and the names given to the fingerprints
85
86 (a) Dlink AP2
(b) SMC AP2
Figure 7.3: Long experiment: AP2
87 (a) Dlink AP3
(b) SMC AP3
Figure 7.4: Long experiment: AP3
Figure 7.5: Short Time Experiment, mass distribution of the data measured in 2 hours from AP1, AP2 and AP3 measured by the 3 network cards. On the vertical axe there is the scale of observed RSS values while the horizontal axe shows the number of time that a particular RSS value has been observed.
88
89
Figure 7.7: A part of the department’s map we have covered with the fingerprints and the names we have given them. The maps show the Groundfloor and the correspondent Upper floor. We kept the names constant, changing only the U (Upper floor) and G (Groundfloor). The “SLV300-CS-APx” are the names of the APs present at the floor; the APs present at the groundfloor are very few and not visible in this map.
90
CD-Rom Here is a CD-Rom containing the source code of our Android application.
91