Proceedings of the 9th WSEAS International Conference on TELECOMMUNICATIONS and INFORMATICS
Angur: A Visualization System for XML Documents KHALIL SHIHAB, DOREEN SIM, & AMIR MOHAMMAD SHAHI School of Engineering, Computing & Science Swinburne University of Technology (Sarawak Campus) Simpang Tiga Road, 93350 Kuching, Sarawak, MALAYSIA
[email protected];
[email protected];
[email protected]
Abstract: - Complex data structures have been used in many applications that can make them difficult to understand and manage. Visualization of these structures allows a user to get better insight both in the data structure and in the application itself. In this work, we present a visualization system, called Angur, for the structured data-oriented XML formats. We used a graphical representation that is based on tree maps. This type of visualization is usually referred to as tree rewriting. It allows efficient filtration and transformation of the document tree to fit particular user needs. In particular, our system allows the transformation of XML documents to a structure of a graphical network of objects. These visualization objects can be easily analysed, interpreted and managed without the need of dealing with their deep representations. Keywords: XML, XML documents, visualization
web design, networking, and in visual interfaces for many other domains. Yet another problem for those developing XML based database is that most users are not experts in information retrieval. The users usually asking the question may not have enough experience to format their query correctly. It is not always intuitively easy to formulate queries which can narrow the search to the precise area. Furthermore, regular users generally do not understand the search mechanisms. The document indices constructed by the current XML searching tools are designed to be general and applicable to all [1]. Although XML is good for data exchange between applications, it is often not chosen for visualization of the data because it is not very human readable. Therefore, we focused on the users and developed more intuitive ways to visualize the XML documents. In order to visualize the informative content of an XML document, the structure of data has to be carefully preserved. Therefore, we used a tree-like structure in which nodes are used to represent the children (nodes) of the XML document and links between these nodes are used to represent the relations between these nodes [5, 6]. However, we used other type of links to represent connections between arbitrary nodes in a tree. For instance, if a document has three nodes and one of the nodes has a link to one of the other nodes, a different link
1 Introduction The use of XML (eXtensible Markup Language) documents is growing rapidly, and as an important new medium for communication, it provides a tremendous amount of information related to a wide range of topics, hence continues to create new challenges for information retrieval [1]. XML documents provide users with a mean to store and deal with valuable information on a wide range of domains. This encourages researchers and companies to develop many XML-based databases that allow preserving physical document structure, support document-level transactions, and execute queries in an XML query language [2]. However, the increasing use of a large number of XML documents causes many problems to the users [3, 4]. In particular, the structure of these XML documents adds an additional problem in dealing with them. One of the problems of XML documents is the searching that can be too complex for most users. XML documents are generally not interoperable in the same search environment, because of all the different, incompatible vocabularies. XML searching requires people or software to know a lot about the structure of the documents. Moreover XML does not have any browser support and does not have anything to support the end user applications. Therefore, automatic graph drawing is a necessary solution of these problems. It has many important applications in software engineering, database and
ISSN: 1790-5117
159
ISBN: 978-954-92600-2-1
Proceedings of the 9th WSEAS International Conference on TELECOMMUNICATIONS and INFORMATICS
work that people are trying to perform by using the technology, (4) how it can be made ‘more usable’.
coloring style is used to represent this relation. Therefore, the main links is only used from the root to the children. However, if the XML document has a complex structure (nested nodes or levels); at each level, we used different shapes for the nodes to represent their number of children, see Fig. 5. In this work, we developed a system called Angur for visualization of structured data-oriented XML documents and databases. It is proposed because in many applications, complex structured data has been used and researched upon. However, fewer researches had been done on using XML visualization of these data structures or databases to allow users to get better insights both in the data structure and also in the application itself. Customizable visualization on XML databases will be done by means of nodes in a network representation. This project researches upon an efficient filtration and transformation of XML database and documents to fit particular user needs as well as a transformation to a structure with a predefined graphical nodes presentation and interpretation. A graphical arrangement of the network nodes representation rules for an interactive manipulation is presented, so the system itself can be considered a graphical language. The graphical network representation is based on the node maps.
How can visualizations relate well with HumanComputer Interaction (HCI)? If they relate well, how can visualization techniques or visual displays of information work properly to incorporate humancomputer interaction (HCI) techniques and methodologies? To achieve this, we need user visual interfaces which are user-friendly, i.e. interfaces which require very little or no training and can be used by the general public almost immediately without any prior knowledge. In addition, aesthetics (i.e. visually pleasing interfaces) plays a significant important role in consumers’ and users’ choices in using the application devices. For visualizations and HCI, in order to incorporate them to ‘work together’ to achieve the synergy affects, we consider the followings as the main features:• Mapping – How should we visually encode information through possible visual features such as length, width, speed, icon, movement, color, flicker, speed, animation and etc.? • Selection – Among the data and information on the visual interfaces, which is or are relevant to ease the considered task? • Presentation – How should we lay out the visualization on the available display interface space? • Interactivity – What tools should we provide to explore and optimize the visualization effects? • Human Factors – Are we taking into account human perception capabilities? Meanwhile, are we taking into account what mental models our users easily develop? • Evaluation – How should we testify that the visualization is really effective with users on the considered task?
2 Review and Related Work People are used to rely on visualizations to better understand problems, to receive more information and more quickly through the eyes, and to make better decisions in less time. Visual interfaces have an increasingly important role in almost all computing application domains and devices. This is a result of the consistent demand by the users to use visual interfaces in allow experts and non-expert in any domain managing complex and information-rich tasks in particular. Therefore, using visualization techniques and exploiting visual processing abilities is one of the typical successful strategies that humans use to decrease cognitive load and to simplify or ease the tasks [7, 8, and 9].
Dix et al. [11] considered that ‘human-computer interaction is about devices that seem to exhibit a kind of magic. These devices respond with complex contingencies to actions visited upon them by people. They are used to build ‘user illusions’ of reactive paper or virtual worlds or artificial personae. They are used as computational mediators and media for individual and group work. This research paper overall demonstrates how the integration of large knowledge bases of semantic information can be displayed through visualization of XML documents and databases. For the purposes of query refinement, it is useful to deal with XML documents as a graph of elements. Our system can retrieve an element’s children,
In lieu of the literature review on HumanComputer Interaction which will be elaborated later, the term ‘human-computer interaction’ can be put simply, the study of people, computer technology, the ways these influence each other and how this computer technology can be made more usable by people [10]. In other words, study of HCI requires at least the following : (1) computer technology, (2) the people who interact with it, (3) understanding the
ISSN: 1790-5117
160
ISBN: 978-954-92600-2-1
Proceedings of the 9th WSEAS International Conference on TELECOMMUNICATIONS and INFORMATICS
parent, siblings, etc., and perform different kinds of aggregation. XPath provides a simple way of expressing a path through a document tree to select a set of nodes. When a path expression is evaluated, a set of nodes relative to a context node is selected. The API for our integration framework consists of a number of core classes that allow applications to treat XML documents and databases as graphs and to evaluate XPath expressions against a document, to perform inter-document lookups and collect the relevant nodes from the XML graphs. Classes are also provided to treat the nodes as data of the appropriate type, to enable aggregation in queries. Recently a number of visualization systems has been developed and widely used. Graphviz is one of these systems, which was developed by Glen Low [12], won two 2004 Apple Design Awards. The Graphviz layout programs take descriptions of graphs in a simple text language, and make diagrams in several useful formats such as images and SVG for web pages, Postscript for inclusion in PDF or other documents; or display in an interactive graph browser. (Graphviz also supports GXL, an XML dialect.). GraphXML [13] is a graph description language in XML that can be used as an interchange format for graph drawing and visualization packages. Hydra3D is a 3-dimensional XML visualization and editing tool for UNIX variants [14]. Documents are displayed as interactive 3D tree structures. Hydra3D uses OpenGL graphic library for threedimensional display. The system is implemeted in Visual C++ .NET (version 7 or newer). Currently, Hydra only runs on Linux, other related operating systems, and Windows. The existing visualization system of XML documents, however, either do not comfirm to the good visualazation properties that are listed by Young and Munro [15] or ignore the links (relations) between different nodes from the same or different roots. Therefore, we considered these main points in the design and implementation of our system, Angur. For a list of important features of Angur see section 4.
The graphic manager part of Angur was designed to include features to aid the user in navigating the visualisation. In particular, if the XML document contains a large number of nodes, the graphic manager displays only the root of the tree. The navigation of any part (level) or the whole tree is left to the user. Therefore, the graphic manager provides the user a full control on the way he/she likes to be displayed and to work on.
• High information content The graphic manager of Angur allows the user to display the content of any node of the tree by moving and clicking the mouse on that node.
• Low visualisation complexity, well structured If an XML document has a complex structure, the graphic manager displays not only the top level of the tree but it displays only the parent nodes of that level. The manager allows the user to explode these nodes to their children nodes, i.e. using partial display of the tree; the system provides the desired information to the user.
• Resilience to change The graph manager allows changes of content of any node and provides an option to the user for saving or ignoring the changes. In case of updating and saving the resulting tree, the system maintains the integrity of the data structure of XML document.
• Good use of interaction The system provides a pull down menu of a few top level options. Each of these options contains a few low level options. Therefore, the system is designed and implemented to be user friendly and easy to use. In addition to these features, Angur is characterized by having the following important features: 1. Angur is platform independent; it is developed in Java and can be used on any platform (Windows, Linux, Mac, etc.) out of the box. Also, it can be used as a web applet to be integrated into web pages. Angur occupies less than 50 MB of system memory when running. 2. Due to the shape of the nodes, Hydra and other existing visualization system would not produce readable results when drawing large XML documents. Angur uses specific algorithms
3 The Main Features of Angur Young and Munro [15] proposed a list of desirable properties for software visualization. To properly convey these properties in a clear and concise way our visualization system is developed to have the following main features:
• Simple navigation
ISSN: 1790-5117
161
ISBN: 978-954-92600-2-1
Proceedings of the 9th WSEAS International Conference on TELECOMMUNICATIONS and INFORMATICS
3.
4.
5.
6.
As the objective of this system is visualising XML documents and databases for the purposes of understanding, we separate the visualisation task into two main parts:
which sort the nodes to be presentable to the human user. Angur allows the user generating an XML document visually, without any XML knowledge. It is technically referred to as "XML WYSWYG Editor". Angur is able to export the graph as Image and GraphML files. GraphML is a de facto standard for graph representation and this feature enables Angur to collaborate with external graph drawing libraries such as yFiles. Users are not bond to Angur's graphical features when it comes to XML visualization; they could convert their XML files to GraphML by Angur and then draw the GraphML file in their desired application. Angur is a multi graph application. Therefore, users can open and visualize multiple XML documents simultaneously and work on them individually. Angur draws the graphs in multiple layouts (Tree and Circle are currently implemented; many more layouts are possible to apply)
1. Processing part: it has a bidirectional activity; it accepts XML database or documents and generates acceptable documents to the second part, which is the Graph Manager, and vice versa. For XML databases, we used only the file structure that is produced by native-XML database. Native XML Databases store XML documents of the same type in document collections, similar to relational databases that store tuples in tables. 2. Graphic Manager: It is the interface part, it accepts the files produced by the first part, i.e. the processing part, and generate the tree-like trees. Also, it handles the modifications of these trees by the users during the execution processes. The types of information that can be handled include not just object updating, creation, and deletion but also the tree-like shape modification and rotation. In addition, it handles the actions of exploding and collapsing of any subtree of the whole tree. We use Java programming language that supported by JUNG software library for the implementation of the Angur system. JUNG (Java Universal Network/Graph Framework) provides a common and extendible language for the modeling, analysis, and visualization of data that can be represented as a graph or network. It was created by three Information and Computer Science PhD students at the University of California, Irvine: Joshua O'Madadhain, Danyel Fisher, and Scott White [16].
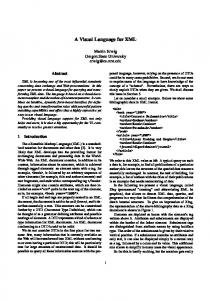
4 System Design The main components of this system are XML documents and XML database, XML processor, and Graph Manager. The XML processor, supported by XML parser (JAXP), has two functions: transforming the XML database into proper XML documents and vice versa. The Graph Manager, supported by the graph library Jung, is the interface module. It accepts an XML document and produces a tree-like structure that is displayed on the screen. The Graph Manager has also another task; it converts the tree-like documents to XML documents. Figure 1 shows the interaction of these components.
5 System Implementation The Angur system is implemented in the Java programming language and supported by JUNG software library. JUNG provides a common and extendible language for the manipulation, analysis, and visualization of data that can be represented as a graph or network. This allows our system, in particular, making use of the extensive built-in capabilities of the Java applications. Currently, the implementation of the system is divided into three main modules: Visualizing an Existing XML file, Creating a new XML data file and Saving the Graph as XML. The pseudo code of these modules as follows: Fig. 1: Angur’s system architecture.
ISSN: 1790-5117
162
ISBN: 978-954-92600-2-1
Proceedings of the 9th WSEAS International Conference on TELECOMMUNICATIONS and INFORMATICS
5.1 Visualizing an Exiting XML file
6 Visualization of XML Documents Screenshots and Workflow
1. User chooses to import the XML file and selects the file. 2. The file address on disk is sent to XML Loader (part of XML Processor). 3. XML Loader verifies the file's structure according to the standard schema. 4. If any error is found, and exception is thrown. 5. If no error, the file loads in memory as an XML Document object. 6. Document object is sent to Plotter (Part of Graph Manager). 7. Plotter reads the Document object's contents and generates the graph by creating the corresponding vertices and connecting those using edges. 8. The graph is sent to the currently active Canvas window to be inserted and shown to the user. 9. User chooses to add/remove/modify a node. 9.1 Receive required information/confirmation. 9.2 Modify the Document object accordingly. 9.3 Go to step 6
Figure 2 shows a screenshot of the main window of Angur, user has two options: 1) creating a new XML data file (composing), and 2) Visualize an existing XML data file (importing).
Fig. 2: A screenshot of the main window of Angur
5.2 Creating a new XML data file 1. User chooses to generate a new Canvas. 2. A blank Document object is created. 3. Document object is sent to Plotter (Part of Graph Manager). 4. Plotter reads the Document object's contents and generates the graph by creating the corresponding vertices and connecting those using edges. 5. User chooses to add a new node. 1.1 Receive required information/confirmation. 1.2 Modify the Document object accordingly. 1.3 Go to step 3.
By clicking the Add Node button, the "Add Node" window appears to help users create a new XML node, see Fig. 3. The same window is used to update or delete an existing node.
5.3 Saving the Graph as XML 1. User chooses to save the graph as XML. 2. The selected path and XML Document are sent to the XML Writer (Part of XML Processor). 3. XML Writer explores the Document and writes the content to a text file with .XML extension, with accordance to a standard XML schema. 4. Saving the Graph as GraphML. 5. User chooses to save the graph as GraphML. 6. The selected path and XML Document are sent to the GraphML Writer (Part of XML Processor). 7. XML Writer explores the Document and writes the content to a text file with .GML extension, with accordance to GraphML Premier.
ISSN: 1790-5117
Fig. 3: Clicking the "Add Node" button, the system displays this window allowing the user to enter the attributes (elements) along with their values.
163
ISBN: 978-954-92600-2-1
Proceedings of the 9th WSEAS International Conference on TELECOMMUNICATIONS and INFORMATICS
From the main window of the system, the user can import an XML document. Now, suppose that the following XML document is imported; the system provides an option from its main window for importing XML documents. Fig. 4 shows the treelike visualization of this document.
Fig. 4: visualization of the tree-like structured documents.
ISSN: 1790-5117
When an XML file is visualized, the Angur system allow users carrying out many actions including update, delete, relocate and reconnect a node (s) on another branch of the tree-like structure. In addition, the system allows the user to rotate the whole image. Nodes can be collapsed to improve complex graphs' readability, see Fig. 5. When a node is Collapsed, its shape will change according to the number of immediate successors it has e.g. Square if it has 4 children, Pentagon is it has 5 children, etc. Users can Collapse and Expand the nodes by right clicking on them in “Picking" mode.
Fig. 5: if a node is collapsed, the shape of this node will change according to the number of its children nodes.
164
ISBN: 978-954-92600-2-1
Proceedings of the 9th WSEAS International Conference on TELECOMMUNICATIONS and INFORMATICS
7 Conclusion The current research shows not only promising public domain data visualization software systems running on the personal computer platform but also the effectiveness and the usefulness of such systems to the users. In this paper we have described the Angur system for visualization of XML documents. The system is based on an efficient visualization method that utilizes the JUNG software library in order to improve its capabilities. To get some insights into the functionality of Angur, we showed some of its features using an XML document. Further research areas include the visualization and management of multiple XML documents. This is important to allow users visually moving a node (s) from one document to another.
[10]
[11]
[12] [13] [14]
Reference: [1] W3C. Extensible Markup Language (XML). http://www.w3.org/XML, last accessed April 2010. [2] Atay, Mustafa and Shiyong Lu, Storing and Querying XML: An Efficient Approach Using Relational Databases, ISBN 3639115813, VDM Verlag, 2009. [3] Shihab, K., Ramadhan, H. and Al-Chalabi, N. An Integrated Approach to Digital Objects Storage and Retrieval, Journal of Computer Science, 2 (9), pp. 683-689, 2006. [4] Burch, M., Diehl, S., and Weissgerber, P. Visual data mining in software archives, ACM Symposium on Software Visualization. ACM Press. 37-46, 2005. [5] Erwig, M. A Visual Language for XML, Proceedings of the 2000 IEEE International Symposium on Visual Languages (VL'00), p.47, 2000 [6] Shneiderman, B. Tree visualization with treemaps: 2-d space-filling approach, ACM Transactions on Graphics (TOG), v.11 n.1, p.92-99, Jan. 1992 [7] Pietriga E., Vion-Dury J. and Quint, V. VXT: a visual approach to XML transformations, Proceedings of the 2001 ACM Symposium on Document engineering, USA, 2001. [8] Collberg, C., Kobourov, S., Nagra, J., Pitts, J., and Wampler, A system for graph-based visualization of the evolution of software, ACM Symposium on Software Visualization, ACM Press 77-86, 212, 2003.. [9] Frishman, Y., and Tal, A. Visualization of Mobile Object Environments, ACM
ISSN: 1790-5117
[15] [16]
[17]
165
Symposium on Software Visualization, ACM Press.. 145-154, 213, 2005. Eick, S.G., Graves, T.L., Karr, A.F., Mockus, A., and Schuster, P. Visualizing software changes. IEEE Transactions on Software Engineering. 28 (4), pp. 396-412, 2002. Ronald Laurids Boring, Human-Computer Interaction as Cognitive Science, Proceedings of the Human Factors and Ergonomics Society, 46th Annual Meeting, pp. 1767-1771, 2002. Dix, A. et al, Human-computer Interaction, Prentice-Hall, 3rd ed. 2004. http://www.graphviz.org/, last accessed April 2010. Herman, I. and Marshall M. GraphXML - An XML-Based Graph Description Format, Lecture Notes In Computer Science; Vol. 1984, Proceedings of the 8th International Symposium on Graph Drawing, pp. 52-62, 2000. http://hydra3d.sourceforge.net /indexFrames. html), last accessed April 2010. Young, P., and Munro, M. Visualising software in virtual reality, IEEE First International Workshop on Visualizing Software for Understanding and Analysis, IEEE Computer Society Press, pp. 19-26, 1998. http://jung.sourceforge.net/, last accessed April 2010.
ISBN: 978-954-92600-2-1