CHI 2010: Interaction Techniques
April 10–15, 2010, Atlanta, GA, USA
Animated UI Transitions and Perception of Time – a User Study on Animated Effects on a Mobile Screen Jussi Huhtala1, Ari-Heikki Sarjanoja1, Jani Mäntyjärvi2, Minna Isomursu2, Jonna Häkkilä1 1
2
Nokia Research Center Yrttipellontie 1, 90230 Oulu, Finland
[email protected] ABSTRACT
The capability to present advanced graphics in the present mobile devices can be utilized to improve their usability and overall user experience. Mobile devices have limitations compared to PCs due to their inferior computing power and small screens, but a successful design of animated transitions can hide processing delays and make the user experience smoother. In this paper, we describe the design of animated transitions and present a user study on how they are perceived. The results show that in the transition between two images, bringing up the next image earlier dominates the perception of a fast transition over other variables examined in the study. Author Keywords
UI design, UI animations, UI transitions, user studies. ACM Classification Keywords
H5.m. Information interfaces and presentation (e.g., HCI): Miscellaneous. General Terms
Human Factors. INTRODUCTION
Mobile devices introduce special challenges for user interface (UI) designers because of their limiting physical form factor and technical performance, which is inferior to a PC. One way to overcome the challenges in UIs has been to apply multimodality, and, e.g., adding auditory cues [5] has been found to improve usability. The possibilities in graphics design have also improved with increased display resolutions and increased computing power that allows the use of more advanced graphics. In this paper, we investigate the use of animations to gain an understanding on the optimal characteristics for screen transition design.
Permission to make digital or hard copies of all or part of this work for personal or classroom use is granted without fee provided that copies are not made or distributed for profit or commercial advantage and that copies bear this notice and the full citation on the first page. To copy otherwise, or republish, to post on servers or to redistribute to lists, requires prior specific permission and/or a fee. CHI 2010, April 10–15, 2010, Atlanta, Georgia, USA. Copyright 2010 ACM 978-1-60558-929-9/10/04....$10.00.
VTT Technical Research Centre of Finland Kaitoväylä 1, 90570 Oulu, Finland
[email protected]
Animations can be used to make the application more pleasing by creating a perception of natural and smooth movements on the UI [4], as well as to improve the usability and efficiency of the user interface. Objects too large to fit to the screen as such can be presented with animations [6], and the user’s attention can also be guided as her eyes are caught by the movement [1]. Animated transitions can also be used to fill the latency times caused by data transfer or processor delay. Changing from one user interface view to another is a common stage for delays to occur. A transition animation can be used to patch the moment and the user feels time passing faster than it does, as done, e.g., with progress bars [7]. Moreover, it has been found that the acceleration of an animation makes its duration feel shorter [3]. In this paper we describe our user study on animated transitions using fading and zoom effects between two different views. The transition from one image to the next one represents a transition between two UI states that are visually completely different, e.g. browsing images or replacing a menu UI with an application UI. The paper presents our findings on user perceptions of the speed of the transitions, revealing which kind of animated effects could be used in order to gain the smoothest transition between two states of a graphical user interface (GUI). USER STUDY
In our experiment we measured how different timings of fade out and fade in of the image affect the experienced speed in a mobile image browser demo (Figure 1). The test setting consisted of emulating a mobile phone UI with flash demo running on a laptop PC. Participants were comparing two transitions and decided which of them felt faster. In the actual user test, we used 96 random images taken from Internet image services, mainly from Flickr.com. The photographic quality of the images was relatively high because we wanted to maintain the users’ attention during the test. The subjects of photos can be divided roughly into four groups: people, landscapes, animals and artificial objects. We avoided very dark images and adjusted the brightness levels and color saturation to make sure that all images had a consistent visual appearance. The photos were also cropped to fit on the 240x320 screen of the Nokia N95 mobile phone.
1339
CHI 2010: Interaction Techniques
April 10–15, 2010, Atlanta, GA, USA Equal Fade out
Fade in
Late Fade out
Fade in
Early Fade out
Fade in
Figure 2. In equal timing, the fade in and fade out had the same length. Late timing changed the image when 75 percent of the time was elapsed, and early timing at 25 percent.
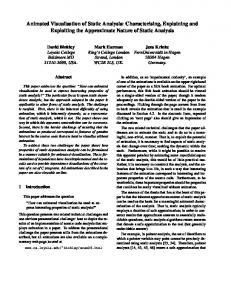
Figure 1. There were two phones on the screen of the test application. The phone on the left showed the first transition and the one on the right showed the second transition. The number code was only for moderator use.
There were three variables that were changed during the tests: •
Three different timings for changing the screen shot (equal, late and early), see Figure 2.
•
25% difference in total duration (fast vs. slow)
•
Zoom effect (with or without zoom)
In the actual study we had a total of 24 combinations of transitions to compare. Three of them contrasted different timings only, nine varied timing and total duration, and the remaining 12 compared the timing and zoom effect in the fade out section at least in one of the transitions. Unanimated transitions, such as direct switch from one GUI state to another, were not included in the comparisons. With an animated transition, the UI response is immediate in contrast to the unanimated null case. With the transition delays we used, the results would have been trivial. The earlier research on progress indicators, e.g. [3, 7] have also omitted this test setting. To reduce the effect of possible favoring of either the first or the second one, the research program randomized the order of the pairs in every comparison. Time scale changed randomly by a maximum of 20% between tasks to prevent the learning effect, so the shortest transitions were 1.4 seconds long and the longest 2.2 seconds. The average durations of slow and fast transitions were 2.0 and 1.6 seconds, respectively. The user triggered the transitions by pressing a button on the laptop. The screen turned black immediately after the transition was over. After both transitions in the pair had been shown, and the user had expressed her rating by stating it verbally to the test moderator, the user could move to the next pair by pressing a button on the laptop. The study included 26 participants, involving both people working full time (the majority) and university students. Sixteen of the participants were male and 10 female, and their age varied between 23 and 52. Sixteen of the total number had corrected vision.
Figure 3. Part of the transitions included a zoom effect in the fade-out section. ANALYSIS
Because we gathered only votes of which transition was perceived as the faster one, the data was binary. There was only one void answer in the set of 624 comparison tasks. After collecting the data, we compared transitions to each other in eight different groups. Six were comparing each timing to the other ones, and two were measuring zoom and the fast-slow difference without timing variation. Table 1 presents the statistical results of comparing the transition variables. The statistical significance was calculated by means of binomial test. The first row (marked gray), compares the perceived duration of transition (see Figure 2) when no other effect (i.e. zoom or duration) was used. In a portion of 81% (i.e 42 of the total of 52) of the cases, the Early transition was perceived as the fastest one when compared to the transition cases Equal and Late (pairs 1. and 3., see Figure 4.) Correspondingly, 31% of transition cases Late were perceived faster than the transition cases Early and Equal. Table 1 also shows the statistics of the comparison between transition timing and zoom effect. When both transitions had a zoom effect, the Early timing was again perceived as
1340
CHI 2010: Interaction Techniques
April 10–15, 2010, Atlanta, GA, USA
the faster one in 92% of the cases where it was compared to the Equal or Late transition timings. Moreover, when the zoom effect was applied to the Early timing, but not to the Equal and Late ones, the Early timing was again perceived as the fastest one (87% of the cases). The same results (87% of responds perceiving Early as the faster transition) was found with the symmetrical case, i.e. when the Early timing having no zoom effect was compared against the transitions of Equal and Late timing with zoom.
Table 1. Proportions of the favored cases. Statistically significant results are bolded (p