Hindawi Advances in Multimedia Volume 2018, Article ID 2087574, 8 pages https://doi.org/10.1155/2018/2087574
Research Article Anomaly Detection in Moving Crowds through Spatiotemporal Autoencoding and Additional Attention Biao Yang ,1 Jinmeng Cao,1 Rongrong Ni,2 and Ling Zou 1 2
1
Department of Information Science and Engineering, Changzhou University, Changzhou, Jiangsu, China Changzhou Vocational Institute Textile and Garment, Changzhou, Jiangsu, China
Correspondence should be addressed to Ling Zou;
[email protected] Received 22 April 2018; Accepted 15 August 2018; Published 3 September 2018 Academic Editor: Yong Luo Copyright © 2018 Biao Yang et al. This is an open access article distributed under the Creative Commons Attribution License, which permits unrestricted use, distribution, and reproduction in any medium, provided the original work is properly cited. We propose an anomaly detection approach by learning a generative model using deep neural network. A weighted convolutional autoencoder- (AE-) long short-term memory (LSTM) network is proposed to reconstruct raw data and perform anomaly detection based on reconstruction errors to resolve the existing challenges of anomaly detection in complicated definitions and background influence. Convolutional AEs and LSTMs are used to encode spatial and temporal variations of input frames, respectively. A weighted Euclidean loss is proposed to enable the network to concentrate on moving foregrounds, thus restraining background influence. Moving foregrounds are segmented from the input frames using robust principal component analysis decomposition. Comparisons with state-of-the-art approaches indicate the superiority of our approach in anomaly detection. Generalization of anomaly detection is improved by enforcing the network to focus on moving foregrounds.
1. Introduction Video surveillance has been recently widely applied due to highlighted safety concerns. Video surveillance generally requires human operators to watch the screens, which often leads to fatigue and inattention and failure to identify the occurrence of abnormal events. On the other hand, significant challenges arise with the substantial amount of surveillance video data, which are extremely tedious and timeconsuming for manual analysis. Considering the inefficiency and cost of traditional surveillance with humans, an automated anomaly detection system gains increasing interest from academia and industry. Early research of video anomaly detection mainly focuses on specific tasks. For example, Foroughi et al. used support vector machine for human fall detection [1], whereas Chung et al. employed a hidden Markov model (HMM) to detect abnormal behavior of patients in a nursing center [2]. However, realizing general video anomaly detection presents difficulty due to the ambiguous definition of anomaly in practical conditions. One may think that walking around on a square is normal, but others may consider it an anomaly. Thus, most researchers follow Hawkins, who defined anomaly (or
outlier) as an observation that significantly deviates from other observations to arouse a suspicion that is generated by a different mechanism [3]. Considering the imbalance between normal and abnormal patterns, one can model normal patterns in an unsupervised or semisupervised manner, and the pattern that deviates from the model is regarded as anomaly. A significant amount of effort is concentrated on feature engineering to model normal patterns. In uncrowded scenes where classic target tracking can be well achieved, high-level features, such as tracklets [4, 5], can be used for anomaly detection. However, in crowded scenes where not all targets can be accurately tracked, low-level features, such as histogram of oriented optical flow and gradients [6], social force models [7], dynamic textures model [8], and motion scale-invariant feature transform [9], which are robust for extraction, are often used to detect anomalous events in videos. A state-of-the-art approach for unsupervised modeling is a combination of sparse coding and bag-ofwords [10, 11]. However, bag-of-words is unable to preserve the spatiotemporal structure of words and requires prior information about the number of words. Given the significant success of deep learning in pattern recognition, many researchers attempt to develop a
2 generative model that encodes normal behavior through deep learning, such as deep neural network [12], autoencoders (AEs) [13–18], and generative adversarial networks (GANs) [19, 20]. Then, behavior with large reconstruction errors is considered abnormal during testing. Compared with hand-crafted feature-based anomaly detection approaches that depend on predefined heuristics, deep learning-based anomaly detection is easy to realize and generalize to different surveillance scenes. Despite the capability of deep neural network in detecting general anomaly based on a generative model, the network is easily influenced by the background. Thus, the network cannot focus on the object of interest (for example, moving crowds). Temporal variants are complicated. Thus, they cannot be easily encoded by 3D convolutional filters or one convolutional long short-term memory (convLSTM). To resolve the preceding challenges mentioned, a weighted convolutional AE–LSTM (WCAE-LSTM) network is built for anomaly detection. Our contributions are threefold. First, moving foregrounds are extracted using robust principal component analysis (RPCA) decomposition which is more robust than background subtraction. The segmented moving foregrounds will be used as a priori information in the proposed network. Second, anomaly can be detected by the proposed WCAE-LSTM network, which uses AEs to capture spatial variants and three convLSTMs to encode temporal variants. The three convLSTMs can strongly capture complicated temporal variants. However, more than three convLSTMs can no longer improve anomaly detection performance. Third, we propose a weighted Euclidean loss that can enforce the network to concentrate on moving foregrounds. Thus, the influence of irrelevant background information can be alleviated. The remainder of this paper is organized as follows. Section 2 provides a review of deep learning-based anomaly detection. Section 3 specifies the details of the proposed method. Section 4 discusses the experimental results and analysis. Section 5 presents the conclusions drawn from this work.
2. Related Work As discussed in Section 1, recent efforts in anomaly detection mainly focus on hand-crafted feature- and deep learningbased approaches. We will review several works from these perspectives. Hand-Crafted Feature-Based Approaches. Hand-crafted feature is widely used in anomaly detection. For example, social force models [7], mixtures of dynamic texture model [8], optical flow-based video descriptors [23], temporal analysis of gray-level cooccurrence matrix [24], and HMM on local spatiotemporal volumes [25] are commonly used to detect general anomalies. Despite their capability in detecting general anomalies, the low detection accuracy of these approaches makes them unsuitable for practical applications. Inspired by sparse representation and dictionary learning, Zhao et al. learned the dictionary of normal behavior through sparse representation and detected abnormal
Advances in Multimedia behavior through reconstruction errors [10]. Then, Lu et al. improved Zhao et al.’s approach by increasing the speed to 150 fps [11]. However, nothing in the dictionary was trained with abnormal events and was usually overcomplete; thus, the expectation for anomaly detection cannot be guaranteed in real-world conditions. Deep Learning-Based Approaches. Recently, deep learning has achieved significant success in object detection and video understanding. Thus, researchers attempted to detect anomalies in videos using deep learning. As a result of insufficient abnormal patterns, most researchers build a generative model of normal patterns and then detect anomalies based on the reconstruction errors of input data. AEs are commonly used to build generative models. An et al. used variational AEs for anomaly detection by evaluating reconstruction probability but not reconstruction errors [13]. Dimokranitou et al. used adversarial AEs for robust anomaly detection [14]. Raghavendra et al. used robust AEs to improve the generalization and induction of AEs in anomaly detection [15]. Hasan et al. used convolutional AEs (CAEs) on stacked spatiotemporal frames to detect anomalies and better encode temporal variations [16]. Chong et al. and Luo et al. proposed a similar architecture named LSTM based on CAEs (LSTM–CAEs); this approach can better capture temporal variants through LSTM [17, 18]. Except for AEs, GANs can also be used to build such a model. Schlegl et al. employed a GAN model for anomaly detection in medical images [19]. Ravanbakhsh et al. proposed a cross-channel prediction conditional GAN architecture to fully utilize raw image pixels and corresponding optical flows [20]. Compared with CAE-based anomaly detection approaches, the GAN-based anomaly detection approach reports large area under curve (AUC) and low equal error rate in benchmarking datasets Ped1 and Ped2. However, the preceding methods mentioned are easily influenced by backgrounds. Thus, the anomaly detection performance is unsatisfactory.
3. Proposed Method 3.1. Segmenting Moving Foregrounds. The RPCA is widely used to detect moving objects given its robustness against severe disturbances, such as dynamic background and illumination changes. The RPCA decomposition is aimed at separating the sparse foreground from the low-rank background. However, the traditional RPCA decomposition undergoes constant punishing parameters. A block-RPCA segments the input frame into different patches and then assigns each patch with a punishing parameter [26]. Foreground segmentation using the block-RPCA is formulated as follows: L,𝐹
‖L‖∗ + ∑ 𝜆 𝑖 Pi (F)1
s.t.
𝐷 = 𝐿 + 𝐹,
min
𝑖
(1)
where D represents input images, L denotes low-rank backgrounds, F indicates sparse foregrounds, ‖‖∗ represents a nuclear norm, and ‖‖1 indicates an L1 norm. Mapping matrix P𝑖 () is used to extract patches, and punishing parameter 𝜆 𝑖
Advances in Multimedia
3
(a)
(b)
(c)
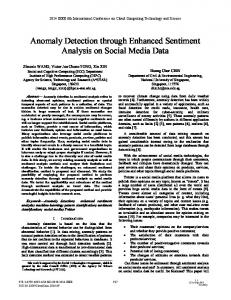
Figure 1: Segmented foregrounds using a Block-RPCA from (a) Avenue, (b) Ped1, and (c) Ped2 datasets.
indicates the motion saliency of the 𝑖th patch. The calculation of 𝜆 𝑖 can be verified in [26]. The optimization of (1) is achieved through inexact augmented Lagrange multipliers. Figure 1 illustrates several samples of segmented foregrounds from Avenue, Ped1, and Ped2 datasets. Notably, the detected foregrounds only provide the weight information to train the proposed network. Thus, few noises are allowed in the detected foregrounds. 3.2. Structure of the WCAE-LSTM Network. The LSTM has demonstrated considerable success in memorizing correlations among temporal events. Shi et al. [27] proposed the ConvLSTM by replacing the matrix multiplication in the LSTM with the convolutional operation to make the ConvLSTM suitable for processing video data. Then, temporal and spatial information can be captured by the ConvLSTM. The ConvLSTM is defined as follows: 𝑖𝑡 = 𝜎 (𝑤𝑥𝑖 ⊗ 𝑥𝑡 + 𝑤ℎ𝑖 ⊗ ℎ𝑡−1 + 𝑏𝑖 ) 𝑓𝑡 = 𝜎 (𝑤𝑥𝑓 ⊗ 𝑥𝑡 + 𝑤ℎ𝑓 ⊗ ℎ𝑡−1 + 𝑏𝑓 ) 𝑜𝑡 = 𝜎 (𝑤𝑥𝑜 ⊗ 𝑥𝑡 + 𝑤ℎ𝑜 ⊗ ℎ𝑡−1 + 𝑏𝑜 )
(2)
𝑐𝑡 = 𝑓𝑡 ⊙ 𝑐𝑡−1 + 𝑖𝑡 ⊙ tanh (𝑤𝑥𝑐 ⊗ 𝑥𝑡 + 𝑤ℎ𝑐 ⊗ ℎ𝑡−1 + 𝑏𝑐 ) ℎ𝑡 = 𝑜𝑡 ⊙ tanh (𝑐𝑡 ) , where 𝑥𝑡 and ℎ𝑡 represent the input and output of the ConvLSTM at time 𝑡; and 𝑖𝑡 , 𝑓𝑡 , and 𝑜𝑡 represent input, forget, and output gates, respectively. 𝑐𝑡 is the memory cell that stores the historical information. 𝜎 represents the sigmoid activation function. 𝑤𝑥𝑖 , 𝑤ℎ𝑖 , 𝑤𝑥𝑓 , 𝑤ℎ𝑓 , 𝑤𝑥𝑜 , 𝑤ℎ𝑜 , 𝑤𝑥𝑐 , and 𝑤ℎ𝑐 represent the weights of convolutional filters, and 𝑏𝑖 , 𝑏𝑓 ,
Figure 2: Structure of the proposed WCAE-LSTM network.
𝑏𝑜 , and 𝑏𝑐 represent the bias. ⊙ represents the element-wise multiplication, and ⊗ represents the convolutional operation. We build a WCAE-LSTM to reconstruct the input data. In Figure 2, a sequence of 𝑇 reshaped frames (225 × 225) in chronological order is fed into the WCAE-LSTM. The content of each frame is encoded by an encoder with three convolutional layers. Then, the encoded feature of each frame is fed into the ConvLSTM module, which contains three layers. The output of ConvLSTM module is used to reconstruct the input frame through a decoder, which contains three deconvolutional layers. The filter numbers of C1, C2, C3, CL1, CL2, CL3, D1, D2, and D3 are 128, 256, 512, 128, 256, 512, 256, 128, and 1, respectively. Kernel size, stride, and padding of each layer (C for Conv, CL for ConvLSTM, and D for Deconv) are displayed in detail. In contrast to the work of Luo et al. [18], we use three ConvLSTM units to capture temporal
4
Advances in Multimedia
correlations. WCAE-LSTM is also trained by minimizing the weighted Euclidean loss, which requires segmentation of moving foregrounds from the input frames through RPCA decomposition. 3.3. Weighted Euclidean Loss. A generative model tries to estimate an output that is similar to the input. Euclidean loss is often used to minimize the pixel-level differences between input and estimated output. However, the traditional generative model-based anomaly detection approaches are likely to be influenced by backgrounds. We propose a weighted Euclidean loss inspired by saliency detection. The new loss can highlight the moving foregrounds through giving more attention to foreground regions. The loss between the input frame and the corresponding reconstructed output is defined using the L2 norm, with a weight matrix 𝑊 to restrain the background influences, as shown in the following: 𝐿 = ‖(𝐸 (𝐼, 𝑂) − 𝐼) ⊙ 𝑊‖2 ,
(3)
where O is a set of network parameters, I is the input frame, E (I, O) is the reconstructed output (denoted as R), and ⊙ indicates the element-wise production. W has the same size as I, in which RPCA is used to segment foreground region from background region. Taken I as reference, pixel values of W in foreground region are set to 2, and other pixels in W are set to 1. Then, the network can put more focus on the foreground region while estimating the output during due to the large weight in this region. Background influences which are harmful to anomaly detection can be restrained due to the small weight in background region. 3.4. Regularity Score. Measuring the quality of reconstructed frame by computing mean square error between reconstructed frame and its ground truth of all pixels is favored. However, Mathieu et al. [28] argued that peak signal-to-noise ratio (PSNR) is a better choice for quality assessment; this variable is defined as follows: 𝑃𝑆𝑁𝑅 (𝐼, 𝑅) = 10 log10
𝑚𝑎𝑥𝑅 2
(1/𝑁) ∑𝑁 𝑖=0 (𝐼𝑖 − 𝑅𝑖 )
2
,
(4)
where 𝑚𝑎𝑥𝑅 refers to the maximum possible value of image intensities, and 𝑁 represents the number of pixels in the frame. High PSNR value of one frame indicates its likelihood to be normal. After calculating each frame’s PSNR in the testing video, regularity score of the 𝑘th frame can be calculated by normalizing the PSNR of all frames in the testing video to the range [0, 1]. 𝑆 (𝑘) =
𝑃𝑆𝑁𝑅 (𝐼𝑘 , 𝑅𝑘 ) − 𝑚𝑖𝑛𝑘𝑃𝑆𝑁𝑅 (𝐼𝑘 , 𝑅𝑘 ) . 𝑚𝑎𝑥𝑘 𝑃𝑆𝑁𝑅 (𝐼𝑘 , 𝑅𝑘 ) − 𝑚𝑖𝑛𝑘𝑃𝑆𝑁𝑅 (𝐼𝑘 , 𝑅𝑘 )
(5)
Then, we can predict whether a frame is normal or abnormal based on its regularity score S(k) and an experimentally defined threshold. 3.5. Implementation Details. Our approach is performed on NVIDIA GTX 1080 GPU (8G) using the Caffe framework
Table 1: Parameters used in our approach. Parameters Base Learning rate Learning policy Gamma Max iterations Momentum Weight decay Optimization Type
Value 0.0001 “fixed” 0.5 100000 0.9 0.0005 ADAGRAD
and a cuDNN library. Table 1 lists the parameters used to train our approach. We set the stride between two sampled frames in original videos to 1, 2, and 3 to perform data augmentation. Batch size is set to 16 during training due to memory limitations. Xavier [29] is used for initialization of each convolutional layer. The activation functions in the convolutional and deconvolutional layers are a rectified linear unit.
4. Experimental Results 4.1. Evaluations in the CUHK Avenue Dataset [11]. This dataset is officially split into 21 training clips and 32 testing clips, with each video clip being approximately 2 min long. The training part contains normal events like regular walking of pedestrians. The testing part contains various anomalous events, such as running, throwing objects, and walking in the wrong direction. We illustrate the pixel-level differences between the input frame (Figure 3(a)) and all reconstructed frames to understand the superiority of our approach well in anomaly detection and localization. Figure 3(a) displays an anomaly of a girl walking in the wrong direction. We use ConvLSTMAE [18] and Conv-AE [16] for comparison. The ConvLSTMAE focuses on the background. Thus, numerous activations are performed in the background regions of the pixellevel differences (Figure 3(b)). Conv-AE performs better than ConvLSTM-AE in restraining background influence. However, a certain amount of background information, such as the bag in the left bottom corner (notably, we only detect moving anomaly), remains. The pixel-level differences of our approach have the fewest background activations through making the network concentrated on the moving foregrounds. Thus, the intrusive anomaly can be detected and localized more accurately than the two other approaches. The regularity scores over frames reflect the probabilities of abnormal events. Regularity scores of Conv-AE and ConvLSTM-AE are used for comparison, as shown in Figure 4. We display two frames, wherein one contains anomalous events marked with red rectangle, and another contains only normal events. Three approaches achieve similar performances for most frames. However, our approach has lower regularity scores than Conv-AE and ConvLSTMAE around the 135th frame, in which an anomaly of wrong direction occurs. Around the 400th frame, Conv-AE and our approach are found to be superior to ConvLSTM-AE
Advances in Multimedia
5
(a)
(b)
(c)
(d)
Figure 3: Illustration of pixel-level differences in the Avenue dataset: (a) input data, (b) pixel-level differences of ConvLSTM-AE, (c) pixellevel differences of Conv-AE, and (d) pixel-level differences of our approach.
1 0.9
regularity score
0.8 0.7 0.6 0.5 0.4 0.3
Frame 400: regular walking
0.2 0.1 0
Frame 135: wrong direction
0
200
400
800 600 frame number
Conv-AE ConvLSTM-AE Our approach
1000
1200
Figure 4: Regularity scores of different approaches in the 9th video clip of Avenue dataset.
because the former present much higher regularity scores in processing normal frames. 4.2. Evaluations of UCSD Ped1 and Ped2 Datasets [22]. This dataset contains two subdatasets, namely, the Ped1 and Ped2. For Ped1, 32 video clips are available for training and 36 video clips for testing. For Ped2, 12 video clips are used for training and 16 video clips for testing. All training videos contain normal events, such as regular walking in walkways. Testing videos contain several irregular events, such as riding a bicycle, skating, and moving vehicles. Figure 5 presents the pixel-level differences between the input frame of Ped2 (Figure 5(a)) and the reconstructed frames of different approaches. Figure 5(a) displays an anomaly of a people riding the bicycle. Nearly all pixels in the foregrounds of the pixel-level differences of ConvLSTM-AE (Figure 5(b)) are activated. This result reveals that ConvLSTM-AE cannot accurately reconstruct moving targets even when they are normal. Conv-AE can reconstruct better moving targets than ConvLSTM-AE. Thus, only a few activations are observed in the pixel-level differences depicted in Figure 5(c). However, the reconstructed anomaly also contains a few activations, and the background influence is obvious. Therefore, we cannot accurately distinguish the
normal and abnormal events based on Figure 5(c). Our approach has some activations in the reconstructed normal behaviors like regular walking, but has more activations in the reconstructed abnormal behavior (people riding the bicycle) than Conv-AE (Figure 5(d)). Moreover, the background influence is significantly restrained through minimizing weighted Euclidean loss. Thus, our approach can better distinguish normal and abnormal behaviors than ConvLSTM-AE and Conv-AE. Figures 6 and 7 display the regularity scores of the three approaches in Ped1 and Ped2, respectively. In Figure 6, we illustrate two abnormal frames (38th and 147th frame) that contain anomalies of riding bicycle. Notably, our approach achieves lower regularity scores than Conv-AE and ConvLSTM-AE. Thus, these anomalies can be better detected. A similar phenomenon can be observed in Figure 7, in which our approach yields lower regularity scores than Conv-AE and ConvLSTM-AE in the 68th frame (anomaly of riding bicycle) and the 110th frame (anomaly of riding bicycle and skating). Accurate quantitative analysis is presented in the following section. 4.3. Comparisons with State-of-the-Art Approaches. To compare with the state-of-the-art anomaly detection approaches, the frame-level AUC is calculated to evaluate the performance of anomaly detection. Generally, a large AUC indicates improved anomaly detection performance. We compare our approach with several state-of-the-art anomaly detection approaches, including hand-crafted features-based approaches [21, 22] and deep learning-based approaches [16, 18]. Table 2 presents the comparison results with Avenue, Ped1, and Ped2. In this table, MPPCA [21] and MPPC + SFA [22] are inferior to deep learning-based approaches in Ped1 and Ped2, respectively. Their frame-level AUC values are much lower than those of the other approaches. Conv-AE and ConvLSTM-AE achieve much higher AUC values than MPPCA and MPPC + SFA in Ped1 and Ped2, respectively. These improvements reveal the superiority of deep learning in anomaly detection to hand-crafted features. Our approach with one ConvLSTM layer is similar to ConvLSTM-AE in the perspective of network structure. However, focusing on moving foregrounds helps the former achieve higher AUC values than the latter in all three datasets. By adding another
6
Advances in Multimedia
(a)
(b)
(c)
(d)
Figure 5: Illustration of pixel-level differences in the Ped2 dataset: (a) input data, (b) pixel-level differences of ConvLSTM-AE, (c) pixel-level differences of Conv-AE, and (d) pixel-level differences of our approach. Table 2: Comparisons with the state-of-the-art approaches in benchmarking datasets (frame-level AUC). Avenue N/A N/A 80.0% 77.0% 82.9% 85.7%
MPPCA [21] MPPC + SFA [22] Conv-AE [16] ConvLSTM-AE [18] Our approach with one ConvLSTM Our approach
Ped1 59.0% 66.8% 75.0% 75.5% 82.3% 85.1%
1
1 Conv-AE ConvLSTM-AE Our approach
0.9
0.8
0.7 0.6 0.5
Conv-AE ConvLSTM-AE Our approach
0.9
regularity score
regularity score
0.8
Frame 38:riding bicycle
0.4 0.3 0.2
0.7 0.6 0.5 Frame 110: riding bicycle And skating
0.4 0.3 0.2
0.1 0
Ped2 69.3% 61.3% 85.0% 88.1% 89.3% 92.6%
0.1
Frame 147:riding bicycle
0
20
40
60
80
100
120
140
160
180
frame number
0
Frame 68: riding bicycle
0
20
40
60
80 100 frame number
120
140
160
Figure 6: Regularity scores of different approaches in the 6th video clip of Avenue dataset.
Figure 7: Regularity scores of different approaches in the 8th video clip of Avenue dataset.
two ConvLSTM layers, our approach further achieves the best performance among all approaches used for comparison. However, no evident improvement can be observed through the addition of more than three ConvLSTM layers.
the generalization between our approach and two stateof-the-art approaches, namely, the ConvLSTM-AE and the Conv-AE, using a frame-level AUC. Table 3 summarizes the results of a cross-dataset anomaly detection of two approaches. Our approach is clearly superior to ConvLSTMAE in the cross-dataset anomaly detection. For example, the AUC values of ConvLSTM-AE are 23.6% and 19.2% when detecting an anomaly in Ped1 and Ped2 using the model trained in Avenue. However, our approach achieves high AUC values (80.3% and 84.4%) while performing the same task. Moreover, our approach achieves higher AUC values when performing the cross-dataset anomaly detection between Ped1 and Ped2. We deduce that the differences in the
4.4. Evaluation of Generalization. A generalization of the anomaly detection approach is a key issue for practical applications. We test our approach in the transfer learning setting by selecting one of the three datasets (Avenue, Ped1, and Ped2) as the source domain and using the remaining two datasets as the target domain. In particular, the model trained in the source domain is used to detect anomalous events in the target domain. Furthermore, we compare
Advances in Multimedia
7 Table 3: Performance of the different approaches across datasets (frame-level AUC).
Source dataset Target dataset Conv-AE ConvLSTM-AE Our approach
Avenue Ped1 19.8% 23.6% 80.3%
Ped1 Ped2 15.6% 19.2% 84.4%
cross-dataset anomaly detection are caused by the background and shooting angles, which may change sharply among different scenes. Thus, ConvLSTM-AE is likely to inaccurately decide while performing the cross-dataset anomaly detection because it focuses more on the background than on the moving foreground. However, our approach concentrates on the moving foreground, which shares many general characters in different scenes. In addition, the generalization of Conv-AE is even worse than that of ConvLSTM-AE. We guess the reason is that no special strategy is used in Conv-AE to process temporal information. Conv-AE just processes a batch of consecutive frames, while ConvLSTM-AE employs a long short-term memory strategy to extract temporal correlations between consecutive frames.
5. Conclusion An anomaly detection approach based on a generative model is proposed in this work. We build a WCAE-LSTM network to reconstruct an input frame sequence, and the reconstruction error between input and reconstructed frame is used for anomaly detection. Specifically, spatial variations of each frame are encoded using CAE, and temporal variations of the sequence are encoded with a three-layer Conv-LSTM. We train the network by minimizing a weighted Euclidean loss with the aid of moving foregrounds segmented from the input sequence through RPCA decomposition. The pixel-level differences in benchmarking datasets reveal that providing large weights to moving foregrounds can effectively enforce the network to concentrate on foregrounds and exclude background influence. Comparisons with state-of-the-art anomaly detection approaches, based on either traditional or deep learning features, indicate the superiority of our approach. We further observe that generalization of anomaly detection improves by enforcing the network to concentrate on moving foregrounds.
Data Availability UCSD dataset “Privacy Preserving Crowd Monitoring: Counting People without People Models or Tracking” [Online] is available at http://www.svcl.ucsd.edu/projects/peoplecnt. Avenue dataset, by C. Lu, J. Shi, and J. Jia, “Abnormal Event Detection at 150 FPS in MATLAB,” in ICCV, 2013, pp 2720–2727, is available at http://www.cse.cuhk.edu .hk/∼leojia/projects/detectabnormal/index.html.
Conflicts of Interest The authors declare that they have no conflicts of interest.
Avenue 17.8% 18.3% 68.2%
Ped2 Ped2 67.4% 81.2% 85.3%
Avenue 17.5% 19.5% 69.6%
Ped1 68.8% 78.5% 81.6%
Acknowledgments This work has been supported by the National Natural Science Foundation of China under Grants no. 61501060 and no. 61703381, the Natural Science Foundation of Jiangsu Province under Grant no. BK20150271, and Key Laboratory for New Technology Application of Road Conveyance of Jiangsu Province under Grant BM20082061708.
References [1] H. Foroughi, A. Rezvanian, and A. Paziraee, “Robust fall detection using human shape and multi-class support vector machine,” in Proceedings of the 6th Indian Conference on Computer Vision, Graphics and Image Processing, ICVGIP 2008, pp. 413–420, India, December 2008. [2] P. Chung and C. Liu, “A daily behavior enabled hidden Markov model for human behavior understanding,” Pattern Recognition, vol. 41, no. 5, pp. 1572–1580, 2008. [3] D. M. Hawkins, Identification of Outliers, Chapman and Hall, London, UK, 1980. [4] C. Piciarelli, C. Micheloni, and G. L. Foresti, “Trajectory-based anomalous event detection,” IEEE Transactions on Circuits and Systems for Video Technology, vol. 18, no. 11, pp. 1544–1554, 2008. [5] A. Basharat, A. Gritai, and M. Shah, “Learning object motion patterns for anomaly detection and improved object detection,” in Proceedings of the 26th IEEE Conference on Computer Vision and Pattern Recognition, CVPR, USA, June 2008. [6] R. V. Colque, C. A. Junior, and W. R. Schwartz, “Histograms of Optical Flow Orientation and Magnitude to Detect Anomalous Events in Videos,” in Proceedings of the 28th SIBGRAPI Conference on Graphics, Patterns and Images (SIBGRAPI ’15), pp. 126– 133, Salvador, Bahia, Brazil, August 2015. [7] R. Mehran, A. Oyama, and M. Shah, “Abnormal crowd behavior detection using social force model,” in Proceedings of the IEEE Conference on Computer Vision and Pattern Recognition (CVPR ’09), pp. 935–942, Miami, Fla, USA, June 2009. [8] W. Li, V. Mahadevan, and N. Vasconcelos, “Anomaly detection and localization in crowded scenes,” IEEE Transactions on Pattern Analysis and Machine Intelligence, vol. 36, no. 1, pp. 18– 32, 2014. [9] L. Xu, C. Gong, J. Yang, Q. Wu, and L. Yao, “Violent video detection based on MoSIFT feature and sparse coding,” in Proceedings of the IEEE International Conference on Acoustics, Speech, and Signal Processing, ICASSP ’14, pp. 3538–3542, Italy, May 2014. [10] B. Zhao, L. Fei-Fei, and E. P. Xing, “Online detection of unusual events in videos via dynamic sparse coding,” in Proceedings of the IEEE Conference on Computer Vision and Pattern Recognition (CVPR ’11), pp. 3313–3320, IEEE, June 2011. [11] C. Lu, J. Shi, and J. Jia, “Abnormal event detection at 150 FPS in MATLAB,” in Proceedings of the 14th IEEE International
8
[12]
[13]
[14] [15]
[16]
[17]
[18]
[19]
[20]
[21]
[22]
[23]
[24]
[25]
Advances in Multimedia Conference on Computer Vision (ICCV ’13), pp. 2720–2727, Australia, December 2013. M. Sabokrou, M. Fayyaz, M. Fathy, and R. Klette, “Deepcascade: cascading 3D deep neural networks for fast anomaly detection and localization in crowded scenes,” IEEE Transactions on Image Processing, vol. 26, no. 4, pp. 1992–2004, 2017. R. C. Aygun and A. G. Yavuz, “A stochastic data discrimination based autoencoder approach for network anomaly detection,” in Proceedings of the 25th Signal Processing and Communications Applications Conference (SIU ’17), pp. 1–4, Antalya, Turkey, May 2017. A. Dimokranitou, Adversarial Autoencoders for Anomalous Event Detection in Images, Purdue University, 2017. R. Chalapathy, A. K. Menon, and S. Chawla, “Robust, Deep and Inductive Anomaly Detection,” in Machine Learning and Knowledge Discovery in Databases, vol. 10534 of Lecture Notes in Computer Science, pp. 36–51, Springer International Publishing, Cham, 2017. M. Hasan, J. Choi, J. Neumann, A. K. Roy-Chowdhury, and L. S. Davis, “Learning temporal regularity in video sequences,” in Proceedings of the 2016 IEEE Conference on Computer Vision and Pattern Recognition, CVPR 2016, pp. 733–742, USA, July 2016. Y. S. Chong and Y. H. Tay, “Abnormal Event Detection in Videos Using Spatiotemporal Autoencoder,” in Advances in Neural Networks - ISNN 2017, vol. 10262 of Lecture Notes in Computer Science, pp. 189–196, Springer International Publishing, Cham, 2017. W. Luo, W. Liu, and S. Gao, “Remembering history with convolutional LSTM for anomaly detection,” in Proceedings of the 2017 IEEE International Conference on Multimedia and Expo, ICME 2017, pp. 439–444, Hong Kong, July 2017. T. Schlegl, P. Seeb¨ock, S. M. Waldstein, U. Schmidt-Erfurth, and G. Langs, “Unsupervised Anomaly Detection with Generative Adversarial Networks to Guide Marker Discovery,” in Information Processing in Medical Imaging, vol. 10265 of Lecture Notes in Computer Science, pp. 146–157, Springer International Publishing, Cham, 2017. M. Ravanbakhsh, E. Sangineto, M. Nabi et al., “Training Adversarial Discriminators for Cross-channel Abnormal Event Detection in Crowds,” https://arxiv.org/abs/1706.07680. J. Kim and K. Grauman, “Observe locally, infer globally: a spacetime MRF for detecting abnormal activities with incremental updates,” in Proceedings of the IEEE Computer Society Conference on Computer Vision and Pattern Recognition Workshops (CVPR ’09), pp. 2921–2928, Miami, Fla, USA, June 2009. V. Mahadevan, W. Li, V. Bhalodia, and N. Vasconcelos, “Anomaly detection in crowded scenes,” in Proceedings of the IEEE Conference on Computer Vision and Pattern Recognition (CVPR ’10), pp. 1975–1981, San Francisco, Calif, USA, June 2010. S. Wang, E. Zhu, J. Yin, and F. Porikli, “Video anomaly detection and localization by local motion based joint video representation and OCELM,” Neurocomputing, 2017. K. Lloyd, P. L. Rosin, D. Marshall, and S. C. Moore, “Detecting violent and abnormal crowd activity using temporal analysis of grey level co-occurrence matrix (GLCM)-based texture measures,” Machine Vision and Applications, vol. 28, no. 3-4, pp. 361–371, 2017. L. Kratz and K. Nishino, “Anomaly detection in extremely crowded scenes using spatio-temporal motion pattern models,” in Proceedings of the IEEE Computer Society Conference on Computer Vision and Pattern Recognition Workshops (CVPR ’2009), pp. 1446–1453, Miami, Fla, USA, June 2009.
[26] B. Yang and L. Zou, “Robust foreground detection using blockbased RPCA,” Optik - International Journal for Light and Electron Optics, vol. 126, no. 23, pp. 4586–4590, 2015. [27] X. Shi, Z. Chen, H. Wang, D.-Y. Yeung, W.-K. Wong, and W.C. Woo, “Convolutional LSTM network: A machine learning approach for precipitation nowcasting,” in Proceedings of the 29th Annual Conference on Neural Information Processing Systems, NIPS 2015, pp. 802–810, Canada, December 2015. [28] M. Mathieu, C. Couprie, and Y. LeCun, “Deep multi-scale video prediction beyond mean square error,” https://arxiv.org/abs/ 1511.05440v6. [29] X. Glorot and Y. Bengio, “Understanding the difficulty of training deep feedforward neural networks,” in Proceedings of the thirteenth international conference on artificial intelligence and statistics, pp. 249–256, 2010.
International Journal of
Advances in
Rotating Machinery
Engineering Journal of
Hindawi www.hindawi.com
Volume 2018
The Scientific World Journal Hindawi Publishing Corporation http://www.hindawi.com www.hindawi.com
Volume 2018 2013
Multimedia
Journal of
Sensors Hindawi www.hindawi.com
Volume 2018
Hindawi www.hindawi.com
Volume 2018
Hindawi www.hindawi.com
Volume 2018
Journal of
Control Science and Engineering
Advances in
Civil Engineering Hindawi www.hindawi.com
Hindawi www.hindawi.com
Volume 2018
Volume 2018
Submit your manuscripts at www.hindawi.com Journal of
Journal of
Electrical and Computer Engineering
Robotics Hindawi www.hindawi.com
Hindawi www.hindawi.com
Volume 2018
Volume 2018
VLSI Design Advances in OptoElectronics International Journal of
Navigation and Observation Hindawi www.hindawi.com
Volume 2018
Hindawi www.hindawi.com
Hindawi www.hindawi.com
Chemical Engineering Hindawi www.hindawi.com
Volume 2018
Volume 2018
Active and Passive Electronic Components
Antennas and Propagation Hindawi www.hindawi.com
Aerospace Engineering
Hindawi www.hindawi.com
Volume 2018
Hindawi www.hindawi.com
Volume 2018
Volume 2018
International Journal of
International Journal of
International Journal of
Modelling & Simulation in Engineering
Volume 2018
Hindawi www.hindawi.com
Volume 2018
Shock and Vibration Hindawi www.hindawi.com
Volume 2018
Advances in
Acoustics and Vibration Hindawi www.hindawi.com
Volume 2018