its associated list question is:âWhich airlines use Dulles?â; ... TIMES. (web). Continental Airlines sued United Airlines and the committee that oversees operations.
Answering List Questions using Co-occurrence and Clustering Majid Razmara and Leila Kosseim CLaC Laboratory Department of Computer Science and Software Engineering Concordia University 1455 de Maisonneuve Blvd. West Montr´eal, Qu´ebec, Canada, H3G 1M8 {m razma; kosseim} @cse.concordia.ca Abstract Although answering list questions is not a new research area, answering them automatically still remains a challenge. The median F-score of systems that participated in TREC 2007 Question Answering track is still very low (0.085) while 74% of the questions had a median F-score of 0. In this paper, we propose a novel approach to answering list questions. This approach is based on the hypothesis that answer instances of a list question co-occur in the documents and sentences related to the topic of the question. We use a clustering method to group the candidate answers that co-occur more often. To pinpoint the right cluster, we use the target and the question keywords as spies to return the cluster that contains these keywords.
1.
Introduction
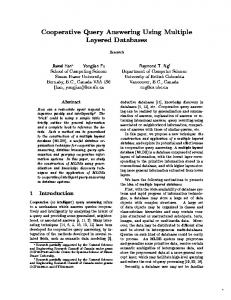
List questions at the TREC Question Answering track was initiated in 2001. This type of question requires a list of correct instances of answer to be extracted from multiple documents. List questions are organized into series of questions, each of which has a topic called the “target”. The questions in TREC QA, which constitute our training and testing sets, are to be coupled with supporting documents from the corpus (AQUAINT-2 and B LOG -061 ). For example, one of the targets at the TREC QA -2007 is “Dulles Airport”, and its associated list question is:“Which airlines use Dulles?”; twenty airlines are found in the corpora to be instances of the answer to this question. These answers were extracted from 37 different documents in the corpora. Different instances of an answer to a list question have a special relation to one another. Beside the fact that they are all of the same entity class (e.g. country names, people, book titles, . . . ), they either co-occur within sentences, or occur in different sentences having lexical similarities or occur in different sentences that are partially or totally semantically equivalent. The latter case requires a system to deal with the difficulties of semantic analysis. For example, (Ahn et al., 2005) uses lexical similarities among sentences to expand the initial candidate lists. It actually exploits the idea that sentences containing answer instances share similar words. We hypothesized that the answer instances to a list question co-occur within the sentences of the documents related to the target and the question. In addition, the instances of answers also tend to occur with the target and question keywords. Figure 1 shows a few sample snippets from AQUAINT-2, the TREC corpus, and from the web related to question 232.6 Which airlines use Dulles? (Target: Dulles Airport). As 1
http://ir.dcs.gla.ac.uk/test_ collections/blog06info.html
the figure shows, the snippets contain a few instances of answers along with the target and question keywords. Our approach is able to select the most likely candidate answers, having an initial list of potential answers, while exploiting only statistical techniques. The approach is focused more on pinpointing and re-ranking answer instances from an initial pool of candidates, as opposed to extracting the initial candidates. Our main focus in not on issues such as answer extraction, information retrieval etc. Supporting each answer, for instance, with a document from the corpora (i.e. answer projection), which is required at TREC QA , is not dealt with in our system.
2.
Related Work
Several approaches to answering list questions are applied. Some systems, for example (Zhou et al., 2006) and (Whittaker et al., 2006), treat list questions as an expanded version of factoid questions that requires one answer, as opposed to a list of distinct answers. These systems answer a list question by simply returning the top N answers found by the factoid question answering system. List questions are also answered by exploiting the relationships between each pair of answers and/or relationships between question terms and answers. For example, (Ahn et al., 2005) and (Kor, 2005) propose an approach that identifies the common context shared by two or more candidate answers and uses this common context to expand the candidate list. To validate and identify relevant answers from a list of extracted candidates, several approaches have been used. Some systems use WordNet, gazetteers or ontologies for this purpose ( e.g. (Moldovan et al., 2003) and (Xu et al., 2002)) while (Ko et al., 2007) uses a probabilistic graphical model. INEX 2007 2 proposed an Entity Ranking track to reduce the difficulty of answering list questions. This track con2
“INitiative for the Evaluation of XML retrieval” http:// inex.is.informatik.uni-duisburg.de/2007/
Target 232: “Dulles Airport” Source LTW 20050712.0032 TTW
20060102.0106
NYT
20050426.0151
WIKIPEDIA NEW
(web)
(web)
YORK
TIMES
Question 232.6: “Which airlines use Dulles?”
Snippet Containing Answers United, which operates a hub at Dulles . . . Delta, Northwest, American, British Airways and KLM share four screening machines in the basement. Flyi suffered from rising jet fuel costs and the aggressive response of competitors, led by United and US Airways. They matched Independence’s fares, ... from Dulles Airport to cities such as Newark. Delta recently added more than 80 flights from its Atlanta hub and capped its business fares, while money-losing Independence Air, based at Washington’s Dulles Airport, is making . . . . At its peak of 600 flights daily, Independence, combined with service from JetBlue and AirTran, briefly made Dulles the largest low-cost hub in the United States. Continental Airlines sued United Airlines and the committee that oversees operations at Washington Dulles International Airport yesterday, . . .
Figure 1: Answers tend to co-occur with one another and with the target and question keywords (acceptable answers are shown in bold face and the target and question keywords are underlined)
tains an Entity Ranking task, to return entities that satisfy a topic in natural language and also a List Completion task, to complete a partial list of answers, given a topic text and a number of examples. The List Completion task is inspired by Google Sets3 . (Ghahramani and Heller, 2005) and (Adafre et al., 2007) use several approaches based on these tasks to expand and validate the candidate list.
3.
Our Overall Approach
This section describes our approach to answering list questions. Our approach is based on Distributional Hypothesis, which states that words occurring in the same contexts tend to have similar meanings (Harris, 1954). Distributional Hypothesis is the basis of Statistical Semantics defined as the study of “how the statistical patterns of human word usage can be used to figure out what people mean, at least to a level sufficient for information access” by (Furnas, 2008). Following this view, we hypothesized that the instances of the answer to a list question tend to co-occur within the sentences of the documents related to the target and the question. In addition, the instances of answers also tend to occur with the target and the question keywords. Co-occurrence can be interpreted as an indicator of semantic similarity. Generally, terms that co-occur more frequently tend to be related. A list question is answered in the following steps: First, the answer type of the question is determined. For this purpose, each question is associated to one of the nine entity classes: P ERSON , C OUNTRY, O RGANIZATION , J OB , M OVIE , NA TIONALITY, C ITY, S TATE , OTHER . This is done by using lexical and syntagmatic patterns. Once the type of answer is predicted, a number of documents are retrieved from AQUAINT-2 and the web using a query generated from the target and the question. These documents constitute a collection from which candidate terms are extracted. All terms that conform to the answer type are extracted from this collection. Depending on the answer type, the candidate terms are extracted using an NE tagger (in case of P ER SON , O RGANIZATION and J OB ), using a gazetteer (in case 3
http://labs.google.com/sets
of C OUNTRY, NATIONALITY, S TATE and partially C ITY) and finally extracting all capitalized terms and terms in quotations and validating them using web frequency (in case of M OVIE and OTHER). A similarity value is, then, computed for each pair of candidate answers based on their co-occurrence within sentences. Having clustered the candidates and determined the most likely cluster, the final candidate answers are selected. In the next sections, we will discuss specifically how candidate answers are clustered.
4.
Co-occurrence Information Extraction
The similarity between two candidate terms is a normalized value denoting how often they co-occur within documents related to the target. For this purpose, using the query generated in the previous section, a list of relevant documents from AQUAINT-2 and the web are retrieved. This constitutes the domain collection from which sentences will be extracted to compute co-occurrence information. Once all the data regarding term co-occurrences is collected, the similarity between each pair of terms is computed. This information is used by the Clustering module to cluster terms that tend to co-occur more often. 4.1.
Co-occurrence Matrix
We use first order co-occurrence and indirectly we use second order co-occurrence through question and target keywords. Co-occurrence of two candidate terms can be computed within documents, within paragraphs or even finer co-occurrence within sentences. We use sentence-based co-occurrence since there are more instances to extract cooccurrence information from and hence the similarity will be more reliable. The documents in the domain collection are split into sentences. These sentences are checked as to whether they include one or more candidate terms. The information regarding the appearance and co-occurrence of the candidate terms are stored in a 3-D co-occurrence matrix: sentencecandidate-candidate. Figure 2 illustrates an example of a co-occurrence matrix with four candidate terms and three
to group closely related terms. Candidates in the most appropriate cluster are returned as the final candidates.
5.1.
Clustering
Clustering is the unsupervised classification of data points into groups (clusters) of similar objects. In fact, by clustering the data into groups, we try to model the data. Although modeling the data by fewer clusters loses certain fine details, it brings simplification. Since there is no information to represent each candidate term and the only information we have is the similarity between candidate terms, many clustering methods can not be used. We use a Hierarchical Agglomerative clustering method with the average linkage as our main clustering linkage metric. The algorithm of HAAL clustering is as follows: 1. For each term in the candidate list:
Figure 2: An example of a co-occurrence matrix with four candidate terms sentences, in which the first sentence contains term2 and term4 , but does not contain term1 or term3 . Each sentence Sk is represented using a 2D matrix. In our co-occurrence matrix, a lower triangular matrix (aka left triangular matrix) is used as co-occurrence is a symmetric relation.
l0,0
l1,0 Mi = .. . ln,0
l1,1 .. .
..
ln,1
...
. ln,n
- Compute the sum of its similarities to other candidates. - Remove the term if the sum of its similarities is less than a threshold. The threshold is defined relative to top K cumulative similarities. 2. Put each candidate term ti in a separate cluster Ci . 3. Compute the similarity between each pair of clusters. In average-linkage clustering, the similarity between two clusters Ci and Cj is the average of all similarities between terms tm in Ci and terms tn in Cj .
Sim(Ci , Cj ) =
X 1 |Ci | × |Cj |
X
Sim(tm , tn )
tm ∈Ci tn ∈Cj
4. Merge two clusters which have the highest relation between them. 5. Goto step 3 until there are only N clusters left.
The entries of this matrix are defined as below.
for i 6= j :
li,j
In the first step, we remove candidates that do not co-occur frequently with other candidates. This also reduces the amount of time for clustering considerably.
5.2. Chi-square Test 0 term and term did not occur within the sentence S i j k Chi-square (χ2 ) test is used to compare observed frequencies of terms with frequencies expected to hypothesize their indepen 1 termi and termj co-occurred within the sentence Sk dency (Manning and Sch¨utze, 1999). In our case, we would like = 2 termi occurred within the sentence S but not termj to see if two terms co-occurred by chance or if they are related. k Among several chi-square tests, Pearson’s chi-square is the orig inal and most widely-used. The χ2 statistic sums the difference 3 termj occurred within the sentence Sk but not termi
between observed and expected frequencies, scaled by the magnitude of the expected frequencies:
and for i = j : χ2 =
(
0 termi did not appear within the sentence Sk
n X (Oi − Ei )2 i=1
Ei
li,i = 1 termi appeared within the sentence Sk Oi : an observed frequency;
5.
Candidate Answer Selection
The purpose of the Candidate Answer Selection module is to narrow down the candidate list and select a subset that is most likely to be the answer. In this section, we present a clustering method
Ei : an expected (theoretical) frequency; n : the number of possible outcomes of each event.
Baseline System Theoretical Max Baseline System Theoretical Max
Corpus
Questions
2007
85
2004-2006
237
Precision 0.075 0.165 1 0.064 0.141 1
Recall 0.388 0.248 0.388 0.407 0.287 0.407
F-score 0.106 0.163 0.485 0.098 0.154 0.472
Table 1: Results of the system before and after applying our approach.
5.3.
Similarity Measure
The similarity between two candidate terms is a normalized value denoting how often they co-occur within sentences of the domain documents. This value is normalized by how frequent the terms are. Once all the data regarding term occurrences and cooccurrences is collected, the similarity between each pair of terms is computed using the chi-square (χ2 ) statistic. To compute the similarity between two terms, termi and termj , a 2 × 2 contingency table is used (Manning and Sch¨utze, 1999).
termj ¬ termj Total
termi
¬ termi
O11 O12
O21 O22
O11 + O12
O21 + O22
Total O11 + O21 O12 + O22
add the target and question keywords to our candidate terms to be clustered. Their responsibility is to spy on candidate terms. These spies are treated exactly like candidate terms; hence their co-occurrences with candidate terms and also other spies are computed, their similarities are calculated and finally they are clustered along with candidate terms. These spies are used to pinpoint the cluster with the highest probability of being the correct cluster. Therefore, the cluster with the highest number of spies is selected and after removing the spies from the cluster, its members are returned as the final candidate answers. If the number of clusters are equal for two or more clusters, then the biggest cluster in terms of number of members is returned. This method is based on our hypothesis that the answers to a list question tend to co-occur with one another and with the target and question keywords as well.
N
6. Table 2: 2×2 contingency table used to compute χ2 statistic where: O11 : Number of sentences in which termi and termj co-occurred; S11 = { Sk | Sk [i, j] = 1 },
O11 = |S11 |
O12 : Number of sentences in which termi appeared but not termj ; S12 = { Sk | Sk [i, j] = 2 },
O12 = |S12 |
O21 : Number of sentences in which termj appeared but not termi ; S21 = { Sk | Sk [i, j] = 3 },
O21 = |S21 |
O22 : Number of sentences containing neither termi nor termj ; S22 = { Sk | Sk [i, j] = 0 },
O22 = |S22 |
N : Total number of sentences in the domain collection. N = |S|
or
N = O11 + O12 + O21 + O22
χ2 value for a 2 × 2 contingency table can be computed using the following formula (Manning and Sch¨utze, 1999).
χ2 =
N (O11 O22 − O12 O21 )2 (O11 + O12 )(O11 + O21 )(O12 + O22 )(O21 + O22 )
5.4.
Pinpointing the Right Cluster
After the clusters have been created, the main concern is how to select the right cluster. For this purpose, before clustering, we
Results and Analysis
Using 85 questions from TREC-2007 for training and 237 questions from TREC-2004 to 2006 for testing, the results shown in Table 1 are obtained. Since the approach needs an initial candidate list to work on, we can define the baseline and theoretical max for each list it is given. We define our baseline to be the F-score of the system before clustering (i.e. F-score of initial candidate list fed to our clustering method). The theoretical max is defined when the performance of the method is 100% i.e. it is able to extract all correct answers in the initial list and no incorrect answer is returned. Therefore, the precision of the retrieved sublist is 1.0 and its recall is equal to the recall of our initial list (since we do not extract further candidates which are not in the initial list). Table 1 shows that this approach increases the F-score of the baselines by 53% and 57%.
7.
Conclusion and Future Work
In this paper, we described our approach to answering list questions. We showed that our hypothesis that answer instances to a list question tend to co-occur within sentences seems to be correct. Empirical results based on TREC questions demonstrates the effectiveness of the approach. Although this approach is able to increase the F-score of the initial list by more than 50%, As Table 1 shows, The final result suffers significantly from the low precision and recall of the initial list. Due to the low accuracy of the NE tagger used, the initial list mostly contains a high percentage of terms which do not even comply with the expected answer type. A term-type validation method should be exploited to filter out those terms. In addition, Using techniques presented for the list completion task, the final candidate list can be expanded to include other potential terms in order to increase the recall.
8.
References
S. F. Adafre, M. de Rijke, and E. T. K. Sang. 2007. Entity Retrieval. In Proceedings of RANLP, Bulgaria, September.
K. Ahn, J. Bos, J. R. Curran, D. Kor, M. Nissim, and B. Webber. 2005. Question Answering with QED at TREC-2005. In Proceedings of the 14th Text Retrieval Conference (TREC-14), Gaithersburg, USA, November. NIST. George Furnas. 2008. Faculty profile: George furnas, university of michigan, school of information. [Online; accessed 01April-2008]. Z. Ghahramani and K. A. Heller. 2005. Bayesian Sets. In Advances in Neural Information Processing Systems (NIPS), December. Zelling Harris, 1954. The Structure of Language, chapter Distributional structure, pages 33–49. Prentice-Hall. J. Ko, L. Si, and E. Nyberg. 2007. A Probabilistic Graphical Model for Joint Answer Ranking in Question Answering. In Proceedings of SIGIR, Amsterdam, July. K. W. Kor. 2005. Improving answer precision and recall of list questions. Master’s thesis, School of Informatics, University of Edinburgh. Christopher D. Manning and Hinrich Sch¨utze. 1999. Foundations of Statistical Natural Language Processing. The MIT Press, Cambridge, Massachusetts. D. Moldovan, D. Clark, S. Harabagiu, and S. Maiorano. 2003. Cogex: A logic prover for question answering. In Proceedings of HLT-NAACL, Edmonton, May-June. M. Razmara, A. Fee, and L. Kosseim. 2007. Concordia University at the TREC 2007 QA track. In Proceedings of the 16th Text Retrieval Conference (TREC-16), Gaithersburg, USA, November. E. Whittaker, J. Novak, P. Chatain, and S. Furui. 2006. TREC2006 Question Answering Experiments at Tokyo Institute of Technology. In Proceedings of the 15th Text Retrieval Conference (TREC-15), Gaithersburg, USA, November. J. Xu, A. Licuanan, J. May, S. Miller, and R. Weischedel. 2002. TREC 2002 QA at BBN: Answer Selection and Confidence Estimation. In Proceedings of the 14th Text Retrieval Conference (TREC-11), Gaithersburg, USA, November. NIST. Y. Zhou, X. Yuan, J. Cao, X. Huang, and L. Wu. 2006. FDUQA on TREC2006 QA Track. In Proceedings of the 15th Text Retrieval Conference (TREC-15), Gaithersburg, USA, November.