1 ,2,3Department of CSE, Sikkim Manipal Institute of Technology. Abstract--The social insect metaphor for solving diverse problems has become an emerging ...
International Journal of Emerging Technology and Advanced Engineering Website: www.ijetae.com (ISSN 2250-2459, ISO 9001:2008 Certified Journal, Volume 3, Issue 4, April 2013)
Ant based Swarm Computing Techniques for Edge Detection of Images- A Brief Survey Rebika Rai1, Ratika Pradhan2, M.K.Ghose 3 1 ,2,3
Department of CSE, Sikkim Manipal Institute of Technology Edge detectors basically give the boundaries of object thereby significantly reducing the amount of data to be processed and to filter out the information that may be regarded as less relevant while preserving the important structural properties of an image and also interpretation of the information content in an image may therefore be substantially simplified using edge detection techniques. Various edge detection methods [7] have been developed and implemented for detecting meaningful discontinuities in intensity values; such discontinuities are detected by using first & second order derivatives. The first order derivative of choice in image processing is the gradient. The second order derivatives of choice in image processing are generally computed using Laplacian. Various edge detection methods available in the literature are: The Marr-Hildreth edge detector, The Canny edge detector, The Local Threshold and Boolean Function Based Edge Detection, Color Edge Detection Using Euclidean Distance and Vector Angle, Color Edge Detection using the Canny Operator, Depth Edge Detection using Multi-Flash Imaging and many more. The Marr-Hildreth edge detector, a very popular edge operator before canny edge detector which is a gradient based operator which uses the Laplacian to take the second derivative of an image. The idea is that if there is a step difference in the intensity of the image, it will be represented by in the second derivative by a zero crossing. It focuses on smoothing of image using Gaussian that reduces the amount of error found due to noise, further applying of 2-D Laplacian to an image will be rotation invariant and is often called the “Mexican Hat operator” [7] because of its shape, then finally looping through every pixel in the Laplacian of the smoothed image and looking for sign changes. If there is a sign change and the slope across this sign change is greater than some threshold, this pixel is marked as an edge. The Marr–Hildreth [7] operator, however, suffers from two main limitations. It generates responses that do not correspond to edges, so-called "false edges", and the localization error may be severe at curved edges. It is observed that zero-crossings in Marr-Hildreth edge detection always form connected, closed contours (or leave the edge of the image). This comes, however, at the expense of localization, especially for larger values of sigma.
Abstract--The social insect metaphor for solving diverse problems has become an emerging issue in the current years emphasizing on stochastic construction process building the solution probabilistically. Ant Colony Optimization (ACO) is an algorithm inspired by the foraging behavior of ants wherein ants deposits a volatile chemical call pheromone on the ground surface for the purpose of foraging and collective interaction via indirect communication. Edge detection mainly is the set of mathematically methods aiming to identify points in an image at which the image brightness changes sharply or formally generating some form of discontinuities. This paper explores the swarm computing technique called Ant Colony Optimization (ACO) for edge detection of imagery. General Terms / Keywords--Swarm Intelligence, Artificial Intelligence, Ant Colony Optimization, Edge detection, Pheromone, Imagery.
I.
INTRODUCTION
Swarm intelligence [12] is the discipline that deals with natural and artificial systems composed of many individuals that coordinate using decentralized control and self-organization. In particular, the discipline focuses on the collective behaviors that result from the local interactions of the individuals with each other and with their environment. Examples of systems studied by swarm intelligence are colonies of ants and termites, schools of fish, flocks of birds, herds of land animals. Some human artifacts also fall into the domain of swarm intelligence, notably some multi-robot systems, and also certain computer programs that are written to tackle optimization and data analysis problems. The problems vary ranging from a Travelling Salesman Problem (TSP) [14] to Classification [1][6] to edge detection [2][3][7][8][9][10][17]on the other hand. With the advancement of image capturing device, the image data is being generated in high dimensions [1]. Image capture devices work by illuminating the 2D gel and recording the light emitted from each point known as pixel. The illuminating light may be either transmitted or reflected by the gel to the detector which converts the light level into an electrical signal. The critical problem in Image processing is to reveal useful and meaningful information and edge detection focuses on capturing the important events and change in properties due to discontinuities in surface orientation, material properties or illumination discontinuities as shown in Figure 2.
249
International Journal of Emerging Technology and Advanced Engineering Website: www.ijetae.com (ISSN 2250-2459, ISO 9001:2008 Certified Journal, Volume 3, Issue 4, April 2013) The Canny edge detector is widely considered to be the standard edge detection algorithm in the industry and still outperforms many of the newer algorithms that have been developed that provide several ways to approximate and optimize the edge-searching problem. It emphasis on smoothing of an image with a 2-D Gaussian, further taking the gradient of an image, which indicates the presence of edges, followed by non-maximal suppression due to which the edge occur at points the where the gradient is at a maximum thereby suppressing all points not at a maximum, finally followed by Edge Thresholding. The computation of a two dimensional Gaussian is costly, so it is approximated by two one dimensional Gaussians, one in the x direction and the other in the y direction. The regular recursive implementation of the canny operator does not give a good approximation of rotational symmetry and therefore gives a bias towards horizontal and vertical edges. The Local Threshold and Boolean Function Based Edge Detection are different as it does not rely on the gradient or Gaussian smoothing rather takes advantage of both local and global thresholding to find edges. This [7] method emphasis on converting a window of pixels into a binary pattern based on a local threshold, and then applying masks to determine if an edge exists at a certain point or not, further comparing the binary pattern to the edge masks, then using a global threshold to remove false edges. Most edge detectors work on the grayscale representation of the image which basically cuts down the amount of data i.e. one channel instead of three and also lose some information about the scene. By including the color component of the image, the edge detector detects edge in regions with high color variation but low intensity variation. Color Edge Detection Using Euclidean Distance and Vector Angle edge detector uses two operators: Euclidean Distance and Vector Angle wherein the Euclidean helps finding edges based on intensity and the Vector Angle is used for finding edges based on hue and saturation. The detector applies both operators to the RGB color space of an image, and then combines the results from each based on the amount of color in a region. Color Edge Detection using the Canny Operator is another approach to edge detection [7] using color information by simply extending a traditional intensity based edge detector into the color space. This method seeks to take advantage of the known strengths of the traditional edge detector and tries to overcome its weaknesses by providing more information in the form of three color channels rather than a single intensity channel.
This method emphasis on reading a color image and dividing into 3 separate color channels, further running each color channel through the Canny edge detector separately to find a resulting colored edge map, then finally combining the resulting edge maps from each of the three color channels into one complete edge map. Depth Edge Detection [7] using Multi-Flash Imaging is another edge detector following the principle that using more data in the edge detection process [7] results in better detection of edges. However, in this case rather than merely extending from one channel of intensity to three channels of color, this edge detector actually makes use of multiple different images. This approach emphasizes on taking successive photos of a scene, each with a different light source close to and around the camera‟s center of projection focusing on changing of way the images is taken rather than concentrating on complex mathematical techniques to try to extract edges from existing images. This technique uses a camera with four flashes located at cardinal directions around the lens to take four successive images. The differences in shadows between each image suggest “depth edges”, or edges caused by depth discontinuities in an image. The quality of edge detection is highly dependent on lighting conditions, the presence of objects of similar intensities, density of edges in the scene, and noise. While each of these problems can be handled by adjusting certain values in the edge detector and changing the threshold value for what is considered an edge, no good method has been determined for automatically setting these values, so they must be manually changed by an operator each time the detector is run with a different set of data. Since different edge detectors work better under different conditions, it would be ideal to have an algorithm that makes use of multiple edge detectors. Artificial Intelligence and its theory provide a scope for edge detection using various swarm computing techniques and most popularly the Ant Colony Optimization methods to detect the edge in an image. The general Ant Colony Optimization algorithm focuses on the stochastic construction process that probabilistically build the solution by iteratively adding the solution components to the existing partial solution generated using the heuristic information by updating the pheromone trail and finally ants working concurrently and independently via indirect communication that leads to a final solution. II.
ANT COLONY O PTIMIZATION
Ant Colony Optimization is a relatively new population based approach to problem solving that takes inspiration from the social behavior of the ants.
250
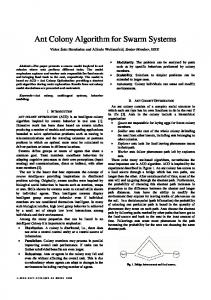
International Journal of Emerging Technology and Advanced Engineering Website: www.ijetae.com (ISSN 2250-2459, ISO 9001:2008 Certified Journal, Volume 3, Issue 4, April 2013) Different ants take up different paths to reach the food source and deposit the substance on the ground known as pheromone based on the fact that higher concentration of pheromone is deposited on shorter paths and smaller concentration on longer paths. Here, the collective behavior of ants provides intelligent solution for finding the shortest path from the nest to the food source. If a single ant finds a shorter path and deposit higher concentration of pheromone on the way to food source then all the other ants gets attracted towards the higher concentration and hence following the shorter path. Ant Colony Optimization is an iterative algorithm wherein at each iteration; a number of artificial ants are builds a solution by walking from vertex to vertex on the graph with the constraint of not visiting any vertex that she has already visited in her walk. At the end of an iteration, on the basis of the quality of the solutions constructed by the ants, the pheromone values are modified in order to bias ants in future iterations to construct solutions similar to the best ones previously constructed. Artificial ants are like real ants with some major differences:1) Artificial ants have memory, 2) They aren't completely blind, 3)They live in a discrete time environment. However they have some adopted characteristics from the real ants, like 1) They probabilistically prefer path with a larger amount of pheromone, 2)Shorter path is true path, larger is the rate of growth in the pheromone concentration, 3)They communicate to each other by means of the amount of pheromone laid on each path. The basic method for real ant system is illustrated in Figure 1. Ants communicate with each other using pheromones. In species that forage in groups, a forager that finds food marks a trail on the way back to the colony; this trail is followed by other ants (Figure 1(a)), these ants then reinforce the trail when they head back with food to the colony. When the food source is exhausted, no new trails are marked by returning ants and the scent slowly dissipates. This behavior helps ants deal with changes in their environment. For instance, when an established path to a food source is blocked by an obstacle (Figure 1(b)), the foragers leave the path to explore new routes (Figure 1(c)). If an ant is successful, it leaves a new trail marking the shortest route on its return. Successful trails [4] [5] are followed by more ants [15] [16] (Figure 1(d)), reinforcing better routes and gradually finding the best path.
Figure 1(b): An obstacle placed on the way between nest and food [4] [5].
Figure 1(c): Ants randomly choosing the path [4] [5].
Figure 1(d): Shortest path chosen by maximum ants based on pheromone deposits [4] [5].
The path with the largest amount of pheromone is chosen by ants. Since, pheromone being a volatile chemical evaporates with time; it is obvious that the shorter route will have higher concentration of pheromone [4] [5] [14] [15] [16] compared to the longer routes. The smell of the chemical attracts more ants to join the trial, thus the ants are finally capable to find the shortest route between the nest and the food. This process is described as a loop of positive feedback, in which the probability of ants choosing the path totally depends on the number of ants that have already traversed through the path [5] [4]. III.
EDGE DETECTION
Edge is an important feature in an image and carries important information about the objects present in the image. Drawing out of edges is known as edge detection which is by far the most common approach for detecting meaningful discontinuities in intensity values and factors that lead to the change in properties are discontinuities in surface orientation, material properties or illumination discontinuities [shown below in figure 2] and such discontinuities are detected by using first & second order derivatives.
Figure 1(a): Ants moving from nest (source) towards its food (Destination) [4] [5].
251
International Journal of Emerging Technology and Advanced Engineering Website: www.ijetae.com (ISSN 2250-2459, ISO 9001:2008 Certified Journal, Volume 3, Issue 4, April 2013) (c) Node transition rule: Two different cases have been considered for node transition: (i) If ant is on a background pixel and surrounded only by background, at next iteration, ant will be displaced to a new randomly chosen pixel. (ii) Ants probabilistically chose one of their eightneighborhood pixels according to Equation (1), as illustrated in Figure 3. The probability of displacing the kth ant from node (r,s) to node (i,j) is considered to be:
Figure 2: Factors that are likely to correspond to the discontinuities in image brightness.
The major steps involved using Ant Colony Optimization algorithm for edge detection is: a) Initialize the positions of all ants as well as pheromone matrix (same size as mage). b) For the construction step, move the ant K for L steps according to the probability transition matrix. c) Update the pheromone matrix. d) Make the binary decision to decide if there is an edge or not based on final pheromone matrix. IV.
(1)
Where, τi,j and ηi,j are the pheromone intensity and the visibility of pixel (i,j), respectively, and, α and β are control parameters. In addition, the visibility of pixel (i, j ) is defined by:
ANT B ASED METHODS FOR E DGE DETECTION AVAILABLE IN T HE LITERATURE
Ant colonies provide a means to formulate some powerful nature-inspired heuristics for solving the issues related to image processing. Based on ant‟s behavior, several edge detection methods have been proposed in the literature. This section provides a brief description of these methods.
(2)
4.4 H. Nezamabadi-Pour, S. Saryazdi, E. Rashedi, in their paper named [9] “Edge detection using ant algorithms” proposed a new algorithm for ant colony search wherein the problem is represented by a directed graph in which nodes are the pixels of an image. The method by H. Nezamabadi-Pour, S. Saryazdi and E. Rashedi highlighted on the detailed procedure using ACO for edge detection as: (a) Problem graph representation: The input image is well thought-out as a two dimensional graph in which the nodes are pixels of an image and ants navigate through the image by moving from one pixel to another thus marking the traversed pixels by the means of pheromone trail. (b) Initializing ant distribution: “M‟ number of ants is placed at random with at most one ant on each pixel. Intensity of the all pixels is set to 0.0001.
Figure 3: Proposed node [9] transition strategy.
(d) Pheromone updating rule: At the end of each iteration, the pheromone level is updated according to Equation (3)
(3)
252
International Journal of Emerging Technology and Advanced Engineering Website: www.ijetae.com (ISSN 2250-2459, ISO 9001:2008 Certified Journal, Volume 3, Issue 4, April 2013) Where,
(b)Construction Process: At the nth construction-step, one ant is randomly selected from the above-mentioned total K ants, and this ant will consecutively move on the image for L movement-steps. This ant moves from the node (l, m) to its neighboring node (i, j) according to a transition probability that is defined as:
and
Where, b is a threshold value. The evaporation of pheromone helps to avoid un-limited accumulation of the pheromone trails, and, if a pixel is not chosen by the ants, its intensity of pheromone decreases exponentially. To avoid stagnation of the search, the minimum of pheromone intensity is limited by τmin. Since τmin ≥ 0, the probability of choosing a specific pixel is never 0. This minimum value according to Max–MinAS algorithm [12] is considered to be 0.0001. (e) Stopping criterion: The end of algorithm achieves by a pre-defined number of cycles, for which each cycle contains a fix number of steps. The number of cycles is chosen to be 3. Thereby, the paper “Edge detection using ant algorithms” concluded that the ant algorithms are interesting heuristics inspired by behavior of real insects with its major components, i.e. graph representation, initial ant distribution, node transition rule, and pheromone updating rule were investigated and adapted to the underlying problem. Suitable values of the algorithm parameters were determined through empirical studies and the results confirmed the excellent performances of the proposed algorithm along with its qualitative results.
(4) Where, is the pheromone value of the node (i, j), Ω (l,m) is the neighborhood nodes of the node (l,m), ηi,j represents the heuristic information at the node (i, j). The constants α and β represent the influence of the pheromone matrix and the heuristic matrix, respectively. There are two crucial issues in the construction process. The first issue is the determination of the heuristic information ηi,j in (4). In this paper, it is proposed to be determined by the local statistics at the pixel position (i, j) as (5) Where Z =∑i=1:M1∑j=1:M2Vc (Ii,j), which is a normalization factor, Ii,j is the intensity value of the pixel at the position (i, j) of the image I, the function Vc(I i,j) is a function of a local group of pixels c (called the clique), and its value depends on the variation of image‟s intensity values on the clique c (as shown in Figure 1). More specifically, for the pixel Ii,j under consideration, the function Vc(Ii,j) is
4.2 Jing Tian, Weiyu Yu, and Shengli Xie in their paper named [18] “An Ant Colony Optimization Algorithm for Image Edge Detection” proposed ACO for edge detection utilize a number of ants to move on a 2-D image for constructing a pheromone matrix, each entry of which represents the edge information at each pixel location of the image. Furthermore, the movements of the ants are steered by the local variation of the image‟s intensity values. The proposed approach starts from the initialization process, and then runs for N iterations to construct the pheromone matrix by iteratively performing both the construction process and the update process. Finally, the decision process is performed to determine the edge. The method by Jing Tian, Weiyu Yu, and Shengli Xie highlighted on the detailed procedure using ACO for edge detection as:
(6) To determine the function f(x) in (6), the following four functions are considered in this paper; they are mathematically expressed as follows and illustrated in Figure 2, respectively. (7) (8)
(a) Initialization Process: K ants are randomly assigned on an image I with a size of M1 ×M2, each pixel is viewed as a node. The initial value of each component of the pheromone matrix τ(0) is set to be a constant τinit.
(9)
253
International Journal of Emerging Technology and Advanced Engineering Website: www.ijetae.com (ISSN 2250-2459, ISO 9001:2008 Certified Journal, Volume 3, Issue 4, April 2013) • The second update is carried out after the movement of all ants within each construction-step according to (10) The parameter λ in each of above functions (7)-(10) adjusts the functions‟ respective shapes. The second issue is to determine the permissible range of the ant‟s movement (i.e., Ω(l,m) in (4)) at the position (l,m). In this paper, it is proposed to be either the 4connectivity neighborhood or the 8-connectivity neighborhood, both of which are demonstrated in Figure 3.
Where, is the pheromone decay coefficient. (d) Decision Process: In this step, a binary decision is made at each pixel location to determine whether it is edge or not, by applying a threshold T on the final pheromone matrix τ (N). In this paper, the abovementioned T is proposed to be adaptively computed based on the method developed in [19]. The initial threshold T(0) is selected as the mean value of the pheromone matrix. Next, the entries of the pheromone matrix is classified into two categories according to the criterion that its value is lower than T(0) or larger than T(0). Then the new threshold is computed as the average of two mean values of each of above two categories. The above process is repeated until the threshold value does not change any more (in terms of a user-defined tolerance). Thereby, the paper “An Ant Colony Optimization Algorithm for Image Edge Detection” concluded that the proposed approach yields superior subjective performance to that of the existing edge detection algorithm [8]. Furthermore, the parallel ACO algorithm [16] can be exploited to further reduce the computational load of the proposed algorithm, for future research work.
Figure 4: A local configuration[18] at the pixel position Ii,j for computing the variation Vc(Ii,j) defined in (6). The pixel Ii,j is marked as gray square.
Figure 5: Various neighborhoods [18] (marked as gray regions) of the pixel Ii,j :(a)4-connectivity neighborhood; and (b)8-connectivity neighborhood.
(c) Update Process: The proposed approach performs two updates operations for updating the pheromone matrix. • The first update is performed after the movement of each ant within each construction-step. Each component of the pheromone matrix is updated according to
(11) Where, ρ is the evaporation rate, by the heuristic matrix; that is,
is determined
4.4 Javad Rahebi, Hamid Reza Tajik, in their paper named [17] “Biomedical Image Edge Detection using an Ant Colony Optimization Based on Artificial Neural Networks”, proposed method using artificial neural network with supervised learning along with momentum to improve edge detection based on ACO. The experimental results shows that make use neural network are very effective in edge detection based on ACO. The goals of biomedical image edge detection based on ACO are to use the number of ants to move on an image 2-D to create a pheromone matrix, each entry of that shows the edge information in each pixel location of the biomedical image. In addition, the movements of the ants are directed through the local variation of image intensity values. The method by Javad Rahebi and Hamid Reza Tajik highlighted on the detailed procedure using ACO for biomedical image edge detection as: (a) Initialization Process: Assign all K ants randomly on the image I with size of M1xM2. Each pixel can be considered as a node. The initial value of each component of pheromone matrix τ(0) is set a fixed value τinit .
= ηi,j .
254
International Journal of Emerging Technology and Advanced Engineering Website: www.ijetae.com (ISSN 2250-2459, ISO 9001:2008 Certified Journal, Volume 3, Issue 4, April 2013) (b) Construction Process: At the n-th construction-step, one ant is chosen randomly from K mentioned ants and this ant for L Movement-steps moving on the image consecutively. This ant moves from node (l,m) to neighboring node (i,j) based on transition probability that is defined as following:
These neurons are arranged as 9-12-1; That is, 9 neurons are in the input layers, 12 are in the hidden layers and 1 is in the output layer. ANN has MLP structure, which is used forward propagation neural network and is shown in the figure 6. i. MLP has one input layer, one or multiple hidden layer and one output layer. ii. Information enters to input layer and is manipulated in all neurons, then sent to output layer. iii. Classify, character recognition, function calculation are MLP usable areas. And back propagation method is used to update parameters. iv. Back Propagation (BP) method is based on reduced parameters with an on time cost function. The back-propagation algorithm uses the gradient of the activation function to determine how to adjust the weights to minimize errors that effect on performance. In this paper, the activation function of each node uses a sigmoid function,
(12) Where, is the pheromone value of the node (i, j), Ω (l,m) is the neighborhood nodes of the node (l,m), ηi,j represents the heuristic information at the node (i, j). The fixed value α and β represent the influence of the pheromone matrix and the heuristic matrix, respectively. There are two essential issues in the construction process. The first issue is the determination of the heuristic information ηi,j in (4). In this paper, it is proposed to be determined by the local statistics at the pixel position (i, j) as
(16) Sigmoid function generates values between (0, 1), so values are normalized before input the network and reduce between (0, 1). Our ANN structure consists of two stages for training:
(13) Where Z =∑i=1:M1∑j=1:M2Vc (Ii,j), which is a normalization factor, Ii,j is the intensity value of the pixel at the position (i, j) of the image I, the function Vc(I i,j) is a function of a local group of pixels c (called the clique), and its value depends on the variation of image‟s intensity values on the clique c (as shown in figure 5). (c) Update Process: The proposed approach performs two updates operations for updating the pheromone matrix. • The first update is performed after the movement of each ant within each construction-step. Each component of the pheromone matrix is updated according to
1. Training of input layer: As shown in figure 4, a 3*3 mask is used to apply to resulted biomedical image from edge detection. This mask is the same pixel values of detected edge image that use for training as input ANN. Here, each of 9 neurons in input layer connects to each of 12 neurons in hidden layer. Values which enter 9 neurons in the input layer are calculated with a gradient method and results are used at hidden layer input.
(14) Where, ρ is the evaporation rate, by the heuristic matrix; that is,
is determined
= ηi,j .
• The second update is carried out after the movement of all ants within each construction-step according to (15) Where, is the pheromone decay coefficient. (d) Enhancement of Edges using ANN In the proposed method of combined optimization methods, we were used 22 neurons in our ANN structure.
Figure 6: Architecture of ANN [17].
255
International Journal of Emerging Technology and Advanced Engineering Website: www.ijetae.com (ISSN 2250-2459, ISO 9001:2008 Certified Journal, Volume 3, Issue 4, April 2013) 2. Training of hidden layer and output layer BP method with momentum is used for training of hidden and output layers which is mostly used in the available literatures [20][21]. In this method, the error of network output is distributed to connected weights and then parameters are iteratively updated to minimize the error. The momentum value during the training process is set to 0.8 and training parameter is set to 0.2. Randomly, values between [-1, 1] is taken as the initial values of the weights. The average error is less than 0.01 and the training takes 3500 epoch. Thereby, the paper “new method for biomedical image edge detection using ACO technique based on ANN” concluded that proposed method is better implementation of existing algorithms for edge detection as has been proven for the simulation results. Proposed method has been compared with Jing Tian method enjoys higher speed, less processing time and more answer's optimum. In addition, the proposed algorithm further reduces the capacity of more computational tasks in research.
1. Meeting face to face. Two ants belonging to different groups both stop when the next moves bring them together, shown in Fig. 2a. 2. Touching tracks. An ant stops moving when it touches the track passed by another ant, shown in Fig. 2b. 3. Adaptive tabu-list. Each ant records his passed path, and uses a tabu-list to explore where he has never passed. However, this method causes some problems like blind alleys, as shown in Fig. 2c. The proposed approach adopts adaptive tabu-list to allow an ant to move to the passed routes again while time of ants moving into the blind alley is smaller than a predefined threshold. Track density measurement. An ant stops when the passed tracks nearby the current point is larger than a predefined threshold, as shown in Fig. 2d. These four policies improve the evolution effciency by enhancing the path clarity and reducing the lower computation load.
4.4 De-Sian Lu, Chien-Chang Chen, in their paper named [8]“Edge detection improvement by ant colony optimization,” proposed ACO method to improve the performance of traditional edge detection methods. Edge detection is a technique for marking sharp intensity changes, and is important in further analyzing image content. However, traditional edge detection approaches always result in broken pieces, possibly the loss of some important edges. This study presents an ant colony optimization based mechanism to compensate broken edges. The proposed procedure adopts four moving policies to reduce the computation load. Remainders of pheromone as compensable edges are then acquired after finite iterations. The method by De-Sian Lu, Chien-Chang Chen highlighted on the detailed procedure for detection of edges using ACO as: V.
Figure 7: (a) Original image [8]. (b) Traditional edge detection on (a). (c) Placing ants on all end points.
VI. COMPENSABLE EDGES SEARCH The movement of an ant is determined by the 8neighborhood difference. However, as shown in Figure 8(b), ants may unsteadily seek the whole edge-like region and easily cross to the error region. The global pheromone updating strategy may result in burr edges. Therefore, we adopt two following factors to select suitable paths: a) Maximal neighboring difference. Ants can identify possible edges from high neighboring differences. b) Maximal connective similarity. Ants may search possible edge irresolutely, as shown in Figure 8(c), when they search on pixels near the real edges. Edges with similar intensity are considered as real edges. Therefore, the path length estimation equation should estimate the affection of this consideration. Furthermore, the connective similarity is more important than the maximal neighboring difference.
REDUNDANT SEARCH REDUCTION
The proposed approach relies on ants searching paths among break edges and exploring compensable edges. Ants are placed on endpoints of edge image filtered by traditional edge detection approaches. Each endpoint is laid down one ant as shown in Figure 7(c). However, an image always contains hundreds of endpoints. Therefore, these ants may start a time-consuming evolutionary search. Some ants may search the same region redundantly. To reduce the number of redundant searches, the ants are split into several groups with different labels. One labeled ant finds other labeled ants by following four redundancy-reducing policies:
256
International Journal of Emerging Technology and Advanced Engineering Website: www.ijetae.com (ISSN 2250-2459, ISO 9001:2008 Certified Journal, Volume 3, Issue 4, April 2013)
(19)
(20) Where, ƞij is defined in Eq. (17); τij denotes the pheromone trail between pixel i and j; α and β are two parameters determining the relative influence of the pheromone trail and the path visibility; q denotes a random variable, and J denotes a random variable selected according to the probability distribution given by Eq. (20). Eq. (19) indicates that a parameter q0, satisfying 0 ≤ q0 ≤1, determines the probability of an ant selecting exploitation or exploration as its next stop. In exploitation, as a probability of q0 the ant chooses the next stop by the largest relative influence. Conversely, in exploration, the ant chooses the next stop according to the probability distribution of the relative influence with the probability of 1 - q0. After an ant moves from the current stand i to next stop j, the pheromone trail of the path is evaporated as follows:
Figure 8: (a) Two ants meet face to face [8]. (b) The ant touches the track passed by ants of a different group. (c) Blind alley. (d) Measurement of track density.
Some important parameters used in the ACO approach are first defined. When an ant located at pixel i, the path visibility between pixels i and j is defined as follows:
(21) Where, ξ denotes the local pheromone evaporation ratio satisfying 0 < ξ < 1, and τ0 is defined as the same as the initial value for the pheromone trails. The pheromone trail is globally updated after each iteration. The pheromone trail of each route, whether or not it is passed through, needs to be renewed by the following global updating rule:
(17) Where, pi denotes the pixel intensity of pixel i, and pj denotes the intensity of j as an adjacent pixel to i. The term V(pj) represents the neighboring difference of pj , and is defined as follows:
(22)
(18) Where, NEj denotes the collection of all 8neighborhood pixels, ƞij in Eq. (17) represents the edgelike magnitude on the undirected path between i and j, thus ƞij= ƞji. A large value for ƞij means that the ideal edge may exist. The denominator of Eq. (18) denotes the factor of maximal connective similarity. If V(p j) = 0, as defined in Eq. (17), then the ant stops here, as indicated by ant A in Figure 8(d). The ant located at an error edge cannot move to the adjacent place because of fully plane neighborhoods. An ant goes to its next stop by the following path selection rule:
(23) Where, ρ denotes the global pheromone evaporation ratio satisfying 0 ≤ ρ ≤1, and avg(Dm) denotes the average step length of ant m. The score of a route is the total score of resulting from the passing of all ants in iteration. The denominator of Eq. (23) τmax is set in conjunction with the size of image as max{M, N}, where M x N denotes the image size.
257
International Journal of Emerging Technology and Advanced Engineering Website: www.ijetae.com (ISSN 2250-2459, ISO 9001:2008 Certified Journal, Volume 3, Issue 4, April 2013) Selection of the parameters is important. Parameters α and β determines the relative influence of the pheromone trail and the path visibility. Information in image content is always more important than in pheromone trail, thus, β > α is a general selection and our experiments adopt α =1, β= 2. Parameter q0 determines the probability of the ant selecting the most important edge. The value of q 0 is always close to 1 and our experiment adopt q0= 0.9. Three parameters τ0, ξ and ρ are always small to let pheromone trail from previous pheromone trail change. Our experiment adopt τ0= 0.000001, ξ = 0.2, and ρ= 0.3. At last, finite number of iterations finishes the improving cycle. The number selection is a trade-off between compensation edges integrity and computation load, in which large number of iterations completes the compensation edges but accompanying with heavy computation load. However, too much iteration may generate too much false edges. Experimental results show that the number of iterations between 100 and 400 is adequate for acquiring compensation edges. Thereby, the paper “Edge detection improvement by ant colony optimization,” concluded that ants in the proposed method break the limited range of local analysis, and proceed along the edge-like path to extract whole compensation edges. Additionally, the global pheromone updating rules and path length measurement are adjusted. This method is effective because the proposed redundancy reducing policies can shorten the ant searching path and reduce the computation load. Experimental results indicate that the proposed method efficiently improves edge images detected by traditional approaches like Sobel or Canny further reducing the computation complexity of ACO. VII.
REFERENCES [1]
[2]
[3]
[4]
[5]
[6]
[7]
[8]
[9]
[10]
CONCLUSION AND F URTHER RESEARCH D IRECTIONS
General edge detectors behavior may fall within tolerances in specific situations, in general edge detectors have difficulty adapting to different situations. The quality of edge detection is highly dependent on lighting conditions, the presence of objects of similar intensities, density of edges in the scene, and noise. While each of these problems can be handled by adjusting certain values in the edge detector and changing the threshold value for what is considered an edge, no good method has been determined for automatically setting these values, so they must be manually changed by an operator each time the detector is run with a different set of data. Since different edge detectors work better under different conditions, it would be ideal to have an algorithm that makes use of multiple edge detectors, applying each one when the scene conditions are most ideal for its method of detection.
[11]
[12] [13] [14]
[15] [16]
[17]
258
Rebika Rai, Ratika Pradhan, M.K.Ghose, “Ant based Swarm Computing for Image Classification - A Brief Survey”, in IJCA Special Issue on Computational Intelligence and Information Security (CIIS) November15,2012 [ ISBN: 973-93-80870-58-7] Y. Tyagi, T. A. Puntambekar, Preeti Sexena, Sanjay Tanwani, “ A Hybrid Approach to Edge Detection using Ant Colony Optimization and Fuzzy Logic”, International Journal of Hybrid Information Technology Vol. 5, No. 1, January, 2012. Mohit Mehta, Munish Rattan, “An improved ACO based algorithm for image edge detection”, International Journal of Computing and Corporate Research, Volume 2 Issue 5, September 2012. Rebika Rai, Tejbanta Singh Chinghtam, "A hybrid framework for Robot path planning and Navigation using ACO & Dijkstra", IJCA Proceedings on International Symposium on Devices MEMS, Intelligent Systems & Communication (ISDMISC) (9):19-24, October 2011. Published by Foundation of Computer Science, New York, USA. Rebika Rai, Tejbanta Singh Chinghtam, M.K.Ghose, 2009, “Optimization of Autonomous Multi-Robot Path Planning & Navigation using Swarm Intelligence”, In National Conference on LEAN Manufacturing Implementations : The future of Process Industries (LEMAN „2009)”. Lintao Wen, Qian Yin, Ping Guo, 2009, “Ant Colony Optimization algorithm for feature selection and Classification of multispectral remote sensing image”, 2nd International congress on Image and Signal Processing, CISP‟09. Ehsan Nadernejad, Sara Sharifzadeh, Hamid Hassanpour,” Edge Detection Techniques: Evaluations and Comparisons”, Applied Mathematical Sciences, Vol. 2, 2008, no. 31, 1507 - 1520 D.-S. Lu and C.-C. Chen, “Edge detection improvement by ant colony optimization,” Pattern Recognition Letters, vol. 29, pp. 416–425, March 2008. H. Nezamabadi-Pour, S. Saryazdi, and E. Rashedi, “Edge detection using ant algorithms,” Soft Computing, vol. 10, pp. 623–628, May 2006. H. Zheng, A. Wong, and S. Nahavandi, “Hybrid ant colony algorithm for texture classification,” in Proc. IEEE Congress on Evolutionary Computation, Canberra, Australia, Dec. 2003, pp. 2648–2652. M. Randall and A. Lewis, “A parallel implementation of ant colony optimization,” Journal of Parallel and Distributed Computing, vol. 62, pp. 1421–1432, Sep. 2002. R. Eberhart, Y. Shi, and J. Kennedy, 2001, Swarm Intelligence. San Francisco, CA: Morgan Kaufmann. T. Stutzle and H. Holger H, “Max-Min ant system,” Future Generation Computer Systems, vol. 16, pp. 889–914, Jun. 2000. M. Dorigo and L. M. Gambardella, 1997, “Ant colony system: A cooperative learning approach to the traveling salesman problem,” IEEE Trans. Evol. Comput. vol. 1, no. 1, pp. 53–66. H. Gutowitz, “Complexity-seeking ants”, 1993, In Proc. of the Third European Conference on Artificial Life. M. Dorigo, 1992, “Optimization, learning and natural algorithms,” Ph.D. dissertation, Dept. Electron., Politecnico di Milano, Milan, Italy. Javad Rahebi, Hamid Reza Tajik, “Biomedical Image Edge Detection using an Ant Colony Optimization Based on Artificial Neural Networks”, International Journal of Engineering Science and Technology (IJEST).
International Journal of Emerging Technology and Advanced Engineering Website: www.ijetae.com (ISSN 2250-2459, ISO 9001:2008 Certified Journal, Volume 3, Issue 4, April 2013) [18] Jing Tian, Weiyu Yu, and Shengli Xie, “An Ant Colony Optimization Algorithm for Image Edge Detection”, IEEE Congress on Evolutionary Computation (CEC 2008). [19] N. Otsu, “A threshold selection method from gray level histograms,” IEEE Trans. Syst., Man, Cybern. vol. 9, pp. 62–66, Jan. 1979.
[20] Y. Becerikli and H. Engin Demiray, Alternative Neural Network Based Edge Detection, Neural Information Processing, Vol. 10, Nos. 8-9, Sept. 2006. [21] M. Egmont-Petersen, D. de Ridder, H. Handels, Image processing with neural networks – a review, Vol. 35, No. 10, pp. 2279-2301, 2002.
259