Biogeosciences, 12, 4275–4289, 2015 www.biogeosciences.net/12/4275/2015/ doi:10.5194/bg-12-4275-2015 © Author(s) 2015. CC Attribution 3.0 License.
Anthropogenic point-source and non-point-source nitrogen inputs into Huai River basin and their impacts on riverine ammonia–nitrogen flux W. S. Zhang1,2,3 , D. P. Swaney3 , X. Y. Li1 , B. Hong3 , R. W. Howarth3 , and S. H. Ding4 1 State
Key Laboratory of Urban and Regional Ecology, Research Center for Eco-Environmental Sciences, Chinese Academy of Sciences, Beijing, China 2 University of Chinese Academy of Sciences, Beijing, China 3 Department of Ecology and Evolutionary Biology, Cornell University, Ithaca, NY, USA 4 Huai River Commission, Ministry of Water Resources, Bengbu, Anhui, China Correspondence to: X. Y. Li (
[email protected]) Received: 4 February 2015 – Published in Biogeosciences Discuss.: 27 February 2015 Revised: 7 July 2015 – Accepted: 8 July 2015 – Published: 22 July 2015
Abstract. This study provides a new approach to estimate both anthropogenic non-point-source and point-source nitrogen (N) inputs to the landscape, and determines their impacts on riverine ammonia–nitrogen (AN) flux, providing a foundation for further exploration of anthropogenic effects on N pollution. Our study site is Huai River basin of China, a watershed with one of the highest levels of N input in the world. Multi-year average (2003–2010) inputs of N to the watershed are 27 200 ± 1100 kg N km−2 yr−1 . Non-point sources comprised about 98 % of total N input, and only 2 % of inputs are directly added to the aquatic ecosystem as point sources. Fertilizer application was the largest non-point source of new N to the Huai River basin (69 % of net anthropogenic N inputs), followed by atmospheric deposition (20 %), N fixation in croplands (7 %), and N content of imported food and feed (2 %). High N inputs showed impacts on riverine AN flux: fertilizer application, point-source N input, and atmospheric N deposition were proved as more direct sources to riverine AN flux. Modes of N delivery and losses associated with biological denitrification in rivers, water consumption, interception by dams may influence the extent of export of riverine AN flux from N sources. Our findings highlight the importance of anthropogenic N inputs from both point sources and non-point sources in heavily polluted watersheds, and provide some implications for AN prediction and management.
1
Introduction
Nitrogen (N) enrichment in watershed ecosystems is an issue of global concern (Galloway et al., 2004). Human activities strongly influence the N loads to watersheds in a number of different ways, for example through fertilizer application driven by increased agricultural activities (Billen et al., 2001; Billen et al., 2013), or through point-source discharge as the result of increased industrial and domestic emissions (Van Drecht et al., 2009). Increased N input to watersheds is often accompanied by a high load of N into the river system and corresponding riverine N export (Han and Allan, 2012; Hong et al., 2012). These N impacts on N flux are very dependent on the modes of delivery to aquatic ecosystems. For example, the pollutants could be added into the river network by indirect routes such as rainfall–runoff and leaching (Carpenter et al., 1998) or discharged directly into river systems. Therefore, to effectively guide N management for protecting aquatic ecosystem health, anthropogenic N accounting linked to riverine N export must be responsive to the modes of N delivery. Net anthropogenic nitrogen input (NANI) is a watershedbudgeting approach that sums N contributions from atmospheric deposition, fertilizer application, agricultural biological fixation, and net import/export of N in food and feed to a watershed. This method was originally proposed by Howarth et al. (1996), and has been used as a simple yet powerful approach to estimate major anthropogenic sources of N to ter-
Published by Copernicus Publications on behalf of the European Geosciences Union.
4276
W. S. Zhang et al.: Anthropogenic point-source and non-point-source nitrogen inputs
restrial and aquatic ecosystems. A large number of published studies have since described the relationship between NANI and nitrogen fluxes in rivers (David and Gentry, 2000; Boyer et al., 2002; Howarth et al., 2006, 2012; Han and Allan, 2008; Swaney et al., 2012; Billen et al., 2009). NANI has turned out to be a reliable predictor of riverine N exports, the magnitudes of which can also have strong relationships with hydroclimatic conditions such as precipitation, discharge, and temperature (Schaefer and Alber, 2007; Schaefer et al., 2009; Howarth et al., 2012). The accounting method of NANI has been refined since its first application in North Atlantic Ocean. Boyer et al. (2002) added a new input component to reflect the impact of natural fixation and found that this revised nitrogen accounting method (TNI, which is equivalent to NANI plus natural N fixation) would be a good predictor of riverine N export in watersheds dominated by “natural” systems. Han and Allan (2008) and Hong et al. (2013) refined the NANI methodology by comparing different calculation methods. Hong et al. (2011) then released an open-source toolbox of NANI estimation and greatly promoted the application of NANI methodology. However, all of the improvements in NANI methodology still did not address the modes of N delivery. Conventional NANI methodology emphasizes on the impact of non-point-source N input (Howarth, 1998) and is inexplicit in specific N pathways, which can cause potentially large errors and poor predictions in some watersheds with heavy point-source N pollution (Gao et al., 2014). In addition, a number of studies incorporating NANI have been conducted extensively on total nitrogen (e.g., Hong et al., 2012), nitrate flux (e.g., McIsaac et al., 2002), or total dissolved N (e.g., Huang et al., 2014); no single study has adequately addressed the ammonia–nitrogen (AN) component. This is problematic, because in many heavily impacted rivers, e.g., with high biological oxygen demand (BOD) due to untreated sewage and other sources of organic pollutants, the correspondingly low dissolved oxygen levels can provide an environment suitable for the persistence of AN as a component of riverine N fluxes. For example, in heavily polluted rivers in some regions, AN can account for more than 70 % of total nitrogen across seasons and river sections (PernetCoudrier et al., 2012; Li et al., 2014). Furthermore, in many Chinese rivers, AN is the only component of riverine N that is regularly monitored (Ma et al., 2009; Xia et al., 2011; Shao et al., 2006), which indicates the prevalence of the problem and supports the need for better understanding of AN dynamics in these heavily impacted rivers. Extending the study of NANI dynamics to include the response of riverine AN will refine our understanding of nitrogen dynamics in river basins and will facilitate adaptive management of conservation policies and programs, especially in areas of poor riverine water quality. Hence, the major purposes of this study are to (1) differentiate the common NANI methodology into two parts: point sources and non-point sources; (2) investigate the imBiogeosciences, 12, 4275–4289, 2015
pact of anthropogenic point-source and non-point-source N inputs on riverine AN flux; and (3) determine the potential influential factors of riverine AN export. We carried out our study in the Huai River basin (HRB), which was previously reported as one of the watersheds with the heaviest pollution in China (Bai and Shi, 2006) and the highest N input in the world (Billen et al., 2013), giving it the worst water quality in the nation’s top seven basins (Xia et al., 2011) and resulting in health consequences for its population (Bai and Shi, 2006). In addition, as a representative basin of rapid urbanization growth (a 15 % increase during 2003–2010, according to MWR, 2010), results from the HRB would also have implications for other watersheds, since as claimed by Van Drecht et al. (2009), future continued population and economic growth in developing countries will almost certainly lead to further increasing N emissions in the coming decades. Below, we first estimate the number of point-source N and non-point-source N inputs that occur for the whole basin. Then, we investigate the AN export in relation to NANI and analyze the factors most influential to AN export. Finally, parametric and sensitivity analyses of NANI methodology are also conducted since they could serve as guidance in applications to other watersheds and to adjust anthropogenic N inputs. Most of the data used to estimate NANI are presented in the Supplement.
2 2.1
Material and methods Watershed characteristics
The Huai River basin (HRB) is located in eastern China (30◦ 550 –36◦ 360 N, 111◦ 550 –121◦ 250 E; Fig. 1), lying between the Yangtze River basin and Yellow River basin. It has a drainage area of 270 000 km2 , ranking sixth by area of all river basins of China. The HRB can be divided into the upper, middle, and lower and Yishusi subbasins. The 1000 km Huai River originates in the Tongbai Mountains of Henan province and flows eastward to the Yangtze River and Yellow Sea (Fig. 1). The Yishusi River stems from the Yimeng Mountains of Shandong province and flows southward then eastward to the Yellow Sea. The population dwelling in the basin is approximately 165 million. Its average population density is 623 persons km−2 , and approximately 5 times the nation’s average. Twenty-seven watersheds cover the total area of the four reaches, ranging in size from 1095 to 16 460 km2 and encompassing a wide variety of land uses, population density, and human activities. Land cover in the HRB was 9.8 % forest, 1.7 % grass, 68.7 % cropland, 6.1 % wetland, and 13.5 % residential area for the period of the 1990s through 2000s, although land cover varies greatly across watersheds and time (see Part I in the Supplement). The area-weighted average of total annual precipitation is highly variable from year to year (ranging from about 637.0 to 1287.5 mm × yr−1 ), and www.biogeosciences.net/12/4275/2015/
W. S. Zhang et al.: Anthropogenic point-source and non-point-source nitrogen inputs
4277
Figure 1. The boundaries of the 27 watersheds used in constructing N budgets. We did not have sufficient monitoring data for watersheds 11, 18, 20, 22, 25, 26, and 27 (labeled with an asterisk). The following AN flux analysis does not include these seven watersheds.
50–80 % of annual precipitation is concentrated in the flood season (June–September) (Xia et al., 2011). Due to intensive agricultural production and rapid urbanization growth, industrial AN discharges reached 66 389 t in 2010 (MWR, 2010), and the amount of N fertilizer application had increased to 0.50 × 10⁶ t, raising the issues of impacts on water quantity and quality in this watershed. 2.2
Methodology
The N budget considered here was divided into non-pointsource and point-source inputs because of the major differences in their modes of N delivery. This division facilitates the analyses performed below related to attribution of sources. The equation can be represented as NANI = NANIn + NANIp ,
(1)
where NANI is the total net anthropogenic nitrogen input, NANIn is net anthropogenic nitrogen input that could potentially contribute to non-point-source pollution, and NANIp is www.biogeosciences.net/12/4275/2015/
the anthropogenic nitrogen input that directly discharges into the river (i.e., sewage N discharge). The main differences between Eq. (1) and the previous version of NANI methodology are that (1) human-induced N inputs were recalculated according to their modes of N delivery and (2) that some new equations that can represent industrial and urban domestic loads were introduced to estimate point-source N inputs. The methodology of NANIn estimation was very similar to that reported in Han et al. (2014), which was in turn based on the methods developed by Howarth et al. (1996). Major input components included atmospheric deposition, fertilizer, net food and feed import, and biological N fixation. This nonpoint-source component should exclude part of urban household N emissions that enter centralized sewage systems and then discharge into river systems as a form of point source (Van Drecht et al., 2009). Industrial and domestic centralized sewage nitrogen discharge are considered to be point-source nitrogen inputs (NANIp ). Industrial byproducts (primarily structural forms, e.g., nylon, plastic, and synthetic fiber) are not considered as a new input since most of them tend to acBiogeosciences, 12, 4275–4289, 2015
4278
W. S. Zhang et al.: Anthropogenic point-source and non-point-source nitrogen inputs
cumulate in human settlements due to their long service lives (Gu et al., 2013). NANI are typically based on a watershed scale in order to estimate riverine N export from the watershed. We collected all the data sets covering 2003–2010 for each county. All the data were multi-year-averaged (2003–2010) to avoid a storage effect in which N tends to be stored in the landscape in dry years and flushed into rivers in wet years (Howarth et al., 1996; Swaney et al., 2012; Chen et al., 2014). As suggested by Han and Allan (2008) and Hong et al. (2013), countylevel data sets were aggregated to the catchment scale using a land use weighting method: weighting by the fraction of the relevant land use type, such as crop or urban land, lying within each catchment. For agriculturally related indicators (such as fertilizer application and crop yields), we adopted the land use weighting by cropland area; for residentially related indicators (such as population, industrial sewage discharge), we used the method of land use weighting by urban land area. Land cover data with a 30 m × 30 m resolution was adopted to transform the scale (see Fig. 1a). To facilitate understanding our N cycle analysis, a diagram of the nitrogen accounting method is presented in Fig. 2. 2.2.1
Non-point sources (NANIn )
The total amount of non-point-source nitrogen input (NANIn ) is estimated as NANIn = Nchem + Nfix + Ndep + Nim − Nurban = Nchem + Nfix + Ndep + Nr -im,
(2)
where the individual N inputs are as follows: Nchem is N content of chemical N fertilizers applied, Nfix is crop N fixation, Ndep is atmospheric deposition of oxidized N, Nim is N content of the net import/export of food and feedstuffs, and Nurban is the N content of food and feed consumed by urban populations. To avoid double accounting of point-source inputs, Nurban was subtracted from NANIn for it is usually connected to municipal sewage systems and acts as point-source pollution. Since human N emission usually is identical to N intake (100 % excretion) (Han et al., 2011), Nurban here is considered a part of net food and feed import (Nim , including urban and rural N consumption). Thus, we can form a new input term defined as net food and feed import in rural region (Nr -im). All terms here are in kg N km−2 yr−1 ; the definition and data sources for each term are presented below. All of the data used in calculating NANIn are provided in the Supplement (see Part II). Fertilizer (Nchem ) Nchem is defined as the amount of N in yearly N fertilizer application. N fertilizer application including forms of single N fertilizer (such as ammonium nitrate, anhydrous ammonia, ammonium bicarbonate, urea, and miscellaneous forms) Biogeosciences, 12, 4275–4289, 2015
Table 1. Biofixation rate and values used for calculating N fixation in the HRB (kg ha−1 yr−1 ) Type
Symbiotic N fixation Soybeans Peanuts Non-symbiotic N fixation Rice Other non-symbiotic crops
Range of published fixation rate in China (Li and Jin, 2011)
Value used in this calculation
56.9–180 45–100
128.5 (Lu et al., 1996) 95.6 (Zhang et al., 1989)
30–62 15
30 (Du et al., 2010) 15 (Bao et al., 2006; Lu et al., 1996; Yan et al., 2003)
and compound fertilizer (synthetic fertilizers also containing P, K, or other nutrients) were adopted in our estimates. The data were obtained from the annual provincial census (e.g., Statistics, 2010). An average N content of 35 % of compound fertilizer is commonly assumed in China (Li and Jin, 2011) and hence we used this value to calculate the elemental N input of compound fertilizer. Biological nitrogen fixation (Nfix ) Nfix refers to the sum of symbiotic N fixation by cultivation of legume crops and non-symbiotic N fixation by microorganisms in agricultural ecosystem. Biological nitrogen fixation in agriculture land was calculated by multiplying the area of crops in each subunit by published N fixation rates. When estimating symbiotic N fixation by leguminous crops, only soybean and peanut were taken into consideration since they were the most common leguminous crops in our study area. Fixation rates for each of these crop classes were estimated from reviews by Zhang et al. (1989), Lu et al. (1996), and Du et al. (2010). As suggested by Li and Jin (2011) and Du et al. (2010), the N fixation rate used for estimating rice and other non-symbiotic N-fixing crops was 30 and 15 kg ha−1 yr−1 , respectively (Table 1). Atmospheric N deposition (Ndep ) The deposition of ammonia and ammonium is not considered as a new input of nitrogen to a region, based on the idea that transport of these species through the atmosphere generally occurs only over fairly short distances (Prospero et al., 1996; Fangmeier et al., 1994; Schlesinger and Hartley, 1992). Thus, we viewed NHx deposition as a recycling of nitrogen within a region rather than as an additional source of nitrogen to the region. Since NOy comes largely from the combustion of fossil fuels, its deposition needs to be considered as a regional input of nitrogen (Howarth, 1998). China is one of the areas of highest N deposition globally (Galloway et al., 2008), resulting from extensive use of fossil fuels in industry and transportation, chemical fertilizers in agriculture, and the expansion in intensive animal husbandry in the last three decades (Ti et al., 2011). However, there is www.biogeosciences.net/12/4275/2015/
W. S. Zhang et al.: Anthropogenic point-source and non-point-source nitrogen inputs
4279
Figure 2. Diagram of major components of net anthropogenic nitrogen inputs (NANI) and exports from a watershed ecosystem (revised from Swaney et al., 2012). Within a watershed ecosystem there are two kinds of input subsystems: non-point and point systems, with large differences in the modes of N delivery. In the non-point-source system, the pollutants can be added into the river network in indirect routes, such as rainfall–runoff and leaching. In the point-source input system, the pollutants usually are discharged directly into river systems. In this estimate, the N flows with abbreviations (e.g., Nim , Nfix , Nurban ) were included as NANI estimates. The solid blue arrows in the figure represent anthropogenic nitrogen flows, and dashed blue arrows indicate an internal cycle of nitrogen within the watershed ecosystem. The solid red arrows represent the nitrogen flows directly into river systems. The dashed red arrows indicate indirect nitrogen flows.
no systematic nation-wide monitoring network to derive geographical and temporal distribution of the deposition rates. In this study, the data of wet and dry atmospheric N deposition from 2003 to 2010 referred to the simulated results of wet and dry deposition of NOy by the Frontier Research Center for Global Change (FRCGC) (Ohara et al., 2007). The data set of the inventory produces estimates of deposition at a 0.5◦ × 0.5◦ latitude–longitude resolution.
Net food and feed import in rural area (Nr-im ) Net food and feed import (both in urban and rural regions) is usually based on the assumption that imports and exports are determined by the balance of local production and consumption, and thus defined as total N consumption (by livestock and humans) minus total N production (by crops and livestock) (Schaefer et al., 2009). This quantity will be negative (representing an export) when N production exceeds consumption. However, this study subtracted the N consumption by urban inhabitants from net food and feed to avoid double accounting. The amount of net food and feed import that potentially contributes to diffuse pollution in rural regions www.biogeosciences.net/12/4275/2015/
(Nr -im) is calculated as follows: Nr -im = Nselfo + Nselfe − Nharv − Nliv ,
(3)
where Nselfo and Nselfe stand for N consumption by rural inhabitants and livestock, respectively. Nharv stands for N in crops, and Nliv for N in animal products. Human consumption of N in food (Nselfo ) was estimated as the product of nitrogen consumption per capita and the number of rural inhabitants in each subunit. According to research carried out by Wei et al. (2008), nitrogen consumption per capita in rural China is 4.31 kg N yr−1 . Animals are usually fed according to relatively straightforward dietary prescriptions designed for maintaining or gaining weight. Livestock consumption of N in feed (Nselfe ) was calculated by N consumption per individual multiplied by the number of each animal type in each subunit. We chose the values of consumption reported by Han et al. (2014) and the values for the percentage N excreted reported by Van Horn (1998). The parameters along with their sources used to calculate N mass in animal products are presented in detail in Han et al. (2014). The animal N production category includes meat, milk, eggs, etc. We estimated animal N production (Nliv ) by the difference between animal feed consumption (intake) and animal excretion (waste production). Biogeosciences, 12, 4275–4289, 2015
4280
W. S. Zhang et al.: Anthropogenic point-source and non-point-source nitrogen inputs
N in crop products (Nharv ) was estimated from their N contents and total mass of products. Protein rather than N content is usually reported for products, and we assumed N content to be 16 % of protein content (Ti et al., 2011; Jones, 1941). Protein contents for different crops were obtained from the China Food Composition (Yang et al., 2009). The parameters used to calculate N mass in crop products are given in Table 2. 2.2.2
Point sources (NANIp )
Industrial and domestic centralized sewage nitrogen discharge is combined to estimate point-source nitrogen inputs. Environmental census data of 2003–2010, which include data from Chinese environmental protection agencies, were adopted in our estimation. This data set (i.e., the AN generation load and sewage effluent from industrial and urban households) can also be found from the Anhui, Jiangsu, Henan, and Shandong provincial yearbooks. All of the data used in calculating NANIp are provided in the Supplement (see Part III). The total amount of urban domestic and industrial sewage can be calculated from NANIp = (Nurban + Nind ) (1 − Isew Irem-tn ) ,
(4)
where NANIp represents the total nitrogen load from point sources, Nind is N discharged by industrial production, Nurban is N discharged by urban inhabitants, Irem-tn refers the average removal rate by a sewage plant, and Isew is the percentage of sewage effluent that is treated by sewage plants. While the atmospheric deposition of N onto impervious surfaces contributing drainage from urban and industrial areas is also a potential point source of N, preliminary calculations based on estimates of impervious surface area (Sutton et al., 2011) indicated an average contribution of only about 12–18 % of the value of N load generated from Eq. (4), depending upon the extent of sewage treatment assumed. Given the added uncertainty associated with this term, and that its overall effect would be partially canceled by subtracting it from Eq. (2), its potential contribution was not included in this study. Households and industries emit N in wastewater using the same sewerage system (Van Drecht et al., 2009). Thus the calculation of Isew can be obtained from the following equation: Isew =
Wsew , Wind + Wurban
(5)
where Wind and Wurban refer the volume of wastewater generated by industrial production and urban household, respectively; Wsew refers the actual treatment volume by sewage plants. Wsew was obtained from the Nationwide Inventory of Urban Sewage Treatment Facilities (http://www.mep.gov.cn/ gkml/hbb/bgg/201305/t20130508_251788.htm). Wind and Wurban are provided in provincial yearbooks (see Part III of the Supplement). Biogeosciences, 12, 4275–4289, 2015
N discharge from urban residents (Nurban ) was estimated as the product of urban population and average nitrogen consumption per capita. We adopted the data of Wei et al. (2008), who reported that the average N emission per capita by urban inhabitants of China was 4.77 kg N yr−1 ; industrial N discharge (Nind ) was computed as the product of industrial sewage effluent flow (Wind ) and average nitrogen concentration. The average nitrogen concentration in industrial sewage had shown a wide range of values (e.g., 0.87–48.43 mg L−1 , Yang et al., 2003). In this study, we use the mean value of 25 mg L−1 that was reported in Changjiang River basin of China to estimate industrial N discharge (Yan et al., 2010). The average removal rate by a sewage plant (Irem-tn ) shows very large fluctuations depending upon influent load and season (Jin et al., 2014). According to Qiu et al. (2010), the total nitrogen removal rate by different sewage treatment systems in China ranged from 40 to 70 %. We used an average reported value for N removal rate of 60 % since N removal rate of the most common treatment systems (oxidation ditch (OD), anaerobic/anoxic–oxic (AO) process, sequencing batch reactor (SBR), and anaerobic–anoxic–oxic (AAO)) of the HRB was about 55–59 %. We also estimate the amount of AN discharge based on Eq. (4): ANp = (ANurban + ANind ) (1 − Isew Irem-an ) ,
(6)
where ANp represents the total AN load from point sources, ANind is AN load discharged by industrial production, and ANurban is AN load discharged by urban inhabitants. Here, Irem-an refers to the average removal rate of AN by a sewage plant and Isew is the percentage of AN effluent that is treated by sewage plants. ANind and ANurban can be directly found from the yearbooks of Anhui, Shandong, Jiangsu, and Henan provinces. Here Irem-an was set at 70 %, since AN removal rate in most municipal sewage treatment systems was about 10 % higher than total nitrogen removal (Qiu et al., 2010). The calculation of Isew can be found in Eq. (5). 2.2.3
Riverine AN export
AN flux in the outlet of a watershed was calculated from stream discharge and water quality using the LOADEST regression model (Runkel et al., 2004). Stream discharge data were collected automatically at the hydrometric stations (outlet of watersheds) from 2003 to 2010. Water quality data were obtained at the same hydrometric stations. AN was determined in the laboratory following the standard analytical method for water quality (Ministry of Environmental Protection of China, 2002). During 2003–2006, all water quality data were reported at a bimonthly timescale, while after 2007, these data were reported at a monthly timescale. Details on sample collection and laboratory analysis were described in the Huai River Commission (http://www.hrc.gov. cn/). There were very few missing water quality data during the study period (less than 1 % of total). For this analywww.biogeosciences.net/12/4275/2015/
W. S. Zhang et al.: Anthropogenic point-source and non-point-source nitrogen inputs
4281
Table 2. N content of agricultural crop production (Yang et al., 2009). Parameter
Corn
Wheat
Paddy
Potatoes
Cabbage
Orange
Plum
Pear
Apple
Peach
Peanut
Soybean
Protein (%) N (g kg−1 )
8.8 14.08
11.2 17.92
7.4 11.84
1.1 1.76
1.7 2.72
0.8 1.28
0.7 1.12
0.4 0.64
0.2 0.32
0.9 1.44
12.1 19.36
35.1 59.16
Table 3. Average N inputs to Huai River basin during 2003–2010 (mean ± SD, kg N km−2 yr−1 ). Non-point-source N input (NANIn ) Subbasin
NANIn
Fertilizer N (Nchem )
Atmospheric N Biological N deposition(Ndep ) fixation (Nfix )
Food and feed N in rural region (Nr -im)
NANIp
Point-source AN input (ANp )
Total N input (NANI)
Upper Middle Lower Yishusi HRB
22 515 ± 1054 25 871 ± 1548 26 030 ± 440 29 769 ± 1156 26 644 ± 1172
14 766 ± 720 17 655 ± 1231 20 591 ± 1393 21 190 ± 688 18 687 ± 1002
3675 ± 149 5092 ± 228 5535 ± 257 6805 ± 515 5480 ± 273
2288 ± 1825 932 ± 2280 1596 ± 1193 164 ± 1320 576 ± 1825
307 ± 12 521 ± 56 743 ± 97 591 ± 61 542 ± 48
182 ± 16 307 ± 26 391 ± 31 297 ± 18 300 ± 20
22 822 ± 1045 26 392 ± 1053 26 773 ± 471 30 560 ± 1100 27 186 ± 1129
1785 ± 40 2192 ± 23 1511 ± 84 1610 ± 153 1900 ± 61
sis, when a particular month’s data were missing, the missing value was interpolated based on the previous and the following month’s values of the monitoring station. The distribution of monitoring stations is presented in Fig. 1. 2.2.4
Sensitivity analysis
Relative sensitivity (S) of a variable y to a parameter x is evaluated by examining the effect of a change in x on the response of y relative to the baseline value. The sensitivity here is defined as the proportional change in variable y, relative to baseline yb , divided by the proportional change in parameter x, relative to baseline value xb (for example, if a 10 % change in parameter x relative to its baseline results in a 10 % change in y relative to its baseline, then S = 1). Hence, the relative sensitivity of the input terms and parameters of NANI can be obtained from (Hong et al., 2013) S (y | x, xb , yb ) =
(y − yb )xb . (x − xb )yb
(7)
Since the relationship of the parameters tested in this study to NANI is mostly linear, the choice of range of variation (i.e., 5, 10, or 20 %) has little effect on the result of sensitivity analysis. Therefore, we applied a ±10 % change for each of the NANI components and estimated its sensitivity from the resulting proportional change in NANI. 3 3.1
Point-source N input (NANIp )
Results and discussion Nitrogen budgets and geographic differences
N input and its sources in the HRB should be carefully considered, as the HRB is a watershed with one of the highest levels of N inputs in the world (Billen et al., 2013). Our study shows that NANI into the HRB was about 27 186 ± 1129 kg N km−2 yr−1 (mean ± SD) from 2003 to www.biogeosciences.net/12/4275/2015/
2010, about 98 % of which could be potentially contributed to non-point sources, and the remaining 2 % is added to the watershed ecosystem as a form of point source (Table 3). This value was about 5 times the average intensity of NANI reported for mainland China (5013 kg N km−2 yr−1 in 2009; Han et al., 2014) and India (4616 kg N km−2 yr−1 in 2000s; Swaney et al., 2015), 10 times that reported in US watersheds (Hong et al., 2013), and nearly twice that of the Beijing metropolitan region (15 236 kg N km−2 yr−1 averaged during 1991–2007; Han et al., 2011). The results are comparable with previous studies. The N inputs to the administrative provinces of Anhui, Henan, Shandong, and Jiangsu in the HRB were 13 121, 21 090, 18 072, and 24 219 kg N km−2 yr−1 , respectively, for the year 2009 (Han et al., 2014), very close to our results. Fertilizer was the largest non-point-source N to the HRB (68.7 % of NANI), followed by atmospheric deposition (20.2 %), N fixation in croplands (7.0 %), and imported food and feed N (2.1 %). Point-source N inputs accounted for the least part of the input, with the value of 542 ± 48 kg N km−2 yr−1 . The subbasin with the highest input was Yishusi Basin (Table 3), followed by the lower basin. Figure 3 presents an overview of the geographic differences of point and non-point-source N inputs into hydrologic units. NANI to watersheds showed a significant geographic difference across the whole basin. The headwater watersheds tended to exhibit lower N inputs (for example, watershed 1, 2, 3, 14, 15, and 23), while in the “mountain–plain” transition watersheds or plain watersheds, higher N inputs appeared due to stronger effects of human disturbance. N inputs from point sources and non-point sources showed a positive correlation (r = 0.82, P < 0.001), indicating that many watersheds in Huai River have faced the dual risk of contributions from both modes of N delivery. Geographic differences of NANI in individual watersheds were related to watershed characteristics, such as positive correlations with waBiogeosciences, 12, 4275–4289, 2015
4282
W. S. Zhang et al.: Anthropogenic point-source and non-point-source nitrogen inputs
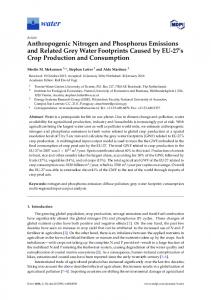
Figure 3. Average net anthropogenic nitrogen inputs and riverine AN flux in the HRB of China.
tershed population density (r = 0.90, P < 0.001), percentage of agricultural land area (r = 0.84, P < 0.001), and percentage of developed land area (r = 0.88, P < 0.001), while it was negatively correlated with percentage of forestland area (r = −0.83, P < 0.001) and watershed average elevation (r = −0.61, P = 0.004), consistent with previous findings (Howarth et al., 1996; Swaney et al., 2012). AN flux in rivers can be observed from Fig. 3. Riverine AN loads ranged from 127 to 31 611 t yr−1 . Correspondingly, area-averaged flux of AN can vary from 116 to 655 kg N km−2 yr−1 . The watershed with lowest AN flux was located at the headwater of Huai River, while the highest (no. 9) was close to the city of Luohe, which was heavily polluted by domestic sources (population density ∼ 635 persons km−2 ) as well as direct discharges of industrial sewage (average rate of treated sewage was just 8 % for 2003–2010). 3.2
AN flux in relation with point-source and non-point-source N inputs
AN flux in this region of high N inputs exhibits positive linear relationships to point source (R 2 = 0.61, P < 0.001), non-point source (R 2 = 0.59, P < 0.001), and total input (R 2 = 0.59, P < 0.001) (Fig. 4). Linear equations which describe the relationship between anthropogenic nitrogen input and nitrogen export were consistent with previous studies, such as Schaefer and Alber (2007) and Swaney et al. (2012), but our result shows that exponential formulas show a better match between NANI and AN (R 2 = 0.73, P < 0.001). This kind of equation also has been reported for other nitrogen forms such as in nitrate (McIsaac et al., 2001) and total nitrogen (Han et al., 2009). Howarth et al. (2012) evaluated the nonlinear effect as a possible threshold below which a smaller fraction of NANI is exported as riverine N flux.
Biogeosciences, 12, 4275–4289, 2015
NANI is computed from atmospheric deposition, fertilizer, and net food and feed import in rural, biological nitrogen fixation, and point-source N input (Fig. 2). Each NANI component contributes to riverine AN flux. Our results indicate that fertilizer application, point-source N input, and atmospheric N deposition have a more direct impact on riverine AN flux, while the biological nitrogen fixation and net food and feed import are not as strongly related across the subbasins (Fig. 4). For all of the 20 watersheds, fertilizer N is the single largest input. Perhaps it is not surprising, therefore, to observe that fertilizer input is significantly correlated with riverine AN flux (Fig. 4e). A more interesting finding is that atmospheric N deposition is also well correlated with riverine AN flux (R 2 = 0.77, Fig. 4f). This result coincides with the findings by Howarth (1998) for the North Atlantic watersheds, and also for 150 watersheds in Europe and North America (Howarth et al., 2012). The underlying reason may be the information conveyed by atmospheric N deposition, since atmospheric deposition originates largely from the combustion of fossil fuels which are associated with both agricultural and industrial production. AN flux is also strongly related to point-source N input (R 2 = 0.61, P < 0.001; Fig. 4c) and point-source AN input (R 2 = 0.68, P < 0.001; Fig. 4d), which is consistent with the conclusion of Xia et al. (2011) that industrial and municipal point-source discharge was also a major pollution source in the HRB. In contrast, biological N fixation has shown a positive but statistically insignificant relationship (P > 0.05) with AN flux (Fig. 4h). Biological N fixation is a relatively small input (accounting for only 7 % of the total NANI). Its role may be easily hidden by other inputs. The influence of net food and feed import was also unclear (Fig. 4g). Although Howarth et al. (2012) indicated that the flux of N in many rivers increases as the net import increases, there was no clear relationship between food import and riverine AN flux in our study. In
www.biogeosciences.net/12/4275/2015/
W. S. Zhang et al.: Anthropogenic point-source and non-point-source nitrogen inputs
4283
Figure 4. Linkage of AN flux with different N sources.
this case, the underlying reason may be due to poor linkages between AN and net food/feed; the organic nitrogen in human and livestock waste may not be consistently converted to AN, and thus may not contribute as a significant source that would be observed if we were considering the total nitrogen (TN) fluxes as has been done previously (Swaney et al., 2012; Hong et al., 2012). The results also indicate that it is possible to construct N source-based models to estimate riverine AN flux, because the major N sources have shown a more direct effect on AN export (Fig. 4). Through use of this simple empirical model, further insight may be provided into how to adjust and balance point-source and non-point-source N inputs to effectively manage human-induced N. Riverine AN flux (RAF) can be predicted well by a linear function (RAF = 0.27 NANIp + 0.0046 NANIn + 51.75, R 2 = 0.66, P < 0.001). Since an exponential formula between nonpoint-source N and AN showed a good fit (Fig. 4b), an exponential model (RAF = 0.14 NANIp + 65.35 exp? (0.000047 NANIn ), R 2 = 0.73, P < 0.001) was developed to test ammonia prediction and resulted in marginally better performance. However, we found that the accuracy of these empirical models is not very high. The underlying reason is probably due to the fact the simple regression equations cannot completely capture the variation in many influential factors of AN export. We discuss some of these factors below and their role in improving our understanding of nitrogen dynamics as a foundation for future exploration of some processbased models. 3.3
Factors influencing AN export
The influence of landscape and climate on riverine TN flux has been addressed in previous studies (Howarth et al., 2006, www.biogeosciences.net/12/4275/2015/
2012; Schaefer et al., 2009; Hong et al., 2012). Our results relating these influential factors to AN flux are also similar to those previously reported for total nitrogen. For example, AN flux showed a positive correlation with watershed average slope (Fig. 5a) and discharge (Fig. 5b), since gentle slopes and low discharge would increase nitrogen residence time in watersheds and ultimately prolong the time for biological N processing in the landscape (Swaney et al., 2012). The role of watershed average temperature in N export is less clear (Fig. 5c). For example, in southeastern US watersheds, temperature was interpreted as a strong explanatory variable in predicting percent N export (Schaefer and Alber, 2007), while in the western US (Schaefer et al., 2009), Baltic Sea basin (Hong et al., 2012), and European watersheds (Howarth et al., 2012), there was no direct evidence that temperature was an important factor controlling N export. Although some studies (Schaefer and Alber, 2007) have suggested that the negative relationship between N export and temperature was due to the effect of increased denitrification rates, there may be an alternative explanation (Swaney et al., 2012) that it is due to correlation of temperature with other indicators such as evapotranspiration. In our study, watershed temperature showed a positive relationship with precipitation (R 2 = 0.62, P < 0.001) and discharge (R 2 = 0.60, P < 0.001), so it is not surprising to find that temperature also showed a positive relationship with percent AN export in our study. The potential role of dams has also been addressed in previous studies (Dynesius and Nilsson, 1994; Nilsson et al., 2005; Schaefer and Alber, 2007). Our result suggests that the number of dams built to fully utilize regional water resources would greatly prolong the nitrogen residence time within aquatic ecosystems, and ultimately decrease the percent AN
Biogeosciences, 12, 4275–4289, 2015
4284
W. S. Zhang et al.: Anthropogenic point-source and non-point-source nitrogen inputs
Figure 5. Regressions between AN export as a percent of NANI (%) and individual independent variables across the subbasins of the HRB (n = 20).
export (Fig. 5d). However, due to highly artificial control and the fact that dams have impacts on both water quantity and quality, other indicators (e.g., volume of dammed reservoirs; Fig. 5e) were not significantly correlated with percent AN export in our analysis. The modes of N delivery would also affect the percent of NANI exported as AN flux (Fig. 5f). High proportions of anthropogenic N from point sources would significantly increase percent AN export because they are directly discharged into streams. The most striking result found in our study was that the percentages of cropland and urban area are negatively correlated with the percent of NANI exported as riverine AN (Fig. 5g and h). One might interpret this to suggest that human activities related to these land uses hinder AN export. This can be misleading, considering that human activities are responsible for introducing reactive N to the region. A possible cause for this relationship is permanent water loss due to consumption (containing N) in irrigation, drinking water, and other uses. According to the Huai River Water Resources Bulletin (MWR, 2010), the amount of permanent water loss (e.g., via evaporation) had increased to 3.942 × 10¹⁰ t, which accounts for nearly 50 % of total water resources (8.596 × 10¹⁰ t) in the region. Therefore, the water consumption by human activities may likely be a very important factor of nitrogen removal due to both physical extraction of N from rivers and increased residence time effects on N retention (Lassaletta et al., 2012). In sum, from our results we can classify the major influential factors of AN export into biological nitrification/denitrification (represented by slope and discharge), water consumption (represented by percentages of cropland and urban area), modes of N delivery (represented by
Biogeosciences, 12, 4275–4289, 2015
NANIp /NANI), and impact of dams (represented by numbers of major dams). However, we acknowledge that other undetermined factors could also partially explain the variation in riverine N export as a percent of NANI, including soil storage, infiltration into groundwater, or errors in accounting due to uncertainties in data and parameters. More comprehensive work should be carried out in heavily loaded watersheds such as this one to determine the roles of these processes in exporting NANI as riverine fluxes. 3.4
Implications for percent TN export
In addition to the AN export, estimation of percent TN export would provide useful information to compare with other watersheds and address more interesting questions regarding the fate of anthropogenic N and the roles of climate and human activities (van Breemen et al., 2002). However, we lack long-term riverine monitoring data of total nitrogen for all the watersheds. In this section, percent TN export was approximated by determining the ratio between AN and TN in some monitoring stations where this information is available and then extrapolating the value of TN from AN. The resulting estimates could contain large uncertainties, since the percentage of AN to TN in rivers is highly dependent on season and pollution sources. Studies from relatively undisturbed watersheds indicated that AN in rivers usually accounts for about 10 % (or even less) of total nitrogen (Li et al., 2009; Singh et al., 2005), while it can be higher than 70 % in urban or heavily polluted rivers in Asia (Li et al., 2014; Pernet-Coudrier et al., 2012). Evidence from the long-term monitoring studies in the mainstream of Huai River revealed that AN was the major form of dissolved nitrogen before 2000 (Mao et al., 2003). However, www.biogeosciences.net/12/4275/2015/
W. S. Zhang et al.: Anthropogenic point-source and non-point-source nitrogen inputs
Figure 6. Sensitivity of major input terms calculated from 27 watersheds in the HRB (mean ± SD). Sensitivities were calculated by applying ± 10 % change in input terms of NANI. We did not test the uncertainty and sensitivity of parameters used in NANIn estimation, since many other similar studies clearly discussed these for all of the parameters (e.g., Swaney et al., 2015; Hong et al., 2013; Sobota et al., 2013).
pollution management, especially in treatment of sewage and other sources of organic pollutants, has greatly reduced the possibility of riverine environments being suitable for the persistence of AN (MWR, 2010). In 2008, riverine nitrate was measured in a study conducted at several stations in the basin, with concentrations ranging from 0 to 15.7 mg L−1 NO3 -N, with a mean of 2.1 mg L−1 NO3 -N (Zhang et al., 2011), suggesting that nitrate is now an important constituent of riverine N flux. In addition, long-term monitoring data of TN, available for three inflow stations of the Hongze, Nansi, and Suya lakes in the HRB show that AN was correlated with TN (P < 0.001), accounting for roughly 20 to 50 % of TN (see Part V of Supplement). Our results found that an average of 0.91 % of NANI was exported from the HRB as AN (Fig. 4a), with flow-weighted average riverine AN concentrations (Supplement Table 7a) ranging from 0.2 to 3.3 mg L−1 N (average ∼ 1 mg L−1 N, about half the average nitrate-N value reported by Zhang et al., 2011). Assuming that this represents 20–50 % of the total, much or all of the remainder is likely made up of nitrate, and TN export in the HRB is about 1.8 %–4.5 % of NANI. The value is comparable with that from a global study from Tysmans et al. (2013), which indicated that the percent TN export in this region is around 0–2 %. While our estimate is far below the average total nitrogen export ratio globally (25 %) (Galloway et al., 2004) and for US watersheds (24 %) (Swaney et al., 2012), N export ratios outside this 24–25 % range have been reported in other parts of the world, possibly because of the various mechanisms dominating N exwww.biogeosciences.net/12/4275/2015/
4285
port in different situations. TN export from the Huron River of Michigan (Bosch and Allan, 2008), the Oldman River of Canada (Rock and Mayer, 2006), and the Jurong Reservoir watershed of China (Kimura et al., 2012) accounted for 8, 1.7, and 1 % of the anthropogenic N input, respectively, relatively close to our observed proportional export. The low values of percent TN export in these systems were explained by their great number of impoundments or water bodies, and relatively low runoff. In the HRB, the riverine export is correlated with high consumption of water resources (containing N) and high impact of the dams and impoundments. Denitrification in river systems is often considered as an important pathway of N removal from watersheds (Seitzinger, 1990, 2002; Billen et al., 2009) and the construction of dams and impoundments could significantly increase the nitrogen residence time within aquatic ecosystems, and thus increase the proportion of N removal through denitrification losses, assuming that nitrate is sufficiently available. The amount could be significant, given that more than 5700 impoundments and 5000 sluices have been constructed in most of the main streams and tributaries of the HRB (Xia et al., 2011). As in other Asian regions (Swaney et al., 2015), irrigation water consumption could be an important factor; the HRB is a very important food-producing region, which produces nearly onefourth of the country’s marketed grain, cotton, and oilseeds on one-eighth of the nation’s farmland (Bai and Shi, 2006). Under such intensive agricultural production, a high amount of riverine N is recycled through irrigation, and is subject to increase in residence times which favor denitrification (Lassaletta et al., 2012). In addition, other factors such as low slope and low runoff in some parts of the watershed (e.g., downstream) also limit NANI exported as riverine N flux (Rock and Mayer, 2006), and storage could be occurring in the soil and groundwater (van Breemen et al., 2002). 3.5
Parameters and sensitivity analysis
Accounting for the point-source and non-point-source components of anthropogenic N input would increase the complexity of its estimation. Since point sources and non-point sources both significantly impact riverine AN flux via different pathways, our anthropogenic N calculation that explicitly estimates the point-source vs. non-point-source contributions could serve as a foundation for further exploration of anthropogenic effects on N pollution. However, considering the fact that some data (such as the percentage of treated sewage (Isew )) used in NANIp calculation are not easily collected, some questions emerge: are the parameters necessary to estimate point-source N input? When we remove the parameters, how does the value of estimated point-source N change? What kind of watersheds would easily be influenced by the removal of specific components? To answer these questions, the main components (Isew , Nind , and Nurban ) in Eq. (4) were each removed one Biogeosciences, 12, 4275–4289, 2015
4286
W. S. Zhang et al.: Anthropogenic point-source and non-point-source nitrogen inputs
Table 4. Percent change in point N input (NANIp ) resulting from component removal. Main components
Percent change in NANIp resulting from component removal (mean ± SD)
Three watersheds with the largest variation in NANIp
Three watersheds with the smallest variation in NANIp
Domestic N discharge (Nurban )
−81 %±0.11
Industrial N discharge (Nind )
−19 %±0.11
Percentage of sewage effluent (Isew )
40 %±0.26
No. 2 (97 %) No. 4 (97 %) No. 1 (94 %) No. 15 (−48 %) No. 9 (−43 %) No. 21 (−29 %) No. 21 (123 %) No. 24 (79 %) No. 12 (61 %)
No. 15 (−52 %) No. 9 (−57 %) No. 21 (−71 %) No. 2 (−3 %) No. 4 (−3 %) No. 1 (−6 %) No. 9 (6 %) No. 15 (12 %) No. 3 (17 %)
at a time to determine the effect of being excluded from the NANI calculation (Table 4). By replacing the values of Nurban , Nind , and Isew in Eq. (4) with 0 one at a time, we found that NANIP was changed by −81, −19, and 40 %, respectively. Obviously, domestic N discharges are important components of NANIp estimation, and show the largest impact on the headwater watersheds (nos. 2, 4, and 1) when excluded from NANIp estimation. Followed by Nurban , estimated NANIp that ignored the role of sewage treatment systems (by setting Isew to 0) would cause a larger error in the watersheds with high point-source discharge and high rate of treated sewage (nos. 21, 24, and 12). The least important component of NANIp estimation is Nind . Removal of Nind would affect the watersheds with high industrial discharge (nos. 15, 9, and 3). We also analyzed the sensitivity of NANI to input sources (Fig. 6), since, as discussed by Hong et al. (2013) and Swaney et al. (2015), determination of the sensitivity of anthropogenic N inputs (both point-source N and non-pointsource N) would help target N management appropriately (e.g., waste treatment vs. fertilizer management) by providing first-order estimates of the relative importance of different sources of N loading to a watershed. For the non-pointsource N component of NANI, by far the most sensitive input term of NANIn in the HRB is fertilizer application, followed by feed N, crop N, atmospheric N deposition, and finally biological N fixation. We found that feed N is the second most sensitive input source to NANIn , indicating that N intake by livestock is a very important N source. Hence, the priority strategies of N management in non-point-source system in the HRB should be focused on the reduction of fertilizer application rate and the control of livestock populations (e.g., reduction of the intensity of livestock breeding, manipulation of dietary N intake by animals, and management of manure). For the point-source N component of NANI, the sensitivity of urban domestic N discharge to NANIp is higher than that of industrial N discharge, indicating that decreased domestic
Biogeosciences, 12, 4275–4289, 2015
N discharge is more important to point-source N management. The result is consistent with a recent government report (Ministry of Environmental Protection of China, 2010) that states urban domestic point-source N input accounts for about 75 % of total load of point source. High sensitivities of N removal rate (Irem-tn ) and treated sewage effluent (Wsew ) suggest that focusing on building more sewage treatment facilities to increase N recycling and improving technology of sewage plants to enhance N removal would be effective management strategies. However, N management should not only be based on the overall anthropogenic N inputs but also on local river water quality and the riverine and management processes affecting it. Including more spatially explicit biophysical details related to the response to N loading is needed to better support N management.
4
Conclusions
This work contributes to existing understanding of humaninduced N pollution by differentiating the common NANI methodology into two parts (point sources and non-point sources of N inputs) and extending the analysis to AN, which has been largely neglected in previous studies. The results for the HRB show that multi-year average (2003– 2010) NANI are 27 200 ± 1100 kg N km−2 yr−1 . N inputs from point sources have been shown to be a much more important explanatory variable of riverine AN export than non-point-source N, although they only account for about 2 % of NANI. By examining the influence of N sources, we found that major N sources, such as fertilizer application, point-source N input, and atmospheric N deposition, directly impacted the AN flux in rivers. This result indicates that a source-based model can be used to predict AN fluxes in rivers. The number of dams appears to be related to AN retention in the watershed, while volume of impoundments shows no www.biogeosciences.net/12/4275/2015/
W. S. Zhang et al.: Anthropogenic point-source and non-point-source nitrogen inputs significant relationship. AN retention could be the result of a combination of factors including biological denitrification and AN sorption onto settling sediment particles (both potentially increased by damming); losses associated with permanent water consumption (including irrigation); and storage in sediments, soils, and groundwater. However, it is difficult to provide better assessments because N removal processes are dependent on the form of N. Monitoring of nitrogen in Chinese rivers has been largely focused on AN, neglecting nitrate and other N species. To better understand the processes of N retention, and to better inform N management strategies, we advocate changes in regional water quality monitoring policy to include more measurement of nitrate and total nitrogen in rivers, in addition to AN. In summary, our results highlight the importance of attributing anthropogenic N inputs to point sources and nonpoint sources since this provides useful information relevant to N management. For the purpose of constructing a more accurate model of riverine N export, future work should address the study of mechanisms which promote or hinder N loss from these anthropogenic sources.
The Supplement related to this article is available online at doi:10.5194/bg-12-4275-2015-supplement.
Acknowledgements. This study was financially supported by the Key Research Program of the Chinese Academy of Sciences (no. KZZD-EW-10-02-3), the 13th Five-Year Plan of Chinese Academy of Sciences (no. YSW2013B02) and State Key Laboratory of Urban and Regional Ecology scientific project (no. SKLURE2013-1-05). The authors wish to express their gratitude to the China Scholarship Council (201408110138) for funding the visiting venture that generated this paper, and to Huai River Basin Water Resources Protection Bureau and Hydrologic Information Center of Huai River Commission for providing water quality and hydrological data. Edited by: T. J. Battin
References Bai, X. and Shi, P.: Pollution Control, in: China’s Huai River Basin: What Lessons for Sustainability?, Environ. Sci. Pol. Sustain. Develop., 48, 22–38, 2006. Bao, X., Watanabe, M., Wang, Q., Hayashi, S., and Liu, J.: Nitrogen budgets of agricultural fields of the Changjiang River basin from 1980 to 1990, Sci. Total Environ., 363, 136–148, 2006. Billen, G., Garnier, J., Ficht, A., and Cun, C.: Modeling the response of water quality in the Seine River estuary to human activity in its watershed over the last 50 years, Estuaries, 24, 977–993, 2001. Billen, G., Thieu, V., Garnier, J., and Silvestre, M.: Modelling the N cascade in regional watersheds: The case study of the Seine,
www.biogeosciences.net/12/4275/2015/
4287
Somme and Scheldt rivers, Agriculture, Ecosys. Environ., 133, 234–246, 2009. Billen, G., Garnier, J., and Lassaletta, L.: The nitrogen cascade from agricultural soils to the sea: modelling nitrogen transfers at regional watershed and global scales, Philosophical transactions of the Royal Society of London. Series B, Biol. Sci., 368, 1–13, 2013. Bosch, N. S. and Allan, J. D.: The influence of impoundments on nutrient budgets in two catchments of Southeastern Michigan, Biogeochemistry, 87, 325–338, 2008. Boyer, E. W., Goodale, C. L., Jaworski, N. A., and Howarth, R. W.: Anthropogenic nitrogen sources and relationships to riverine nitrogen export in the northeastern USA, Biogeochemistry, 57/58, 137–169, 2002. Carpenter, S. R., Caraco, N. F., Correll, D. L., Howarth, R. W., Sharpley, A. N., and Smith, V. H.: Nonpoint pollution of surface waters with phosphorus and nitrogen, Ecol. Appl., 8, 559–568, 1998. Chen, D., Huang, H., Hu, M., and Dahlgren, R.: Influence of lag effect, soil release, and climate change on watershed anthropogenic nitrogen inputs and riverine export dynamics, Environ. Sci. Technol., 48, 5683–5690, 2014. David, M. B. and Gentry, L. E.: Anthropogenic Inputs of Nitrogen and Phosphorus and Riverine Export for Illinois, USA, J. Environ. Qual., 29, 494–508, 2000. Du, W., Ti, C., Jiang, X., and Chen, G.: Balance and pollution potential of nitrogen in a typical rice based agricultural watershed of Yangtze River Delta Region, J. Ecol. Rur. Environ., 26, 9–14, 2010. Dynesius, M. and Nilsson, C.: Fragmentation and Flow Regulation of River Systems in the Northern Third of the World, Science, 266, 753–762, 1994. Fangmeier, A., Hadwiger-Fangmeier, A., Van der Eerden, L., and Jäger, H.-J.: Effects of atmospheric ammonia on vegetation – A review, Environ. Pollut., 86, 43–82, 1994. Galloway, J. N., Dentener, F. J., Capone, D. G., Boyer, E. W., Howarth, R. W., Seitzinger, S. P., Asner, G. P., Cleveland, C. C., Green, P. A., Holland, E. A., Karl, D. M., Michaels, A. F., Porter, J. H., Townsend, A. R., and Vöosmarty, C. J.: Nitrogen Cycles: Past, Present, and Future, Biogeochemistry, 70, 153–226, 2004. Galloway, J. N., Townsend, A. R., Erisman, J. W., Bekunda, M., Cai, Z., Freney, J. R., Martinelli, L. A., Seitzinger, S. P., and Sutton, M. A.: Transformation of the nitrogen cycle: recent trends, questions, and potential solutions, Science, 320, 889–892, 2008. Gao, W., Howarth, R. W., Hong, B., Swaney, D. P., and Guo, H. C.: Estimating net anthropogenic nitrogen inputs (NANI) in the Lake Dianchi basin of China, Biogeosciences, 11, 4577–4586, doi:10.5194/bg-11-4577-2014, 2014. Gu, B., Chang, J., Min, Y., Ge, Y., Zhu, Q., Galloway, J. N., and Peng, C.: The role of industrial nitrogen in the global nitrogen biogeochemical cycle, Sci. Rep., 3, 1–3, doi:10.1038/srep02579, 2013. Han, H. and Allan, J. D.: Estimation of nitrogen inputs to catchments: comparison of methods and consequences for riverine export prediction, Biogeochemistry, 91, 177–199, 2008. Han, H. and Allan, J. D.: Uneven rise in N inputs to the Lake Michigan Basin over the 20th century corresponds to agricultural and societal transitions, Biogeochemistry, 109, 175–187, 2012.
Biogeosciences, 12, 4275–4289, 2015
4288
W. S. Zhang et al.: Anthropogenic point-source and non-point-source nitrogen inputs
Han, H., Allan, J. D., and Scavia, D.: Influence of Climate and Human Activities on the Relationship between Watershed Nitrogen Input and River Export, Environ. Sci. Technol., 43, 1916–1922, 2009. Han, Y., Li, X., and Nan, Z.: Net anthropogenic nitrogen accumulation in the Beijing metropolitan region, Environ. Sci. Pollut. Res., 18, 485–496, 2011. Han, Y., Fan, Y., Yang, P., Wang, X., Wang, Y., Tian, J., Xu, L., and Wang, C.: Net anthropogenic nitrogen inputs (NANI) index application in Mainland China, Geoderma, 213, 87–94, 2014. Hong, B., Swaney, D. P., and Howarth, R. W.: A toolbox for calculating net anthropogenic nitrogen inputs (NANI), Environ. Modell. Software, 26, 623–633, 2011. Hong, B., Swaney, D. P., Mörth, C.-M., Smedberg, E., Eriksson Hägg, H., Humborg, C., Howarth, R. W., and Bouraoui, F.: Evaluating regional variation of net anthropogenic nitrogen and phosphorus inputs (NANI/NAPI), major drivers, nutrient retention pattern and management implications in the multinational areas of Baltic Sea basin, Ecol. Modell., 227, 117–135, 2012. Hong, B., Swaney, D. P., and Howarth, R. W.: Estimating net anthropogenic nitrogen inputs to U.S. watersheds: comparison of methodologies, Environ. Sci. Technol., 47, 5199–5207, 2013. Howarth, R.: An assessment of human influences on fluxes of nitrogen from the terrestrial landscape to the estuaries and continental shelves of the North Atlantic Ocean, Nutr. Cycl. Agroecosys., 52, 213–223, 1998. Howarth, R., Billen, G., Swaney, D., Townsend, A., Jaworski, N., Lajtha, K., Downing, J., Elmgren, R., Caraco, N., Jordan, T., Berendse, F., Freney, J., Kudeyarov, V., Murdoch, P., and ZhaoLiang, Z.: Regional nitrogen budgets and riverine N & P fluxes for the drainages to the North Atlantic Ocean: Natural and human influences, Biogeochemistry, 35, 75–139, 1996. Howarth, R., Swaney, D., Billen, G., Garnier, J., Hong, B., Humborg, C., Johnes, P., Mörth, C.-M., and Marino, R.: Nitrogen fluxes from the landscape are controlled by net anthropogenic nitrogen inputs and by climate, Front. Ecol. Environ., 10, 37–43, 2012. Howarth, R. W., Swaney, D. P., Boyer, E. W., Marino, R., Jaworski, N., and Goodale, C.: The influence of climate on average nitrogen export from large watersheds in the Northeastern United States, Biogeochemistry, 79, 163–186, 2006. Huang, H., Chen, D., Zhang, B., Zeng, L., and Dahlgren, R. A.: Modeling and forecasting riverine dissolved inorganic nitrogen export using anthropogenic nitrogen inputs, hydroclimate, and land-use change, J. Hydrol., 517, 95–104, 2014. Jin, L., Zhang, G., and Tian, H.: Current state of sewage treatment in China, Water Res., 66C, 85–98, 2014. Jones, D. B.: Factors for converting percentages of nitrogen in foods and feeds into percentages of proteins, US Department of Agriculture Washington, DC, 1941. Kimura, S. D., Yan, X.-Y., Hatano, R., Hayakawa, A., Kohyama, K., Ti, C.-P., Deng, M.-H., Hojito, M., Itahashi, S., Kuramochi, K., Cai, Z.-C., and Saito, M.: Influence of Agricultural Activity on Nitrogen Budget in Chinese and Japanese Watersheds, Pedosphere, 22, 137–151, 2012. Lassaletta, L., Romero, E., Billen, G., Garnier, J., García-Gómez, H., and Rovira, J. V.: Spatialized N budgets in a large agricultural Mediterranean watershed: high loading and low transfer, Biogeosciences, 9, 57–70, doi:10.5194/bg-9-57-2012, 2012.
Biogeosciences, 12, 4275–4289, 2015
Li, S. and Jin, J.: Characteristics of nutrient input/output and nutrient balance in different regions of China, Sci. Agricul. Sin., 44, 4207–4229, 2011. Li, S., Cheng, X., Xu, Z., Han, H., and Zhang, Q.: Spatial and temporal patterns of the water quality in the Danjiangkou Reservoir, China, Hydrol. Sci. J., 54, 124–134, 2009. Li, W., Li, X., Su, J., and Zhao, H.: Sources and mass fluxes of the main contaminants in a heavily polluted and modified river of the North China Plain, Environ. Sci. Pollut. Res. Internat., 21, 5678–5688, 2014. Lu, R., Liu, H., Wen, D., Qin, S., Zhen, J., and Wang, Z.: Nutrient cycling and balance of agricultural ecosystem in different typical regions of China. II Parameters of nutrient input to farm land, Chin. J. Soil Sci., 27, 151–154, 1996. Ma, J., Ding, Z., Wei, G., Zhao, H., and Huang, T.: Sources of water pollution and evolution of water quality in the Wuwei basin of Shiyang river, Northwest China, J. Environ. Manage., 90, 1168– 1177, 2009. Mao, J., Zhu, J., and Xiao, J.: The relationship between nitrogen contamination and dissolved oxygen in mainstream of the Huai River, Envriron. Monitor. China, 19, 41–43, 2003. McIsaac, G. F., David, M. B., Gertner, G. Z., and Goolsby, D. A.: Eutrophication: Nitrate flux in the Mississippi River, Nature, 414, 166–167, 2001. McIsaac, G. F., David, M. B., Gertner, G. Z., and Goolsby, D. A.: Relating Net Nitrogen Input in the Mississippi River Basin to Nitrate Flux in the Lower Mississippi River, J. Environ. Qual., 31, 1610–1622, 2002. Ministry of Environmental Protection of China, M.: Environmental Quality Standards for Surface Water (GB 3838–2002), China Environ. Sci. Press, Beijing, 1–9, 2002. Ministry of Environmental Protection of China, M.: 12th five year planning outline for the Huaihe River Basin. http://www.mep. gov.cn/gkml/hbb/bgt/201012/t20101206_198326.htm, 2010. MWR, H. R. C. o.: Water Resources Bulletin of Huai River Basin, Bengbu, 1–32, 2010. Nilsson, C., Reidy, C. A., Dynesius, M., and Revenga, C.: Fragmentation and flow regulation of the world’s large river systems, Science, 308, 405–408, 2005. Ohara, T., Akimoto, H., Kurokawa, J., Horii, N., Yamaji, K., Yan, X., and Hayasaka, T.: An Asian emission inventory of anthropogenic emission sources for the period 1980–2020, Atmos. Chem. Phys., 7, 4419–4444, doi:10.5194/acp-7-4419-2007, 2007. Pernet-Coudrier, B., Qi, W., Liu, H., Muller, B., and Berg, M.: Sources and pathways of nutrients in the semi-arid region of Beijing-Tianjin, China, Environ. Sci. Technol., 46, 5294–5301, 2012. Prospero, J. M., Barrett, K., Church, T., Dentener, F., Duce, R. A., Galloway, J. N., Levy, H., II, Moody, J., and Quinn, P.: Atmospheric deposition of nutrients to the North Atlantic Basin, Biogeochemistry, 35, 27–73, 1996. Qiu, Y., Shi, H. C., and He, M.: Nitrogen and Phosphorous Removal in Municipal Wastewater Treatment Plants in China: A Review, Internat. J. Chem. Engin., 2010, 1–10, 2010. Rock, L. and Mayer, B.: Nitrogen budget for the Oldman River Basin, southern Alberta, Canada, Nutr. Cycl. Agroecosys., 75, 147–162, 2006.
www.biogeosciences.net/12/4275/2015/
W. S. Zhang et al.: Anthropogenic point-source and non-point-source nitrogen inputs Runkel, R. L., Crawford, C. G., and Cohn, T. A.: Load Estimator (LOADEST): A FORTRAN program for estimating constituent loads in streams and rivers, US Department of the Interior, US Geological Survey, 2004. Schaefer, S. and Alber, M.: Temperature controls a latitudinal gradient in the proportion of watershed nitrogen exported to coastal ecosystems, Biogeochemistry, 85, 333–346, 2007. Schaefer, S., Hollibaugh, J., and Alber, M.: Watershed nitrogen input and riverine export on the west coast of the US, Biogeochemistry, 93, 219–233, 2009. Schlesinger, W. and Hartley, A.: A global budget for atmospheric NH3, Biogeochemistry, 15, 191–211, 1992. Seitzinger, S. P.: Denitrification in aquatic sediments, in: Denitrification in soil and sediment, Plenum Press, New York, 301–322, 1990. Seitzinger, S. P., Styles, R. V., Boyer, E. W., Alexander, R. B., Billen, G., Howarth, R. W., Mayer, B., and Van Breemen, N.: Nitrogen retention in rivers: model development and application to watersheds in the northeastern USA, Biogeochemistry, 57, 199– 237, 2002. Shao, M., Tang, X., Zhang, Y., and Li, W.: City clusters in China: air and surface water pollution, Front. Ecol. Environ., 4, 353– 361, 2006. Singh, K. P., Malik, A., and Sinha, S.: Water quality assessment and apportionment of pollution sources of Gomti river (India) using multivariate statistical techniques—a case study, Anal. Chim. Acta, 538, 355–374, 2005. Sobota, D. J., Compton, J. E., and Harrison, J. A.: Reactive nitrogen inputs to US lands and waterways: how certain are we about sources and fluxes?, Front. Ecol. Environ., 11, 82–90, 2013. Statistics, A. B. o.: Anhui Statistical Yearbook, China Statistics Press, Beijing, 2010. Sutton, P. C., Elvidge, C. D., Baugh, K., and Ziskin, D.: Mapping the constructed surface area density for China, Proceedings of the Asia-Pacific Advanced Network, 31, 69–78, 2011. Swaney, D. P., Hong, B., Ti, C., Howarth, R. W., and Humborg, C.: Net anthropogenic nitrogen inputs to watersheds and riverine N export to coastal waters: a brief overview, Curr. Opin. Environ. Sustainabil., 4, 203–211, 2012. Swaney, D. P., Hong, B., Selvam, P., Howarth, R. W., Ramesh, R., and Ramachandran, P.: Net Anthropogenic Nitrogen Inputs and Nitrogen Fluxes from Indian Watersheds: An Initial Assessment, J. Mar. Syst., 141, 45–58, 2015. Ti, C., Pan, J., Xia, Y., and Yan, X.: A nitrogen budget of mainland China with spatial and temporal variation, Biogeochemistry, 108, 381–394, 2011.
www.biogeosciences.net/12/4275/2015/
4289
Tysmans, D. J. J., Löhr, A. J., Kroeze, C., Ivens, W. P. M. F., and van Wijnen, J.: Spatial and temporal variability of nutrient retention in river basins: A global inventory, Ecol. Indicat., 34, 607–615, 2013. van Breemen, N., Boyer, E. W., Goodale, C. L., Jaworski, N. A., Paustian, K., Seitzinger, S. P., Lajtha, K., Mayer, B., van Dam, D., Howarth, R. W., Nadelhoffer, K. J., Eve, M., and Billen, G.: Where did all the nitrogen go?, Fate of nitrogen inputs to large watersheds in the northeastern USA, Biogeochemistry, 57/58, 267–293, 2002. Van Drecht, G., Bouwman, A. F., Harrison, J., and Knoop, J. M.: Global nitrogen and phosphate in urban wastewater for the period 1970 to 2050, Global Biogeochem. Cy., 23, 1–19, 2009. Van Horn, H.: Factors affecting manure quantity, quality, and use, Proceedings of the mid-south ruminant nutrition conference, Dallas-Ft. Worth, 1998, 113–125, 1998. Wei, J., Ma, L., Lu, G., Ma, W., Li, J., and Zhao, L.: The influence of urbanization on nitrogen flow and recycling utilization in food consumption system of China, Acta Ecol. Sin., 28, 1016–1025, 2008. Xia, J., Zhang, Y. Y., Zhan, C., and Ye, A. Z.: Water Quality Management in China: The Case of the Huai River Basin, Internat. J. Water Resour. Develop., 27, 167–180, 2011. Yan, W., Zhang, S., Sun, P., and Seitzinger, S. P.: How do nitrogen inputs to the Changjiang basin impact the Changjiang River nitrate: A temporal analysis for 1968–1997, Global Biogeochem. Cy., 17, 1091, doi:10.1029/2002gb002029, 2003. Yan, W., Mayorga, E., Li, X., Seitzinger, S. P., and Bouwman, A. F.: Increasing anthropogenic nitrogen inputs and riverine DIN exports from the Changjiang River basin under changing human pressures, Global Biogeochem. Cy., 24, 1–14, 2010. Yang, Y., Wang, Y., and Pan, X.: China Food Composition, Peking University Medical Press, Beijing, 2009. Yang, Y. L., X, F. C., and L, Z.: Characteristics of Industrial Wastewater Discharge in a Typical District of Taihu Watershed: A Case Study of Liyang City, Jiangsu Province, J. Lake Sci., 15, 139–146, 2003. Zhang, L., Song, X., Xia, J., Yuan, R., Zhang, Y., Liu, X., and Han, D.: Major element chemistry of the Huai River basin, China, Appl. Geochem., 26, 293–300, 2011. Zhang, S., Wang, Z., Gai, S., Xingwen, M., and Liu, G.: Studied on the absorption of peanut for N fertilizer and the N supplying from soil and nodule bacteria, J. Lai. Agricul. College, 6, 21–27, 1989.
Biogeosciences, 12, 4275–4289, 2015