albumin (A-7030; Sigma Chemical Co., St. Louis, MO. 63187) per liter. ..... Freeh plasma, I mL, was separatedon a column of Sepharose 68 and apo4,opctein A-I ...
CLIN.CHEM.32/2,265-270 (1986)
ApolipoproteinE Quantifiedby Enzyme-LinkedImmunosorbentAssay J. Bury,’ A. Vercaemst,’ M. Rosseneu,’ and F. Belpalre2 specific “sandwich”-type enzymelinked immunosorbentassay in which affinity-purifiedantibodies are used for coating and also for preparing an antibody-peroxidaseconjugateto quantifyapolipoproteinE In serum and in its lipoproteinfractions. This technique is rapid(resultswithin5 h), precise (mean intra- and interassay CVs 4.3 and 8.2%, respectively),accurate, and simple to perform. Sample pretreatmentdid notenhance apo E immunoreactivfty.For47 normolipidemicsubjects,the mean apo E concentrationwas 38.11 (SD 11.1) mg/L. Above-normalape E concentrationswere measured in all typesof hyperlipoproteinemia, especially types Ill and V. Ape E correlated with triglyceride (r = 0.58) and cholesterolconcentrations(r = 0.60). As determined by gel filtration, hypertriglycendemia was associated with a redistributionof ape E towards the triglyceride-richlipoproteinfractions,whichcontained77.1% (SD 16.8%) of total plasma ape E in Fredricksontype V patients,comparedwith 12.5% (SD 6.3%) in normalpersons. We developed a sensitive,
AddItIonal Keyphraeee: lipoproteins perfipidemia heart disease
value
hy-
Since the discovery of apo E by Shore and Shore a decade ago, various studies have focused on the central role of apo E in lipoprotein metabolism (1). Apo E apparently mediates the receptor-specific uptake of chylomicronand VLDLremnants in the liver and plays an important role in the reverse cholesterol transport (1). As the key role of apo E in cholesterol metabolism became better understood, specific immunological assays were developed: radial immunodiffusion (2), electroimmunoasaays (3,4), an immunonephelometric assay (5), radioimmunoassays (6-13), and a competitive enzyme immunoaaaay (14). Because ape E is distributed among lipoproteins that are quite heterogeneous in size, the techniques based either on diffusion, electrophoretic mobility, or light scattering of the antigen-antibody complex have many pitfalls and require pretreatment of hypertriglyceridemic samples (15). The ape E radioimmunoasaays are time consuming and have the obvious disadvantages of isotope handling. We therefore have developed a sensitive and fast assay, based on the “sandwich”-type ELISA technique. We believe that this technique, which can be easily automated, is suitable both for research purposes and for routine use in the clinical laboratory.
‘Department of Clinical Chemistry, AZ. St-Jan, Ruddershove, B-8000 Brugge, Belgium. 2Heynans Institute, Akademisch Ziekenhuis, B-9000, Gent, Belgium.
3Nonstandard abbreviations: ape, apolipoprotein; VLDL, verylow-density lipoproteins; LDL, low-density lipoproteins; HDL, highdensity lipoproteins; DTNB, 5,5’-dithiobis(2-nitrobenzoic acid); HPLC, high-pressure liquid chromatography; ELI8A, enzyme-linked immunoeorbent assay; GdmCl, gusnidinium chloride; and FFA, free fatty acid(s). Received August 29, 1985; accepted October 29, 1985.
Materials and Methods Isolationof Apolipoproteinsand Productionof Antisera The VLDL were obtained by ultracentrifugal flotation from a plasma pool of hypertriglyceridemic patients. After delipidation with ether/ethanol, the ape VLDL was fractionated on a column of Sephacryl 5o as described previously (16). The fractions containing ape E were collected and further purified by chromatofocusing on a 50 x 1 cm column of polybuffer exchanger 94 (Pharmacia Fine Chemicals, Uppsala, Sweden). The column was equilibrated with imidazole HC1 buffer (25 mmollL, pH 7.4, and containing 6 mol of freshly prepared and de-ionized urea per liter), and eluted with polybuffer 74, diluted 1:8 with 6 mollL urea, and adjusted to a pH of 4.0 with 10 mmol/L HC1. To remove pelybuffer and urea from the fractions containing ape E, we precipitated proteins with 60 g/L (final concentration) tnchioroacetic acid in the presence of sodium deoxycholate, as proposed by Bensadoun and Weinstein (17). Ape E was resolubilized in phosphate-buffered isotonic saline, pH 8.0, extensively dialyzed against 5 mmol/L NHHCO3, lyophilized, and stored at -20 #{176}C under nitrogen. We identified the purified ape E by its electrophoretic mobility on isoelectnic focusing in 8 mol/L urea; its elution characteristics from a size-exclusion “high-pressure” liquidchromatographic column under reducing conditions (18); its immunological properties on immunodiffusion with antisera against apolipoproteins A-I, A-U, B, C-U, C-LU, E, and human albumin; and by its amino acid composition, as detailed by Rall et al. (19). Rabbits were immunized by subcutaneous injection of 0.4 mg of ape E, which was dissolved in 0.5 mL of a 5 mmol/L solution of NH4HCO3 and emulsified with an equal volume of Freund’s complete adjuvant (Difco, Detroit, Ml). Booster 0.25-mg injections of ape E in Freund’s complete adjuvant were given at threeweek intervals until reasonable titers were obtained. Animals were bled 10 days after the last injection. Apolipoproteins A-I, A-H, B, and C-LU and their respective antisera were prepared as previously described (16).
Preparation of the Enzyme-Antibody
Conjugate, and
Coatingof the Solid Phase An apolipeprotein E affinity column was prepared by covalent linkage of 3 mg of ape E-dissolved in a solution containing 0.1 mol of NaHCO3, 0.5 mol of NaC1, and 0.1 inol of sodium decyl sulfate per liter-to 1 g of CNBr-activated Sepharose 4B (Pharmacia). Anti-human apelipoprotein E immunoglobuluns, used both for coating and for the enzyme-antibody conjugate, were isolated from rabbit antisera by immunosorbent affinity chromatography as described for ape A-I (20). A modification of the peniodate coupling procedure (20) was used to covalently link 2mg of horseradish peroxidase (EC 1.11.1.7) th4mg of affinity-purified anti-apolipoprotein E immunoglobulins. This conjugate, mixed with an equal volume of glycerol, and stored at -20 #{176}C, was stable for at CUNICAL CHEMISTRY, Vol. 32, No.2, 1986
265
least a year. Polystyrene microtiter plates (flat-bottom micro zuu plates, 129B; Dynatech Lab. Inc., Alexandria, VA 22314) were coated with 10 to 15 pg of purified immunoglobulins pen milliliter of coating buffer, as described for apelipeprotein C-rn (16). Coated plates could be stored at 4#{176}C for at least six months without loss of activity or reproducibility.
Apolipoprotein E Quantification by Sandwich ELISA The sandwich ELISA for ape E was performed as for apolipoproteins A-I and C-LU (16, 20), with the following modifications. Plasma samples and conjugates were diluted 2000-fold and 7500-fold, respectively. All dilutions were made in assay buffer containing 1 g of bovine serum albumin (A-7030; Sigma Chemical Co., St. Louis, MO 63187) per liter. In preparing calibration curves, we used appropriate dilutions of purified apelipopnotein E, the concentration of which we evaluated by quantitative amino-acid analysis. This primary standard was solubiized in a sodium phosphate buffer (10 mmol/L, pH 7.4) containing 0.15 mol of NaCl and 0.1 g of a nonionic detergent, Apovax (Ortho Diagnostics, Beerse, Belgium), per liter. A pool of serum obtained from normolipidemic donors was divided into portions, which were stored at -20 #{176}C and used as a secondary standard and control (15). Standard curves were prepared by plotting the absorbance at 490 nm as a function of the logarithm of the apo E concentrations. Routinely, the results were calculated from the best-fitting least-squares parabola, calculated with a Casio P.C. FP1000 calculator.
Measurementof NonspecificBinding The wells of a microtiter plate were only coated with the carrier protein used in all the buffers in this assay. The coated wells, containing no antibodies to ape E, were further treated as described above. We tested the following proteins: bovine serum albumin (Poviet-grade; Organon Technika, Boxtel, Holland), bovine serum albumin (A-7030, fatty acid and globulin free; Sigma), human serum albumin (Institut Merieux, France), ovalbumin (cat. no. 4542; UCB, Brussels, Belgium), gelatin (Bacto 0143-02; Difco), and casein (Merck, 2244 Darmstadt, F.R.G.).
tive, respectively. Plasma specimens were stored at -20 #{176}C for no longer than three months before analysis. Subjects were classified according to Fredrickson et aL (23). Two children with fasting chylomicronemia, fasting plasma triglycerides >10 g/L, and post-heparin lipoprotein lipase (EC 3.1.1.34) deficiency (FFA, 15 and 12 nmol/min per mL of plasma, normal 50-150 nmol/min per mL) were identified as Fredrickson type I patients. All type U and type N patients were further identified by lipeprotein electrophoresis and had total serum ape A-I/B ratio 0.5 in the VLDL fraction, and an E/E2 phenotype as determined by isoelectric focusing. The severe hypertniglyceridemia expressed by most of the type V patients was secondary to type I diabetes or to chronic alcoholism.
Apo E Distribution Lipoproteins were separated from 1 mL of fresh plasma by gel ifitration on a column of Sepharose 6B-CL (Pharmacia) as described for ape C-LU (16), or from 0.5 mL of plasma by isopycnic centrifugation in a sodium chloride-sucrose gradient (25). Ape A-I and ape B were quantified in all fractions by sandwich ELISA (20) and by immunonephelometry (15), respectively. Lipids were determined enzymatically (25). Ape E was assayed in all fractions by using the ELISA described above.
Results Assay Conditions
The protein concentration of a freshly prepared solution of ape E used as a primary standard was quantified by several techniques: quantitative amino-acid analysis; phenylalanine quantitation by “high-pressure” liquid chromatography after protein hydrolysis (21); protein determination according to Bradford (22), with bovine serum albumin as standard; and absorbance measurements of the pure protein at 280 urn with use of a theoretical absorptivity of 1.296 mL ing’ cni1.
“Checkerboard” titration and testing of the kinetics of the antigen-antibody reaction were performed as described for ape A-I (20). When both the first incubation step (with the antigen) and the second incubation step (with the conjugate) were performed for 2 h at 37#{176}C, the optimal coating concentration was 10 pg/mL at an optimal conjugate dilution of 7500 fold. To prevent loss of ape E from dilute solutions, we used bovine serum albumin as a carrier protein in all dilution buffers (16). Because some albumin preparations caused high nonspecific binding of the anti-ape E-peroxidase conjugate, we compared several carrier proteins, including serum albumin, ovalbumin, gelatin, and casein. The lowest nonspecific binding was with bovine serum albumin from Sigma (A-7030, purified for EU5A) at a concentration of 1 g/L. We further optimized assay precision by blocking any residual binding sites on the microtiter plate with a second coating step, using the same albumin preparation and by using wash buffer containing Tween-20 surfactant (0.5 mLIL) (16).
Subjects
Standardization and Sample Pretreatment
Disodium EDTA-treated plasma (1 g/L) was collected from normal and hyperlipidemic subjects after they had fasted overnight. DTNB (Sigma) 2 mmol, Trasylol (Bayer, Laverkusen, F.R.G.) iO mt. units, and sodium azide 0.2 g, were added per liter as inhibitor of phosphatidylcholinesterol acyltransferase (lecithin-cholesterol acyltransferase,”LCAr; EC 2.3.1.43), protease inhibitor, and preserva-
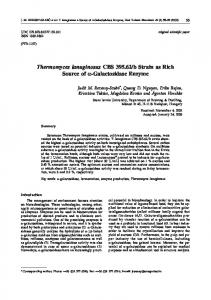
In terms of the quantitative amino acid analysis as a reference technique (100%), the other protein quantification methods yielded comparable results, amounting to 101.5 ± 12.1% for the phenylalanine quantification (n = 3), 125.1% for the Bradford protein assay, and 117.4% for the absorbance measurement at 280 nm. A standard curve constructed with purified apolipoprotein
Standardization
266 CLINICALCHEMISTRY,Vol. 32, No. 2,
1986
E as a primary
trum, Stockholm,
secondary
standard (Figure 1) was used to calibrate standards and control sara. The calibration curves, obtained by use of sera of normolipemic and hyperlipemic (triglycerides 20.4 g/L; cholesterol 5.4 g/L) individuals paralleled the primary standard (Figure 1). Table 1 summarizes the influence of several sample treatments on the ape E immunoreactivity: delipidation with either diisopropyl ether/n-butanol (26) or with ether! ethanol (27) of normo- and hyperlipidemic sera, exposure to denaturing agents [guanidinium chloride (GdniCl) or urea, 4 mol/L] before sample dilution (4, 10, 13), and addition of detergents [sodium decyl sulfate, 5 mmol/L (6-9, 12); sodium dodecyl sulfate, 1 g/L; Tween 20, 0.5 giL; Apevax, 0.1 g/L]. Delipidation did not significantly increase the reactivity of ape E in native serum. In contrast to the delipidation technique proposed by Chain and Knowles (26), the ether! ethanol extraction causes proteins to precipitate, requiring resolubilization in 8 mol/L urea. This might account for the lower analytical recovery of ape E in this procedure. Sample exposure to 4 mol/L GdmCl increased the ape E reactivity by 13.6 ± 0.8% (n = 6), whereas most of the detergents, especially sodium dodecyl sulfate, decreased the ape E inununoreactivity, probably owing to detergent-protein association, which would affect protein conformation. The shape of the standard curve constructed with serum ape E was not modified by the above treatments (Figure 1). Four plasma samples were diluted 1:2 in a chylomicronlike triglyceride microemulsion (Intralipid, 20%; Kabi Vi-
Analytical recovery of ape E, as determined by ELI8A, was 91.0 ± 5.4%. These data therefore suggest that the ape E
E C
3.0
2.0
Sweden)
and incubated
for 1 h at 37#{176}C.
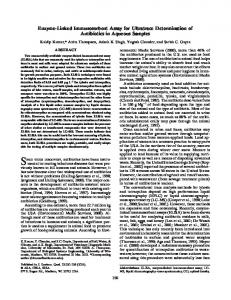
epitopes in native lipoproteins are fully exposed to the polyclonal antibodies used in our ELISA assay, obviating the need for any sample pretreatment. The calibration curves obtained with use of lipeprotein fractions freshly isolated from plasma by sequential ultracentrifugation paralleled the standard curve constructed with use of purified ape E (Figure 2). The curves were identical after lipoprotein delipidation. The VLDL, LDL, and HDL fractions contained, re8pectively, 5.99 ± 2.21 (n = 6), 1.40 ± 0.69 (n = 5), and 1.01 ± 0.56 (n = 6) percent apelipeprotein E by weight, as calculated from the total amount of protein.
Analytical Variables ThissusAissensitivetoaslittleas0.2ngofapoE,witha range of 0.5 to 6 ng. For a 2000-fold dilution this range corresponds to ape E concentrations in serum of 10 to 120 mg/L. The shape of the standard curve fits perfectly a least-squares parabola with a Pearson correlation coefficient of 0.9989 ± 0.0012 (n = 25). We investigated the selectivity of the ELISA for ape E by constructing curves for purified apelipoproteins A-I, A-H, B, C-U, C-Ill2, E, and human albumin. As shown in Figure 2, the cross reactivity of these antigens with anti-ape E immunoglobulins amounted to