Appendix-S2. Differences between correlated random walk ... - PLOS
Recommend Documents
Apr 7, 2016 - April 7, 2016. Abstract. We introduce a family of stochastic processes on the integers, depending on a parameter â [0, 1] and interpolating ...
Jun 6, 2018 - Abstract. We consider a continuous-time random walk which is defined as an interpolation of a random walk on a point process on the real line.
Analyzing Insect Movement as a Correlated Random Walk. RM. Kareiva 1 and N. Shigesada 2. 1 Division of Biology, Brown University, Providence, RI 02912, ...
spacecraft the size of a VW Beetle more than 10 billion .... these sparkignited
explosions are a lot more ... 737 when leaking fuel was ignited by a hot engine.
.... 1575 view from Braun and hogenberg's Civitates Orbis terrarum ..... CSO in
20
spacecraft the size of a VW Beetle more than 10 billion .... these sparkignited
explosions are a lot more ... 737 when leaking fuel was ignited by a hot engine.
.... 1575 view from Braun and hogenberg's Civitates Orbis terrarum ..... CSO in
20
Darkling beetle: Eleodes extricata in grass (Crist et al. 1992). 4 cm. 53.75â¡. 2.42 m (83.3 min). Ground beetle: Pterostichus melanarius (Wallin and. Ekbom 1988).
[8] B.B. Mandelbrot, J. Fluid Mech. 62, 331 (1974). [9] J.P. Kahane and J. Peyri`ere, Adv. Math. 22, 131 (1976). [10] C. Meneveau and K.R. Sreenivasan, J. Fluid.
multifractal models since they do not involve any particular scale ratio. The MRWs are indexed ... stationary multifractal processes or positive random measures. ... tion f(t) are generally characterized by the exponents ζq .... ously using, for ins
Jul 23, 2013 - In the Barabási-Albert model the new vertex will connect to m vertices, where m ..... Mean-field theory for scale-free random networks. Physica A ...
dynamics of a random walk with a purely random multiplicative process to understand how ... condition for the particle number to reach a steady state. We also ... the probability that a pure random walk is at position r on the nth step if it starts a
This paper compiles basic components of the construction of random groups and of the proof of their properties announced in [G10]. Justification of each step, as ...
Fitting of input processes is done using the free available .... simulation framework OMNeT++. In the next .... capacity at station 1 is lost due to transfer blocking.
Aug 16, 2017 - arXiv:1708.04945v1 [cs.DS] 16 Aug 2017. Balanced Allocation Through Random Walk. Alan Friezeâ. Samantha Pettiâ . August 17, 2017.
The random walk algorithm proposed by Grady [1] is a leading method for seeded image segmentation. In this graph-based algorithm, edge weights denote the ...
Apr 14, 2015 - now the most expensive place in the world to hire from a top school. ..... Boston. 249.0. 319.0. 312.6. 3
X s. Ri. Es pi. xpiFis = b. 1 i. Now, to go from patch i to a source s in a two length path we can pass through any patch h (after surviving on it with probability h, so ...
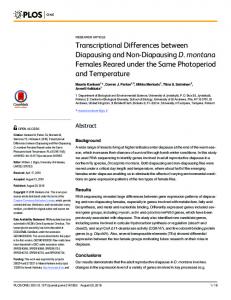
Aug 6, 2013 - In this study we used stool profiling to identify intestinal bacteria and ..... that may be involved in activation of carcinogens and xenobiotic.
Aug 25, 2017 - histology under stereomicroscopy (SM), but dentin aspects under SM ... ography result in similar correlations between ICDAS and histology; SM ...
Aug 29, 2016 - in migratory locusts [68] and to pupal diapause termination in the flesh fly ..... Anders S, Pyl PT, Huber W (2015) HTSeqâA Python framework to ...
Mar 7, 2016 - Bill et al., (2015) could be because we examined different tumor types or ..... Wong SY, Haack H, Crowley D, Barry M, Bronson RT, Hynes RO.
Oct 24, 2013 - Funding: Project funding was provided by the Canadian Institutes of Health Research (CIHR, ... been associated with organismal development [1], contractile phenotypes ... Using our specifically developed analysis software, we extracted
Sep 18, 2017 - 1 Faculty of Veterinary Science, University of Sydney, Sydney, NSW, Australia, 2 Department ... set/flight offset. ... Citation: Kydd E, Padalino B, Henshall C, McGreevy ... when the so-called gyrus was used to train horses [15].
Nov 27, 2012 - Fritz JB, Elhilali M, Shamma SA (2005) Differential dynamic plasticity of A1 receptive ... receptive fields in cat primary auditory cortex. Hear Res ...
Appendix-S2. Differences between correlated random walk ... - PLOS
line in (B)), subsequent directions soon come back to α (blue lines in (A), (C)). In general, the wrapped Cauchy distribution is more strictly concentrated around μ ...
Appendix-S2. Differences between correlated random walk and circular auto-regression and contrasts between the von Mises and the wrapped Cauchy distributions In the case of CRW, once, an orientation far from α is accidentally simulated, an animal will move in that direction for a while, and there is no mechanism for re-orienting towards α. Hence, even the simulation began with θ0 = α (= 0) and used the strictly concentrated von Mises distribution (red line in (B)), sooner or later, simulated θts become distant from α (red line in Fig. S2C) and the trajectory does not move toward α (red line in (A)), even when. In contrasts, in the case of C-AR (w = 0.2), even if an abnormal direction simulated from the less concentrated von Mises distribution (blue line in (B)), subsequent directions soon come back to α (blue lines in (A), (C)). In general, the wrapped Cauchy distribution is more strictly concentrated around μ and has a fatter tail than the von Mises. Therefore, if the sharply concentrated distribution (green (B)) is used, the fatter tail occasionally accepts an abnormal direction (blue line in (C)). Consequently, the apparently different probability distributions (blue vs. pink in (b)) produced similarly moving trajectories (blur vs. in (A)). A
B f (y ) WC(r =0.864)
2
CRW(VM, κ=12) α=0
1
VM(κ=12)
C-AR(WC, r =0.864) C-AR(VM, κ=4)
VM(κ=4) 0
-π
y π
0
C
Direction
π
0
-π
0
10
20 Time step 30
40
50
Figure S2. (A) Examples of simulated trajectories. Speeds were fixed at one. The first 50 paths are shown. The grid unit is 10. (B) The probability distributions used in the three models. (C) The changes in simulated heading directions of the three models. The same colors as (A) are used in (B) and (C).