Data mining techniques that fit the problem are determined. A study has been
made by applying K-means and fuzzy C-means clustering and decision.
International Journal of Computer Applications (0975 – 8887) Volume 4 – No.5, July 2010
Applicability of Clustering and Classification Algorithms for Recruitment Data Mining N. Sivaram
K. Ramar
Research Scholar, Department of CSE National Engineering College Kovilpatti, India
Department of CSE National Engineering College Kovilpatti, India
ABSTRACT Recruitment of appropriate employees and their retention are the major concerns towards creating the competitive strength in the knowledge economy. Every year IT companies recruit fresh graduates through their campus selection programs after examining their skills by conducting tests, group discussion and a number of interviews. The recruitment process requires enormous amount of effort and investment. During each phase of the recruitment process, candidates are filtered based on some performance criteria. Intense analysis on the system indicates that a pattern exists among the candidates selected for an industry. The problem domain is complex and the aspects of candidates that impact the recruitment process is not explicit. In this research, the domain knowledge is extracted through knowledge acquisition techniques. Data mining techniques that fit the problem are determined. A study has been made by applying K-means and fuzzy C-means clustering and decision tree classification algorithms to the recruitment data of an industry. Experiments were conducted with the data collected from an IT industry to support their hiring decisions. Pruned and unpruned trees were constructed using ID3, C4.5 and CART algorithms. From the comparative study, it has been observed that the clustering algorithms are not much suitable for the problem and performance of the C4.5 decision tree algorithm is high. Using the constructed decision trees, discussions were made with the domain experts to deduce viable decision rules.
General Terms Algorithms, Design, Experimentation and Performance
Keywords Recruitment process, Knowledge Engineering, Classification, decision trees, fuzzy C-means algorithm, K-means algorithm.
1. INTRODUCTION The recruitment process is one of the important functions of the human resource department and it is the first step towards creating the competitive strength. Selecting fresh people with high talent and potential retention is challenging and daunting task faced by the industries. The process is complex and involves much of resources and time of the experts and more prominent while any organization hires entry level professionals. Campus recruitment is the predominant mode of recruitment for fresh talented graduates. Because of the inconsistency in the quality of the students produced by different universities and the type of skill set they acquire during their program, selecting the right
candidate among those who graduate becomes a herculean task. The process involves lot of effort by the recruiting team and money spent for the process is phenomenal. One of the mechanisms used by the industries is to conduct tests and group discussions during the filtration process. The selection process uses different criteria that comprise the average of their semester marks, marks obtained in the aptitude, programming and technical tests conducted by the company, group discussion, technical and HR interviews. These criteria are common for all the students, but the skill level of the students vary since they are from different disciplines and backgrounds. With a varying curriculum, mode of delivery and the evaluation methodologies followed in the educational system, the recruitment process becomes much more challenging. The time taken and expenditure for conducting group discussions and interviews consumes more than 90% of the total effort for the recruitment process. It has been observed that 1 among 120 students who apply get selected and the ratio of number of candidates selected against the number of candidates interviewed after tests is approximately 1:20. Reducing these ratios will immensely help the industries to save the effort. Lot of effort is put to analyze the profiles of the applicants to determine the ones that suit the needs of the industry. The knowledge required for this process is not explicit as quantitative numbers but a hidden convention that may be extracted by mining the profiles of previous years and their results. Earlier, people were extracting such complex patterns from data manually but the ever increasing volume of digital data in modern times has provoked research towards more automated approaches. Data mining tools could be designed to answer such business questions, which took traditionally much time to resolve. These tools scour databases for hidden patterns, finding predictive information that experts may miss since such knowledge lies outside their expectations. Data mining is an interdisciplinary field that uses sophisticated data search capabilities and statistical algorithms to discover patterns and correlations in large preexisting databases [1]. A number of machine learning, knowledge engineering, and probabilisticbased methods have been proposed to analyze the data and extract information. The most popular methods include Bayes' theorem, regression analysis, neural network algorithms, clustering algorithms, genetic algorithms, decision trees and support vector machines [1], [2], [6]. Data mining tools assist experts in the analysis of observations of behaviour. Such data are vulnerable to co-linearity because of unknown interrelations. It is factual in data mining that the subset of data being analyzed may not be representative of the whole domain, 23
International Journal of Computer Applications (0975 – 8887) Volume 4 – No.5, July 2010 and therefore may not contain examples of certain critical relationships that exist across other parts of the domain. To tackle this issue, the analysis could be augmented by Design Of Experiment (DOE)-based or choice modeling methods for human-generated data. In such case, during the construction of the experimental design inherent correlations are either forbidden, or removed altogether. In this paper, results of the experiments conducted to cluster the data with the fuzzy C-means clustering and K-means clustering algorithms and classification using decision tree algorithms have been analyzed. Fuzzy C-means clustering is a partitioning method, carried out through an iterative optimization of the objective function. In this method, each feature vector representing the data has a degree of membership in to all the clusters and the algorithm works to minimize an objective function. The K-means algorithm has initially a randomly chosen centre for each cluster and assigns each data in the training set to one of the cluster whose centre is nearest. The algorithm recalculates the centre of the clusters and continues till there is no significant change in the value of centre. K-means algorithm works with an assumption that all attributes are independent and normally distributed. Decision tree is a simple data mining approach used to establish the hidden knowledge in the data for classification and prediction. They have the advantage of easy interpretation and understanding for the decision makers to compare with their domain knowledge for validation and justify their decisions. This study is intended to analyze the issues involved in the recruitment process of fresh graduates, and find out a way to reduce the time and cost involved.
2. BACKGROUND KNOWLEDGE This section provides an overview of the system, upon which the analysis is made and an introduction to the clustering and various decision tree construction methods.
2.1 Selection Process Selecting the right person for the right job is the most important challenge in the human resource management. The various selection methods include analysis of application form, selfassessment, telephone screening and tests depending on the requirement of the industry (such as aptitude, technical, programming, personality, interest test, etc.) [8], [9]. Generally industries use a combination of the selection methods, based on their job nature, cost, time, accuracy, culture and acceptability. According to Lewis, there are three aspects of selection criteria. They are organizational criteria, functional/departmental criteria and individual job criteria [11]. Finally, the recruitment committee must consider the adaptation of the job, departmental and organizational characteristics to the applicant’s characteristics [3], [4]. Hence the recruitment committee designs each level of the recruitment process to reflect their needs. The recruitment process in the campus interviews of an IT industry includes filtering based on their semester marks in the graduation, marks obtained in the aptitude, technical and programming tests conducted by the industry, grade obtained during group discussion and interviews. The company prepares a set of questions to test, if the candidate is really capable of applying what he/she learnt in his/her course of study. The
questions also map to the expectations and job description for which he is recruited. To check his presentation, communication and behavioral skills a Group Discussion is conducted.
2.2 Fuzzy C-means Clustering Integration of fuzzy logic with data mining techniques has become one of the key constituents of soft computing in handling the challenges posed by massive collections of natural data [5]. The central idea in fuzzy clustering is the non-unique partitioning of the data into a collection of clusters. The data points are assigned membership values for each of the clusters and the fuzzy clustering algorithms allow the clusters to grow into their natural shapes [16]. In some cases the membership value may be zero indicating that the data point is not a member of the cluster under consideration. Many crisp clustering techniques have difficulties in handling extreme outliers but fuzzy clustering algorithms tend to give them very small membership degree in surrounding clusters [15]. The non-zero membership values, with a maximum of one, show the degree to which the data point represents a cluster. The points at the centre of the cluster have maximum membership values and the membership gradually decreases when one moves away from the cluster centre. Thus fuzzy clustering provides a flexible and robust method for handling natural data with vagueness and uncertainty. In fuzzy clustering, each data point will have an associated degree of membership for each cluster. Fuzzy C-means clustering algorithm includes two processes, the calculation of cluster centers and the assignment of points to these centers using a form of Euclidean distance. The process is continued till the cluster center stabilizes. The algorithm incorporates the fuzzy set’s concepts of partial membership and forms overlapping clusters to support it. Each data item is assigned a membership value in the range of 0 to 1 for the clusters. Degree of fuzziness in the clusters is indicated by the parameter named as fuzzification (m). When the value of m is equal to 1 the algorithm works like a crisp partitioning algorithm and for larger values overlapping of cluster tends to be more. Membership of each data item is calculated using (1).
j
1 d ji
( xi ) p
k 1
Where cluster
j
( xi )
1 d ki
1 m 1
1 m 1
- indicates the membership of
(1)
xi
in the jth
dji – distance of xi in cluster cj m – fuzzification parameter p – number of specified clusters dki – distance of xi in cluster ck The sum of memberships of a data point in all clusters must be equal to 1. The new cluster centers are calculated using (2).
24
International Journal of Computer Applications (0975 – 8887) Volume 4 – No.5, July 2010 manner [1], [13]. The three methods vary in the splitting criterion used to partition the data. All the three construction algorithms are applied for the problem and are evaluated in this paper.
m
j
cj
( xi ) xi
i j
( xi )
m
i
(2)
The algorithm begins by choosing the number of clusters and fuzzification parameter. Center for all the clusters are chosen randomly. The algorithm continues to update the centre of the clusters till the value stabilizes.
2.3 K-means Clustering K-means is one of the simplest unsupervised learning algorithms for clustering problems. The algorithm aims at forming k clusters of n objects such that the resulting intra-cluster similarity is high but the inter-cluster similarity is low. The algorithm randomly selects k of the n objects and one of them is assigned to each cluster to represent the cluster mean or the center. For each of the remaining objects, an object is assigned to the cluster to which it is most similar, based on the distance between the object and the cluster mean. Then new mean is computed for each cluster and the process iterates until the criterion function converges. A square-error criterion is used and defined as (3) [1]. k
E
p mi
2
(3)
i 1 p Ci
[1]
Arbitrarily choose K points into the space representing the objects that are being clustered. These points represent initial group centroids. [2] Assign each remaining object to the group that has the closest centroid. [3] When all objects have been assigned, recalculate the positions of the K centroids. [4] Repeat Steps 2 and 3 until the centroids no longer move.
2.4 Decision Trees Decision tree is a tree structure, where internal nodes denote a test on an attribute, each branch represents the outcomes of the test and the leaf node represents the class labels. Decision tree induction is the learning of decision trees from class-labeled training tuples. Construction of decision trees is simple and fast, and does not need any domain knowledge and hence appropriate for exploratory knowledge discovery. In general, decision tree classifiers have good accuracy, but successful use of it depends on the data at hand. Decision trees are used for classification and classification rules are easily generated from them. An unknown tuple X can be classified, given its attribute values by testing the attribute values against the decision tree. The general decision tree algorithm takes the training data set, attribute list and attribute selection method as input. The algorithm creates a node, and then applies attribute selection method to determine the best splitting criteria and the created node is named by that attribute. Subset of training tuples is formed using the splitting attribute. The algorithm is called recursively for each subset, till the subset contains tuples of same class. When the subset contains tuples from the same class a leaf is attached with a label of the majority class in the training set from the root. ID3, C4.5, and CART adopt a greedy, non-backtracking approach in which decision trees are constructed in a top-down recursive divide-and-conquer
2.4.1 ID3 algorithm ID3 is an iterative algorithm that uses information gain as splitting criterion to construct the tree. For each attribute A, the method calculates the information gain as the difference between the information required to classify the data set based on just the proportion and the information required to classify after partitioning on A. The expected information needed to classify a tuple in the training set D is given by (4) [1]: m
Info ( D)
pi log 2 ( pi )
(4)
i 1
Where pi is the probability that an arbitrary tuple in D belongs to class Ci, and is estimated as the ratio of number of instances in class Ci in D to the total number of instances in D. The amount of information still required to classify D, after splitting them using A with v possible values is calculated using (5). v
| Dj |
j 1
|D|
InfoA ( D)
Info( D j )
(5)
Information gain obtained by branching the training set on the attribute A is given as in (6). Gain( A)
Info ( D) Info A ( D)
(6)
The algorithm is recursively applied for the subsets till all the members of the set belongs to the same class.
2.4.2 C4.5 Algorithm C4.5 algorithm is a successor of ID3 that uses gain ratio as splitting criterion to partition the data set. The algorithm applies a kind of normalization to information gain using a “split information” value. Split information for an attribute A with v values is defined as in (7) [1],[7]: v
split inf( A) i
| Di | | Di | log 2 | D | | D| 1
(7)
Where |Di| is the number of instances in the training set D with ith value for the attribute A and |D| is the total number of instances in the training set. Gain ratio is defined as in (8) and the attribute with maximum gain ratio is selected as the splitting attribute [1].
Gainratio( A)
Gain( A) split inf( A)
(8)
2.4.3 CART Algorithm CART is a recursive partitioning method that builds classification and regression trees for predicting continuous dependent variables and categorical predictor variables. The fundamental idea is to select each split of a subset so that the data in each of the descendant subsets are purer than the data in the parent subset [10], [12]. Gini index is used to measure the impurity of D, the set of training tuples as given in (9). m
pi2
Gini ( D ) 1
(9)
i 1
25
International Journal of Computer Applications (0975 – 8887) Volume 4 – No.5, July 2010 Where pi is the probability that an instance in D belongs to class Ci and is estimated using (10)
pi
| Ci,D |
(10)
|D|
|Ci,D| is the number of instances in D that belong to category C i and |D| is the total number of instances in the training set. Gini index uses binary split for each attribute, for an discrete attribute A with v known distinct values, P = {a1,a2,a3,…,av}, best binary split is determined by examining all possible subsets of P. For each subset S of P, a binary test of attribute A of the form A S is performed, given an instance I, this test is satisfied if the value of A for I is in S. There are 2 v-2 possible ways, to form two partitions of the data, D, based on a binary split on A, after eliminating the empty set and the set P. For each binary split, the weighted sum of the impurity of each resulting partition is calculated using (11). The gini index of a binary split on A that partitions the training set D into D1 and D2 is
Gini A ( D)
| D1 | Gini ( D1 ) |D|
| D2 | Gini ( D2 ) |D|
(11)
For a discrete valued attribute, the split that gives the minimum gini index is selected as its splitting attribute [1]. For a continuous valued attribute, the point giving minimum gini index is chosen as the split point of the attribute. The set of possible split points are, determined by sorting the values and then by taking midpoint of the adjacent values. Using (11) gini index is calculated for the attribute, where D1 is the set of instances with value of A less than or equal to split point and D 2 is the set of instances with value of A greater than split point. The reduction in impurity incurred by a binary split on a discrete or continuous valued attribute A is given as in (12)
Gini ( A) Gini ( D) Gini A ( D)
independent of the training set used to build the unpruned tree and of any test set used for accuracy estimation. The algorithm generates a set of progressively pruned trees. In general, the smallest decision tree that minimizes the cost complexity is preferred [1], [14]. C4.5 uses pessimistic pruning, similar to the cost complexity method uses error rate estimates to make decisions regarding subtree pruning. However, the method does not use a prune set, instead estimate error rates using the training set [1].
3. Proposed Method The design of the system requires the complete understanding of the problem domain. The data sets and the input attributes are determined through knowledge engineering in an IT industry. The process involves defining the problem, identifying relevant stake holders, and learns about current solutions to the problem. It also involves learning domain-specific terminology, description of the problem and restrictions of it. In this step, interviews were conducted to the domain experts to obtain required information to solve the problem, knowledge extraction was made with the collected information and a knowledge base was built. The knowledge base construction comprises collection of sample data, and deciding which data will be needed in respect to data mining knowledge discovery goals including its format and size.
(12)
The attribute that maximizes the reduction in impurity is selected as the splitting attribute.
2.4.4 Tree Pruning When a decision tree is built, certain branches may reflect anomalies in the training data due to noise which is removed by the tree pruning techniques. The tree pruning techniques uses statistical measures to remove the least reliable branches. Postpruning and prepruing are the two common approaches. In the prepruning approach the tree is pruned by deciding not to further split the subset of training tuples at a given node. Postpruning techniques removes subtrees from a fully grown tree, by replacing a subtree with a leaf labeled as the most frequent class in it. CART uses cost complexity pruning algorithm, a postpruning approach which assumes that the bias in the resubstitution error of a tree increases linearly with the number of leaf nodes. The pruning technique starts from the bottom of the tree. For each internal node, N, it computes the cost complexity of the subtree at N, and the cost complexity of the subtree at N if it were to be pruned, the two values are compared. If pruning the subtree at node N would result in a smaller cost complexity, then the subtree is pruned. This techniques uses a pruning set of classlabeled tuples is used to estimate cost complexity. This set is
Information of the all the applicants for an industry for the past two years were collected by contacting the HR department. Fig 1 shows the steps involved in the mining process. The mining process begins with the step to gather knowledge from the domain experts. Knowledge acquisition is a process that includes elicitation, collection, analysis, modeling and validation of 26
International Journal of Computer Applications (0975 – 8887) Volume 4 – No.5, July 2010 knowledge for knowledge engineering. Some of the important issues involved in knowledge acquisition are the knowledge is hidden within the domain experts and is not with a single expert. Interviews were conducted with the domain experts to understand the problem and the knowledge required to solve the problem. The knowledge acquired is used along with the recruitment database maintained in the industry to form the dataset for experimentation. The data collected from the industry is complex and have noisy, missing and inconsistent data. The data is preprocessed to improve the quality of data and make it fit for the data mining task. The data used are transformed into appropriate formats to support meaningful analysis. Some more attributes are derived using the acquired knowledge to support the mining process. Clustering techniques were applied for the data and decision trees were constructed with different construction methods such as ID3, C4.5 and CART. The data collected contains both nominal and continuous data; hence ID3 algorithm could be applied only after discretization. Numerical data were discretized to multiple intervals manually. The constructed models were reviewed and evaluated before it is used for decision support. The models were evaluated using accuracy as the criteria to assess the performance of the method. Constructive rules were extracted from the technique which had better accuracy.
Clustering techniques were applied with Matlab 7.0 and the accuracy of the clustering techniques is depicted in Table 1 and Table 2. It is observed that clustering techniques have poor accuracy and not suitable for this problem domain due to the nature of the data. Table 1 Results of Clustering algorithms Trained with Dataset1 and Tested with Dataset2 Algorithm used % of Accuracy Fuzzy C-means 52.10 K - means 53.54 Table 2 Results of Clustering algorithms Trained with Dataset2 and Tested with Dataset1 Algorithm used % of Accuracy Fuzzy C-means 63.13 K - means 69.62 Decision trees were built with the datasets using the data mining tool Weka. Decision trees were constructed with one dataset and were used to classify all the records in the other dataset. Table 3 Results of Decision Trees Trained with Dataset1 and Tested with Dataset2 Algorithm used Id3 C4.5 C4.5 Unpruned Cart Cart Unpruned
4. Experimental Results and Discussion The system proposed in this paper has been implemented and evaluated with extensive experimentations on the collected datasets. Accuracy of classification is used as the metric for deciding the best suited model. This section presents the details of the data sets, test results and comparison of them.
4.1 Evaluation Methodology The metric used to evaluate the clustering and classification algorithms is the accuracy. Accuracy is determined as the ratio of records correctly classified during testing to the total number of records tested. The clusters formed were verified for correctness to know the error.
The accuracy of the classifiers are as shown in Table 3 and Table 4, the classifiers were able to identify records of both the categories. Pruned and unpruned trees were constructed using the algorithms. Table 4 Results of Decision Trees Trained with Dataset2 and Tested with Dataset1 Algorithm Used Id3 C4.5 C4.5 Unpruned Cart Cart Unpruned
4.2 Data Sets
4.3 Experimental Results and Discussion
% of accuracy 50.27% 79.12% 78.73% 77.29% 76.57%
85
80
75
70
Accuracy(Percentage)
The details of the applicants to the industry comprising two datasets were used for experimentation. The first dataset includes the details maintained in the first year and consists of 770 records, the second dataset include the details of the second year and consist of 2808 records. From the dataset it is observed, that the dataset consists of more than 95% of records to be in the rejected category. Hence the machine learning algorithms were very excellent in recognizing the rejected data however they were not able to identify selected records to a large extent. Therefore the dataset was premeditated and almost equal number of records in both the categories was used for experimentation. When the records were chosen for the learning process, the distribution of the status in the original data was maintained. The algorithms were trained with records of one dataset and tested with the records in the other dataset.
% of accuracy 45.12% 77.29% 76.73% 72.12% 72.75%
Id3 C4.5 C4.5 U Cart Cart U K-means Fuzzy C-means
65
60
55
50
45
40 Data Set1
Data Set2 Dataset
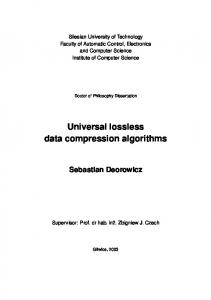
Fig 2 Comparison of the Clustering and Decision Tree Algorithms 27
International Journal of Computer Applications (0975 – 8887) Volume 4 – No.5, July 2010 It was observed that the accuracy of pruned trees was better than unpruned trees. The constructed unpruned trees were used to study the impact of the input attributes. Fig 2 shows the accuracy of the decision tree classifier models when compared to the clustering algorithms using dataset1 and dataset2. It may be observed from Table 3 and Table 4 that Id3 algorithm has a poor performance and the tree constructed with the C4.5 algorithm has better accuracy. Unpruned trees were explored to determine the attributes that impact the recruitment process. Analyses were made with the decision trees and 20 rules were deduced. The deduced rules were checked for viability with the domain experts and used in the recruitment process. Table 5 lists few such deduced rules from decision tree constructed using unpruned C4.5 algorithm. Table 5 Rules Inferred from Decision Trees If Marks_In_Programming > 5 AND Percentage_In_Higher_Sec_School > 90 AND Marks_In_Technical > 35 AND Percentage_In_BE > 70 then Selected If College = X OR College = Y AND Percentage_In_BE > 70 AND Percentage_In_BE < 80 AND Percentage_In_Higher_Sec_School > 90 then Selected If College = not(X) OR College = not(Y) AND Percentage_In_BE > 70 AND Percentage_In_BE < 80 then Rejected If College = X OR College = Y AND Percentage_In_High_School > 90 AND Percentage_In_Higher_Sec_School > 80 AND Percentage_In_Higher_Sec_School < 90 AND Percentage_In_BE>70 AND Percentage_In_BE 90 AND Percentage_In_Higher_Sec_School > 90 AND Percentage_In_BE>90 then Rejected
5. Conclusion The recruitment mining problem has been defined and the problem domain has been studied to extract the knowledgebase required to solve the problem. Datasets have been collected and analyzed to identify the input attributes to be used for the algorithms. Most popular clustering and classification techniques were deployed in solving the problem. It was observed that Fuzzy C-means and K-means clustering techniques are not suitable for this type of data distribution. The three popular decision tree construction algorithms, Id3, C4.5 and Cart have been applied for the problem and it has been observed that trees constructed with C4.5 algorithm has better accuracy. Analysis has been made on the constructed tree to deduce viable rules.
6. REFERENCES [1] Jiawei Han, Micheline Kamber. 2006. Data Mining Concepts and Techniques”, Second Edition Morgan Kaufmann Publishers, San Francisco.
[2] R. Agrawal, A. Arning, T. Bollinger, M. Mehta, J. Shafer, R. Srikant. 1996. The Quest Data Mining System, in Proc. 2nd Int'l Conference on Knowledge Discovery in Databases and Data Mining, Portland, Oregon, 244-249. [3] Chen-Fu Chien, Li-Fei Chen. 2008. Data mining to improve personnel selection and enhance human capital: A case study in high-technology industry, Expert Systems with Application, Elsevier, Vol. 34: 280-290. [4] M. Saidi Mehrabad, M. Fathian Brojeny. 2007. The development of an expert system for effective selection and appointment of the jobs applicants in human resource management, Computers and Industrial Engineering, Elsevier, Vol. 53: 306-312. [5] Sushmita Mitra, Sankar K. Pal, Pabitra Mitra, “Data Mining in Soft Computing Framework: A Survey”, IEEE Transactions on Neural Networks, vol. 13, No. 1, pp. 3-14, 2002. [6] Chung-Kwan Shin, Ui Tak Yun, Huy Kang Kim, and Sang Chan Park, “A Hybrid Approach of Neural Network and Memory Based Learning to Data Mining”, IEEE transactions on Neural Network, vol. 11, No. 3, pp. 637646, 2000. [7] Richard W. Selby, Adam A Porter. 1988. Learning from Examples: Generation and Evaluation of Decision Trees for Software Resource Analysis, IEEE Transactions on Software Engineering, Vol. 14, No. 12, 1743-1757. [8] Flippo, E. B. 1984. Personnel management, McGraw-Hill Inc, U.S. [9] Scarpello, V. G., Ledvinca, J. 1988. Personnel human resources management, South Western publishing company, U.S.. [10] J.R. Quinlan. 1986. Induction of Decision Trees, Kluwer Academic Publishers, Netherlands. [11] Lewis, C.D. 1987. Employee selection, Nelson Thrones Ltd., London, UK. [12] Leo Brieman, Jerome H. Friedman, Richard A. Olshen, Charles J. Stone. 1984. Classification and Regression Trees, Chapman and Hall/CRC, New York. [13] Usama M. Fayyad, Keki B. Irani. 1993. Multi-interval discretization of continuousvalued attributes for classification learning, Thirteenth International Joint Conference on Articial Intelligence, France, 1022-1027. [14] Ron Kohavi, Ross Quinlan. 1999. Decision Tree Discovery, in Proc. International Conference on Data Mining and Knowledge Discovery, Vol. 6, CA, USA. [15] Ying Xie, Vijay V. Raghavan, Praveen Dhatric, Xiaoquan Zhao, “A new fuzzy clustering algorithm for optimally finding granular prototypes”, International Journal of approximate reasoning, vol. 40, pp. 109-124 , 2005. [16] I. Gath, A. B. Geva, “Unsupervised Optimal Fuzzy Clustering”, IEEE Transactions on Pattern Analysis and Machine Intelligence, Vol.11(7), pp. 773-781, 1989.
28