Canadian Science Advisory Secretariat (CSAS) Research Document 2014/063 Newfoundland and Labrador Region
Applicability of the use of visual indicators [presence of Beggiatoa and/or Opportunistic Polychaete Complexes (OPC)] to identify benthic changes due to aquaculture on various substrates Hamoutene, D.1, Sheppard, L.1, Mersereau, J.1, Oldford, V.1, Bungay, T.1, Salvo, F.2, Dufour, S.2, and Mabrouk, G.1 1
Fisheries and Oceans Canada, Northwest Atlantic Fisheries Centre, 80 East White Hills Road, St. John's, NL Canada A1C 5X1 2
Department of Biology, Memorial University of Newfoundland, St. John's, NL Canada A1B 3X9
October 2014
Foreword This series documents the scientific basis for the evaluation of aquatic resources and ecosystems in Canada. As such, it addresses the issues of the day in the time frames required and the documents it contains are not intended as definitive statements on the subjects addressed but rather as progress reports on ongoing investigations. Research documents are produced in the official language in which they are provided to the Secretariat. Published by: Fisheries and Oceans Canada Canadian Science Advisory Secretariat 200 Kent Street Ottawa ON K1A 0E6 http://www.dfo-mpo.gc.ca/csas-sccs/
[email protected]
© Her Majesty the Queen in Right of Canada, 2014 ISSN 1919-5044 Correct citation for this publication: Hamoutene, D., Sheppard, L., Mersereau, J., Oldford, V., Bungay, T., Salvo, F., Dufour, S. and Mabrouk, G. 2014. Applicability of the use of visual indicators [presence of Beggiatoa and/or Opportunistic Polychaete Complexes (OPC)] to identify benthic changes due to aquaculture on various substrates. DFO Can. Sci. Advis. Sec. Res. Doc. 2014/063. v + 17 p.
TABLE OF CONTENTS ABSTRACT ................................................................................................................................ iv RÉSUMÉ ....................................................................................................................................v INTRODUCTION ........................................................................................................................1 THE USE OF DATA FROM MONITORING REPORTS (CAGE EDGE) TO VALIDATE THE APPLICABILITY OF VISUAL INDICATORS (HAMOUTENE ET AL. 2013) .................................2 MATERIAL AND METHODS/STATISTICAL APPROACH ...................................................... 2 RESULTS AND DISCUSSION ............................................................................................... 3 ASSESSMENT OF THE VARIABILITY OF VISUAL INDICATOR COVERAGE WITH DISTANCE FROM CAGE AND WITHIN DUPLICATE TRANSECTS ..........................................6 MATERIALS AND METHODS................................................................................................ 6 Monitoring reports .............................................................................................................. 6 Sampling at finfish sites ...................................................................................................... 7 Statistical analyses ............................................................................................................. 8 RESULTS .............................................................................................................................. 9 Site characteristics ............................................................................................................. 9 Percent coverage of visual indicators with distance from cage ..........................................11 Percent coverage of visual indicators within same direction transects (Part 1 reports) ......13 Presence of visual indicators in relation to fish production levels .......................................13 DISCUSSION ........................................................................................................................13 GENERAL CONCLUSIONS ......................................................................................................15 ACKNOWLEDGEMENTS .........................................................................................................15 REFERENCES .........................................................................................................................15
iii
ABSTRACT Data from sampling conducted on aquaculture sites as well as information extracted from industry monitoring reports were used to evaluate the applicability of using Beggiatoa and OPC as indicators of benthic change due to aquaculture. The first set of data analyzed pertains to monitoring reports completed at cage edge; Beggiatoa and OPC presence were then noted with no assessment of coverage. Changes to the habitat monitoring protocols were implemented in June of 2011 with protocols changing from cage edge sampling to transect sampling (with transects located around the cage array). Data collected via transect sampling were analyzed to search for trends across sites in relation to distance to cage, and to evaluate variability between stations located in the same direction. Beggiatoa and OPC were not present at reference sites and were found to be associated with aquaculture activities. Beggiatoa and OPC presence correlate with known indicators of aquaculture activities such as flocculent presence, offgasing and sulfides (up to a certain concentration). Beggiatoa and OPC were found to decrease with distance from cage though exhibiting patchy distributions. Despite this patchiness, average differences in Beggiatoa and OPC coverage between stations along transects in the same direction were less than 10 %. When transforming data into dummy variables (absence/presence) we found the same trends suggesting that the presence/absence of these organisms could also be used as an adequate trigger to inform on waste deposition at finfish sites.
iv
L’utilisation de la présence de Beggiatoa et des complexes de polychètes opportunistes (CPO) comme indicateurs de changement de l'habitat benthique attribuable à des activités piscicoles RÉSUMÉ Les résultats de nos études, de même que les données extraites des rapports de surveillance de l'industrie, ont été examinés pour évaluer la pertinence de l'utilisation de Beggiatoa et des complexes de polychètes opportunistes (CPO) comme indicateurs de changement de l'habitat benthique attribuable à des activités piscicoles. Le premier ensemble de données analysées a été extrait de rapports de surveillance menée aux quatre coins des cages; la présence de Beggiatoa et de CPO a alors été notée sans évaluation de la couverture spatiale (présence/absence). Des changements aux protocoles de surveillance des habitats ont été introduits en juin 2011, pour passer de l'échantillonnage au bord des cages à l'échantillonnage sur quatre transects autour de l'ensemble des cages. Les données ont été analysées pour déceler des tendances à l'échelle des sites en ce qui a trait à la distance par rapport aux cages et afin d’évaluer la différence entre stations situées dans la même direction. Beggiatoa et le CPO n'étaient pas présents dans les sites de référence. Selon les analyses de l'arbre décisionnel, le Beggiatoa et le CPO réagissent le plus aux activités d'exploitation (référence, niveau de production, mise en jachère) et, dans une moindre mesure, à la profondeur de l'eau et au type de substrat. La présence de Beggiatoa et du CPO est corrélée aux autres variables visuelles, comme la présence de floculant, le dégagement gazeux et le sulfure (jusqu'à une certaine concentration). Les niveaux de Beggiatoa et de CPO diminuent à mesure que l'on s'éloigne des cages et ont une répartition éparse. Malgré cet aspect, les différences moyennes entre les couvertures spatiales des indicateurs (Beggiatoa et CPO) entre les stations le long des transects situes dans la même direction étaient inférieures à 10 %. En exprimant les données sous forme de variables nominales (présence/absence), nous avons noté les mêmes tendances. La présence ou l'absence d'indicateurs pourrait être utilisée comme élément indicateur de l'enrichissement organique benthique et ceci étant donné la variabilité observée dans les valeurs de couverture spatiale.
v
INTRODUCTION Over the past decade, the finfish aquaculture industry has shown significant expansion along the south coast of insular Newfoundland (NL). This area has sheltered bays, coves, fjords, and inlets, offering suitable areas for both caged and suspended gear culture (i.e. shellfish aquaculture). Approximately 90 % of finfish aquaculture sites occur in bays and coves on the south coast of the island, where water depths are greater than 30 m (DFA 2011). The siting requirements include the location of sites at depths greater than 30 m, over hard bottom substrates as these areas were expected to be highly erosional and therefore wastes were not expected to accumulate. In this region, hard and patchy substrates are predominant, and current measurements indicate that most sites have bottom current velocities les than 5.1 cm/s with no or little resuspension of organic wastes. The critical resuspension velocity as identified in a deposition model such as DEPOMOD is set at 9.5 cm/s (Chamberlain et al. 2005). These conditions (hard and patchy substrates, low bottom current) highlight the importance of monitoring waste deposition and the need for a better understanding of bioremediation processes. Conventional parameters, such as sulfides and redox potential used for soft sediment sites, have limitations in deep sites with hard or patchy substrates because of the challenges associated with obtaining sediment grabs (DFO 2005). In addition, extreme depths (> 30 m) at many culture sites on the south coast of NL have dictated the utilization of drop cameras/videos to document benthic changes instead of SCUBA surveys. This visual monitoring method is also used for regulatory purposes (DFO 2005; DFO 2013a, 2013b). Although more than 120 biological and geochemical variables have been used to assess benthic condition near aquaculture sites (Kalantze and Karakassis 2006), none of these indicators have been fully assessed on hard and patchy substrates. Two impact indicators used on soft substrates, Beggiatoa sp. and opportunistic polychaete worm complexes (OPC), may have utility on hard substrates because they are conspicuous and known to occur on hard substrates near finfish sites (Emmett et al. 2005, 2007, 2008). Beggiatoa forms bacterial mats and may be a primary indicator as it occurs at the interface of oxic and anoxic conditions and is typically associated with elevated sulfide levels (Preisler et al. 2007). A comprehensive review of the British Columbia Ministry of Environment (BCMOE) provincial monitoring results collected at 21 active finfish farms under the Finfish Aquaculture Waste Control Regulation (FAWCR) has revealed that colourless, sulphur-oxidizing bacteria (Beggiatoa sp.) are present under or adjacent to finfish farms sited on hard seabeds (Emmett et al. 2005, 2007, 2008). Moreover, several authors (e.g., Weston 1990; Holmer and Kristensen 1992; Crawford et al. 2001) have found that local benthic organic enrichment under fish cages can be detected by the presence of bacterial mats. The second potential indicator, OPC, is frequently observed in areas with organic enrichment and reduced conditions at salmon farms in British Columbia (Brooks 2001). In particular, the proliferation of infaunal polychaetes within soft bottom sediments during periods of high organic input at finfish farms is well known (e.g., Brooks 2001); other epifaunal OPC may show a similar response to organic enrichment and be useful visual indicators atop hard substrates. In NL, a study of monitoring reports (at cage edge) has revealed that Beggiatoa and OPC are valid visual indicators of benthic change due to aquaculture and that they are present on all substrate types (Hamoutene et al. 2013). They have been recommended for regulatory purposes as their presence correlate well with known indicators of aquaculture activities such as flocculent presence, offgasing, and sulfides (Hamoutene et al. 2013). However, the question regarding their usage for the establishment of strict regulatory thresholds remains (Hamoutene 2014). These indicators are also currently used as monitoring tools by DFO in the Pacific region following the transfer of regulatory responsibility from BCMOE to DFO.
1
Results from our studies as well as data extracted from industry monitoring will be examined in this document to evaluate the applicability of using Beggiatoa and OPC as indicators of benthic change due to aquaculture. Data will be analyzed to reveal trends across sites in relation to distance to cage and evaluate variability within stations located in the same transect and/or direction. For some sites, and when production data was accessible, presence of indicators in relation to fish numbers was plotted and discussed.
THE USE OF DATA FROM MONITORING REPORTS (CAGE EDGE) TO VALIDATE THE APPLICABILITY OF VISUAL INDICATORS (HAMOUTENE ET AL. 2013) MATERIAL AND METHODS/STATISTICAL APPROACH The baseline survey was designed to enable both the proponents and the regulatory authorities to make informed decisions regarding site placement and site operation by providing knowledge of the specific seafloor composition prior to the implementation of aquaculture operations. In addition to the baseline information, the current monitoring program requires that video and grab samples be collected not more than two weeks before or two weeks after initiation of a fallow period (referred to as Part 1), and four to eight weeks before the end of a fallow period (referred to as Part 2). Monitoring is conducted by consultants and reports are sent to DFO’s Habitat Protection Division (HPD) as part of the regulatory process. The data used for this study were collected at cage edge, therefore reflecting a near worst case scenario situation. Video records of the seafloor are collected at the four cardinal points of each of the cages (four camera drops) as well as a panoramic continuous footage for at least one minute; each of these points represents a 'station'. When access to the four cardinal points at cage edge is difficult, consultants cover only two points at the cage limit. When sediment presence was indicated by video, triplicate grab samples were collected at each cage location, and redox and sulfide measured and recorded on each sample (DFO 2005). It is important to note that in June 2011, HPD revised this protocol so that sampling occurs along transects rather than just at cage edge (Figure 1). We analysed 26 Baseline reports, 14 Part 1 monitoring reports (post-harvest), and 18 Part 2 monitoring reports (post-fallow). Contrary to expectation, Part 2 reports were sometimes completed before or after more than 12 months post-harvest; fallow periods varied from five to 31 months. We only had corresponding Baseline and Part 1 reports from 10 sites, and corresponding Part 1 and Part 2 reports from eight sites. There was an average of 56.5 ± 30.4 stations (mean ± standard deviation) per site with video recordings in baseline reports used herein, as well as 53.5 ± 26.8 and 47.9 ± 31.7 stations for Part 1 and Part 2 reports, respectively. The data in the video description tables (as found in baseline and monitoring reports) were summarized as described below: •
Flora and fauna (#): mean number of species/taxonomic groups per station (in accordance to the level of detail provided in the table), as no abundances were recorded by the consultants;
•
Flocculent matter (%): data was summarized as the percentage of stations with flocculent matter presence (number of stations with flocculent x 100 / total number of stations);
•
Beggiatoa (%): data was summarized as a percentage of stations with Beggiatoa presence (number of stations with Beggiatoa x 100 / total number of stations);
•
OPC (%): data was summarized as a percentage of stations with OPC presence (number of stations with OPC x 100 / total number of stations);
2
•
Offgasing (%): data was summarized as a percentage of stations with noted offgasing (number of stations with offgasing x 100 / total number of stations); and
•
Substrate type: percentage of presence of the following classes of substrate was determined: bedrock, coarse (boulder, rubble), medium (cobble, gravel), and fine (sand, mud), as described in Wentworth (1922). For every substrate class, percentage was calculated as follows: number of stations with substrate class x 100 / total number of stations.
The data described above were analyzed using: •
Decision tree analyses (DTA): DTA was used to explore trends in the parameters measured (dependent variables) in relation to site conditions (predictors). DTA allows the formulation of relationships between one response (i.e., dependent) variable and several predictor (i.e., independent) variables by dividing a data set recursively into smaller, increasingly statistically homogeneous portions. Exploratory analysis should be applied with no limiting assumptions about data distributions and independence of predictor variables (Breiman et al. 1984). The final result constitutes a division of the original data set into mutually exclusive and exhaustive sub-sets (e.g., Breiman et al. 1984; Quinlan et al. 1987; Biggs et al. 1991; Safavian and Landgrebe 1991; Hamoutene et al. 2008; Hamoutene et al. 2009). DTA was carried out using the procedure described by Breiman et al. (1984). At every level of the tree, stepwise splitting was performed by examining each of the predictor variables in turn, and selecting the predictor resulting in the smallest within-group sum-of-squares for a binary split. The splitting criterion was expressed as a proportional reduction in error (PRE), with a minimum PRE of 0.05 required for a split to result for any given predictor/variable. The PRE constitutes the proportion of variance explained, whereby PRE is evaluated for each node as well as for the entire tree model (Breiman et al. 1984). The procedure supports both continuous and categorical variables. The risk of over fitting was controlled by specifying a minimum number of cases, or stop size, for the creation of new nodes (Puestow et al. 2001). That is, if a given node contained fewer observations than the specified stop size, it was not further partitioned. A stop size of five was selected for all tree models. Dependent variables (i.e., the indicators) that may change with potential aquaculture impact include: flora and fauna, flocculent matter, redox potential, sulfides, Beggiatoa, OPC, and offgasing. Categorical predictor variables used in the analyses include 'report type': Baseline, Part 1, and Part 2. Continuous predictors are: 'depth' and substrate types (4 predictors) as divided in % 'bedrock', % 'coarse' , % 'medium', % 'fine'.
•
One way repeated measures ANOVA and Pearson Product Moment correlation: Comparisons between the parameters measured/assessed through video analyses and grab sampling when applicable (fauna, flora, Beggiatoa, OPC, redox, sulfides, flocculent, offgasing) were completed between Baseline and Part 1 reports (same sites), as well as between Part 1 and Part 2 reports, using repeated measures one-way ANOVAs. Correlations between parameters were also explored using the Pearson Product Moment correlation.
RESULTS AND DISCUSSION In this study, we assumed that data from sites with different production levels and fallow period lengths (not all Part 2 reports were completed after one year of fallow as required) were “equivalent”. Despite differences in conditions (depth, substrate, amount of production, etc.) and sampling dates, sites were grouped into three categories (baseline, Part 1 and Part 2) in order to identify dominant trends, independent of site-specific conditions, and to ensure that indicators
3
such as Beggiatoa and OPC presence were associated with aquaculture operations throughout the year. The decision trees demonstrated that the first and most influential predictor for Beggiatoa, OPC, flocculent matter, offgasing presence, as well as redox and sulfides was ‘type of reports’ and that ‘depth’ and/or ‘substrate type’ had little or no influence on the results (Table 1). Beggiatoa and offgasing were the only indicators that seemed “sensitive” enough to allow the differentiation between the three scenarios: baseline, end of production (Part 1), and end of fallow (Part 2). OPC presence was influenced by depth (second split). However, when comparing the same sites at the end of production and after fallow using one-way ANOVAs (Table 2), OPC presence was higher in Part 1 reports, with a significant decrease after fallow, showing a direct link with aquaculture operations. Table 1. Main predictors and PRE values for decision trees generated for: fauna, flora, Beggiatoa, OPC, redox, sulfides, flocculent, and offgasing. Predictors include: substrate, depth, and type of reports. Parameter Fauna (n=57) Flora (n=57) Beggiatoa (n=57) OPC (n=57) Redox (n=32) Sulfides (n=32) Flocculent (n=57) Offgasing (n=56)
First Predictor and data subdivision Substrate Type of reports (Baseline < Part 1 and 2) Type of reports (Baseline < Part 1 and 2) Type of reports (Baseline < Part 1 and 2) Type of reports (Baseline > Part 1 and 2) Type of reports (Part 1 > Baseline and Part 2) Type of reports (Baseline < Part 1 and 2) Type of reports (Part 1 > Baseline and Part 2)
Second predictors and data subdivision Substrate Substrate
PRE
Type of reports (Part 2 < Part 1)
75.4 %
Depth
69.3 %
Substrate
40.8 %
Substrate
74.0 %
Substrate
87.7 %
Type of reports (Baseline < Part 2) and Substrate
58.8 %
50.8 % 34.4 %
Table 2. Pairwise comparisons between parameters (fauna, flora, Beggiatoa, OPC, redox, sulfides, flocculent, and offgasing) under different site conditions (Baseline, Part 1, Part 2). P-values are the result of repeated measures one-way ANOVAs; statistically significant (P < 0.05) values are in bold. Parameter Fauna Flora Beggiatoa OPC Redox Sulfides Flocculent Offgasing
Baseline-Part 1 comparison (n=10 sites) P = 0.232, no differences P = 0.007, Baseline < Part 1 P < 0.001, Baseline < Part 1 P < 0.001, Baseline < Part 1 P = 0.012, Baseline > Part 1 P = 0.016, Baseline < Part 1 P < 0.001, Baseline < Part 1 P = 0.022, Baseline < Part 1
Part 1- Part 2 comparison (n=8 sites) P = 0.077, no differences P = 0.576, no differences P = 0.004, Part 1 > Part 2 P = 0.008, Part 1 > Part 2 Not enough data points Not enough data points P = 0.084, no differences P = 0.399, no differences
Significant positive correlations were found between flocculent presence and offgasing, as well as Beggiatoa, OPC, and sulfides (Table 3). No significant correlations were found between any of these indicators and redox potential values. In a report on the sediment physicochemical characteristics at seven salmon farms, Brooks (2001) found that sediment redox potential and free sulfides were negatively correlated, with Pearson correlation coefficients between -0.87 and -0.75. Similar results were also reported by Wildish et al. (1999). In this report, the absence of
4
significant correlation with redox potential might be due to the low numbers of observations (no grabs), as well as the inherent variability in measurements of sediment redox potential (e.g., Hargrave et al. 1993; Wildish et al. 1999). Monitoring and baseline reports revealed also that Beggiatoa and offgasing were absent in reference sites, though OPC was present (albeit rarely) on the benthos in areas where there was no aquaculture activity. After considering average sulfide values associated with Beggiatoa and OPC presence on sites (n=24), the mean sulfide concentration was 2894.7 ± 1813.8 µM (749 to 7016 µM) corresponding to oxic B to anoxic conditions as per Hargrave et al. (2008). Average redox value was -258.4 ± 159.4 mV (-407 to 412 mV) when Beggiatoa and OPC were found on sites (n=8). More detailed analyses (at the station level) are necessary to characterize the sulfide and redox thresholds corresponding to Beggiatoa and OPC presence. Table 3. Correlation coefficients between parameters as explored using Pearson Product Moment correlation (after Bonferroni adjustment, significance is at P < 0.002). Significant correlations are in bold. Correlation Fauna Flora Flocculent Offgasing Redox Sulfides Beggiatoa
Flora 0.179 * * * * * *
Flocculent -0.073 0.219 * * * * *
Offgasing -0.077 0.102 0.679 * * * *
Redox -0.031 -0.170 - 0.462 -0.481 * * *
Sulfides -0.322 0.079 0.832 0.625 - 0.436 * *
Beggiatoa -0.016 0.389 0.894 0.538 -0.430 0.747 *
OPC 0.047 -0.005 0.740 0.416 -0.188 0.632 0.606
No differences were found between reports (Table 2) with respect to mean numbers of taxonomic groups (i.e.: an evaluation of richness), and a strong influence of substrate was found after the application of DTA. However, the absence of abundance/count data in the video tables precluded an accurate assessment of epibiotic diversity. Surprisingly, values for flora in Baseline reports were lower than in Part 1 and Part 2 (Table 2). This might be due to the fact, as cited above, that abundance was not evaluated, and that presence/coverage of many algae would be recorded the same as a single individual. Considering that video sampling is the primary tool used for monitoring in the NL region, it would be useful to obtain counts/abundance of fauna or flora identified in videos to ensure a better characterisation of the benthic populations (this was completed in the protocols used after this). Baseline values for redox potential and sulfides indicate that some sites (50 % of sites investigated in this study) would already be considered post-oxic or slightly hypoxic, as defined by Hargrave et al. (2008), even before the commencement of aquaculture activity. Sulfides at reference locations away from fish cages were < 300 µM, while concentrations at farm sites varied from 150 to 5000 µM S2- (Hargrave et al. 2008). The measurements collected in sites at harvest (Part 1) correspond to the values described by Hargrave et al. (2008) at production sites, though it is worth noting that Part 2 reports revealed persistent hypoxic conditions (median of 1820.9 µM) even after fallow, with OPC and Beggiatoa still present on most sites. Sediment chemical remediation following removal of salmon from culture cages has been defined as the return of organic and redox potentials to reference levels associated with a reduction of sulfides to values less than 960 µM (Brooks and Mahnken 2003). Our data suggest that, despite a fallow period, sites still show hypoxic conditions and the presence of indicators of organic enrichment such as Beggiatoa, OPC, flocculent matter, and offgasing. Variation in the duration of the fallow periods precluded any conclusions on trends. Beggiatoa and OPC were not found in reference sites and are visual indicators of aquaculture effect on the benthos independently of substrate type. They can be used for regulatory
5
purposes and correlate well with known indicators of aquaculture activities such as flocculent presence, offgasing and sulfides. Our results suggest that benthic hypoxic conditions may exist in some sites prior to aquaculture activities. This report highlights the importance of collecting counts/abundance of fauna and flora in order to better evaluate epibiotic richness.
ASSESSMENT OF THE VARIABILITY OF VISUAL INDICATOR COVERAGE WITH DISTANCE FROM CAGE AND WITHIN DUPLICATE TRANSECTS As stated previously, improvements and changes to the habitat monitoring protocols were implemented in June 2011. In particular, the protocol was changed from cage edge sampling to transect sampling (3 transects around the cage array (Figure 1). A better quantification of OPC and Beggiatoa presence is completed through the evaluation of percent coverage using a frame of 50 cm x 50 cm as a reference. Counts/abundances of fauna and flora are recorded in order to better evaluate epibiotic richness. All the results discussed below pertain to a transect approach in site monitoring.
MATERIALS AND METHODS We processed visual sampling data extracted from habitat monitoring reports (9 Part 1 reports as well as video data we collected at 13 aquaculture sites. General characteristics of the sites are provided in Table 1, 2, and 3.
Monitoring reports Underwater video is collected along transects extending from the cage edge at each corner of the cage array. Transect sampling follows a tiered approach with underwater video completed at 10 m intervals starting at the cage edge (0 m) and continuing for a maximum of 50 m from the edge (Figure 1). Sampling is often discontinued after 30 m from cage edge if no changes are visually detected in the benthic conditions. Sampling is generally not completed at stations >100 m in depth. Video footage is recorded using a custom built (Falkjar) underwater video camera powered by NTSC operational system mounted to an aluminum frame (50 cm x 50 cm) on a 90° angle pointing vertically at the seafloor. Live video footage is recorded on a JVC camcorder and GPS coordinate positions are overlain onto the video through use of a Sea-Trak Video Overlay system by SeaViewer. The video observation tables listed in the monitoring reports include the following information: GPS coordinates, depth (m), substrate type (categorized based on the Wentworth scale), a list of species/groups of fauna and flora present. Still images of the video footage are captured and Image J software is used to determine percent coverage of substrate type, Beggiatoa, and OPC. Flora and fauna groups are counted or described as: prevalent, some, few, or rare. Flora (coralline algae and seaweed) and fauna: echinoderms (feather star, brittle star, sea urchin, sea star); molluscs; sponges; soft corals; and anemones are counted as described in the list of NL species documented so far (DFO 2013a). Due to some differences in data reporting, the classification for the different variables was standardized to ensure the same level of detail is provided. Specifically, percentages for flocculent material were sometimes not reported; in these instances, values were assigned depending on the descriptors available in the table (100 % when flocculent was the only substrate type reported; 50 % if another substrate was cited; and 33 % or less if more than one substrate was observed). For this study, 9 Part 1 reports were analysed. Time of year when sampling was completed was variable across sites.
6
Figure 1 – Sampling design used for monitoring reports: Part 1 (after two years production). Variability evaluation (as described below) using percent coverage values of all stations in duplicate transects.
Sampling at finfish sites Video collection protocols used by our team are similar to those used today by industry for monitoring purposes (DFO 2013b). Two different sampling campaigns were completed. The first sampling (July-August 2010) was extensive and allowed a comprehensive coverage of lease areas with a higher surface area covered at every camera drop. The second one (July to September 2011 and June to August 2012) mimicked the point source approach used for monitoring protocols with the same surface area covered at every camera drop (50 cm x 50 cm) (DFO 2013b). The collected video data was summarized in table format with the following information: GPS coordinates, depth (m), substrate type, and counts of species/groups of fauna and flora present as described above. Substrate was reported as percentage of each type observed. Similarly to Beggiatoa, OPC, and flocculent matter, flora, such as coralline algae and seaweed, were recorded as a percentage of bottom cover by defining regions of interest by hand using Image J (DFO 2013b). No coverage of flocculent matter was evaluated for the first sampling completed in 2010. July-August 2010 Underwater video was collected in July and August 2010 on 5 finfish (Atlantic salmon, Salmo salar) aquaculture sites. Video sampling was performed along 6 transect lines at each site: three parallel to, and three perpendicular to the coastline (Figure 2). Along each transect, sampling stations were spaced by 50 m, and the number of sampling stations per site varied according to the spatial extent of the lease. Each video recording lasted at least 1 minute. The benthic area covered during each video recording varied between stations due to movement of both the camera and boat (drift) and represented on average 3.02 ± 0.31 m2 (coefficient of variation of 10.26 %). The surface covered was considered as equivalent allowing us to group all observations for data analyses. No video collection took place in depths in excess of 100 m.
7
Sample Stations 50 m
Cages Cage Area
Figure 2 – Sampling design for data collected at finfish aquaculture sites in July-August 2010 (Example for one site, not all transects had the exact same pattern depending on lease areas).
July to September 2011 and June to August 2012 Video data were collected at 8 finfish (Atlantic salmon) aquaculture sites using the new protocols established for industry monitoring reports; however, the transect lines were longer (160 m with stations 20 m apart) and fewer (3) on a per site basis (Figure 3). A reference site was also sampled with no cage presence. Three transects were completed per site with two oriented parallel and one oriented perpendicular to the cage array (Figure 3). Stations were typically not sampled if water was too deep (>100 m), or if located too close to shore. The collected video data was collected similarly to what is described above.
Sample Stations 20 m
Cages Cage Area
Figure 3 – Sampling design for data collected at finfish aquaculture sites from July to September 2011 and from June to August 2012.
Water column speed and direction were collected and analyzed at some sites using moored ADCP (Acoustic Doppler Current Profilers) in model A2 SUBS system and data are provided for information.
Statistical analyses In addition to stating general site characteristics, percentages of stations with indicators on sites are calculated (Table 1, 2, and 3). Mean percent coverage of all stations (as determined by
8
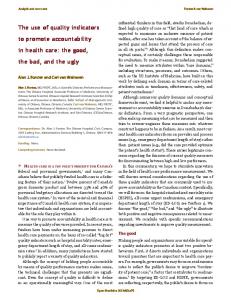
ImageJ) of Beggiatoa, OPC, and flocculent material (all values) is plotted to visualize distribution with distance from cages for the 2011 and 2012 data set (Figure 4). Correlations between percent coverage (Beggiatoa, OPC and flocculent) and distance from cage are explored using Pearson Product Moment and Spearman Rank (for data not normally distributed). Data were arcsin square root transformed prior to statistical analyses, but this transformation showed no effect on results. Arcsin square root transformation is necessary when a sizeable number of the observed proportions are either relatively small (P < 0.2) or large (0.8 < P < 1); if most of the computed proportions lie between 0.2 and 0.7, it should have little impact on the results (Snedecor and Cochran 1980). Percent coverage data were also transformed in dummy variables (0: absence, 1: presence) to explore data correlation with distance from cage (Pointbiserial correlation). This was completed for sites sampled in 2010, 2011 and 2012 as well as Part 1 reports. For sampling completed in 2010 some stations were located below cages; distance to cage was considered as zero for all these stations.
120 100 Distance vs Flocculent Distance vs Beggiatoa Distance vs OPC
Percent coverage
80 60 40 20 0 -20 -40 0
20
40
60
80
100
120
140
160
180
Distance from cage (m)
Figure 4 – Mean percent cover of Beggiatoa, OPC, and flocculent material with distance from cages (m) using data extracted from eight Newfoundland aquaculture sites (after one year production in 2011 and 2012). N varies from 21 to 27 stations for every distance from cage.
Data from monitoring reports (Part 1) were used to assess differences between duplicate transects (same distance from cage and same direction). Transects in the sites considered for this study were separated by an average distance of 160 m (40 to 450 m). Beggiatoa and OPC percent coverage differences are calculated by subtracting values from stations at equal distance from cages and belonging to transects in the same direction (as per Figure 1). Means and standard deviations of these differences are calculated for both Beggiatoa and OPC coverage.
RESULTS Site characteristics An overview of the general characteristics of sites (sampled sites, and Part 1 reports) is provided in Tables 4, 5, and 6. Percentages of stations with indicators were calculated in order to give an overview of Beggiatoa, OPC and flocculent presence on sites. Production length and fallow periods in months are also provided in the tables. When production values were available
9
to us, numbers of fish stocked on sites are added to the tables. All sites have a mean depth above 30 m with a variety of dominant substrates across sites. Table 4- General characteristics of the sites sampled in 2010. Site #
N
Depth range (m)
% St. with Beggiatoa
% St. with OPC
% St. with Floc.
1
32
15-88
3.0
6.1
7.40
2
32
17-54
2.0
0.0
29.63
3
42
10-80
0.0
14.3
52.00
4
48
7-67
14.6
8.3
45.00
5
27
6-93
29.6
18.5
17.65
Dominant substrates Fine, Bedrock Fine, Coarse Fine, Medium Fine Fine, Medium
# of cages
# Fish Stocked
Prod. Time in months
16
881,822
4
10
1,000,000
4
6
387,000
16
6
607,000
13
9
269,000
25
St.: stations, Floc.: flocculent, Prod.: Production, N=number of stations per site.
Table 5- General characteristics of the sites sampled in 2011 and 2012 (one year production). Site #
N
Depth range (m)
%St. with Beggiatoa
% St. with OPC
40-49
37.04
3.70
% St. with Floc. 7.40
6
27
7
27
24-60
48.15
22.22
29.63
8
25
77-117
44.00
20.00
9
20
46-138
35.00
10
17
62-141
11
20
12 13
Dominant substrates
# of cages
# Fish Stocked
10
919,816
16
498,964
12
52.00
Sand, Cobble Sand, Cobble Sand
Prod. Time in months 12
10
971,169
15
0.00
45.00
Bedrock
6
630,983
12
76.47
5.88
17.65
6
793,208
14
46-138
30.00
30.00
25.00
12
403,000
13
44
21-72
9.09
0.00
6.82
16
530,000
12
32
22-55
9.37
0.00
15.62
11
383,000
12
Boulder Sand, Cobble Sand, Cobble Silt/Mud
St.: stations, Floc.: flocculent, Prod.: Production, N=number of stations per site.
Current velocities were available only for sites #6 and #10 with a mean (depth-averaged) current velocity of 6.33 cm/s and 6.02 cm/s, respectively. Bottom velocities (average of 1 m at the bottom) are equal to 5.1 cm/s for site #6 and 2.9 cm/s for site #10.
10
Table 6- General characteristics of the sites described in the Part 1 monitoring reports. Site #
N
Depth range (m)
% St. with Beggiatoa
% St. with OPC
% St. with Floc.
14
28
35-65
64.28
0.00
7.14
15
33
43-85
18.18
0.00
0.00
16
35
18-60
31.43
22.86
22.86
17
32
24-61
9.37
6.25
6.25
18*
21
30-54
23.81
0.00
0.00
19
36
16-48
47.22
2.78
2.78
20
38
40-100
26.32
55.26
55.26
21
34
28-45
29.41
0.00
0.00
22
50
12-63
28.00
30.00
30.00
Dominant substrates Silt/Mud, Cobble Silt/Mud Silt/Mud, Cobble Silt/Mud, Cobble Silt/Mud, Cobble Silt/Mud, Cobble Silt/Mud, Bedrock Silt/Mud Silt/Mud, Gravel
# of cages
# Fish Stocked
Prod. Time in months
16
521,000
23
10
300,000
24
6
495,720
26
12
317,000
23
7
n/a
31
6
n/a
23
6
905,092
24
14
520,000
25
16
310,000
28
*cod site, St.: stations, Floc.: flocculent. N=number of stations per site.
Water current data was only collected in the vicinity of site #16, where a mean value of 2.98 cm/s and a bottom current of 2.1 cm/s were obtained. The length of production for sites described in Table 2 was around 2 years though some sites had longer production cycles as described in monitoring reports.
Percent coverage of visual indicators with distance from cage Mean percent coverage at stations located at the same distance from cages was calculated and plotted for each visual indicator. Data for the 8 sampled sites in 2011-12 are presented in Figure 4. All three indicators declined in percent cover with distance from the cage. Beggiatoa was observed as far as 160 m from the cages while OPC was generally not observed beyond 80 m. Flocculent material occurred within 100 m of the cages. Standard deviations (SD) of means (across sites and transects) represent variability across sites and stations located in different transects/directions, but at a similar distance from cages. For all data (2010, 2011-12 sampling and Part 1 reports) coefficients of variation for all stations across sites and transects (SD/mean x 100) increased with distance from cage for all three visual parameters and all data (from 70 % to 450 %). Overall, Beggiatoa, OPC and flocculent are negatively correlated with distance from cage though correlation coefficients are low and comprised between -0.189 and 0.528 (Tables 7, 8, 9). These values are equivalent after transformation of data in dummy variables (values between brackets). Statistically significant correlations are observed between Beggiatoa presence, OPC and flocculent (all pairwise correlations except that OPC and Beggiatoa are not always correlated, especially when considering percent coverage).
11
Table 7- Correlation coefficients and associated probabilities (Spearman rank order) between distance and percent coverage (first line) or presence/absence (values between brackets) of Beggiatoa, OPC, and flocculent. For Part 1 monitoring reports, n = 307 stations. Floc. Part 1 -0.095, P=0.097 (-0.104), P=0.070
Beg. Part 1 -0.189, P