CHINESE JOURNAL OF ANALYTICAL CHEMISTRY Volume 43, Issue 5, May 2015 Online English edition of the Chinese language journal
Cite this article as: Chin J Anal Chem, 2015, 43(5), 765–774.
REVIEW
Application and Progress of Single Particle Aerosol Time-of-Flight Mass Spectrometry in Fine Particulate Matter Research CAI Jing1, ZHENG Mei1,*, YAN Cai-Qing1, FU Huai-Yu1, ZHANG Yan-Jun1, LI Mei2, ZHOU Zhen2, ZHANG Yuan-Hang1 1
State Joint Key Laboratory of Environmental Simulation and Pollution Control, College of Environmental Sciences and Engineering, Peking University, Beijing 100871, China 2 Atmospheric Environment Institute of Safety and Pollution Control, Jinan University, Guangdong 510632, China
Abstract: The idea of single particle aerosol mass spectrometry was first proposed in the 1970s and then developed quickly in recent two decades. Because it can simultaneously provide much information including particle size distribution, composition of multiple chemical species and mixing state for each single particle with high-time resolution, single particle aerosol mass spectrometry has been widely applied in the area of environmental monitoring and fine particulate matter research. This review aims to (1) provide an introduction of the development history and progress of single particle aerosol time-of-flight mass spectrometry, (2) summarize its principle, methods for data analysis, output of results and its applications in environmental measurement and research using two major commercialized instruments (ATOFMS and SPAMS), and (3) provide suggestions for future research. Key Words:
1
Single particle aerosol mass spectrometry; Fine particulate matter; On-line source apportionment; Review
Introduction
Regional air pollution has become more serious with rapid economic growth in China. Frequent hazy weather and serious air pollution episodes have attracted great attention in China and abroad. The invention and development of aerosol measurement techniques especially on-line measurements have enhanced our understanding of the characteristics of aerosols and atmospheric pollution[1]. On-line aerosol mass spectrometry has been widely deployed because of its high time resolution and low detection limit. There are mainly two types of online aerosol mass spectrometry, one for bulk measurement and the other for single particle measurement. Aerosol mass spectrometer (AMS), aerosol chemical speciation monitor (ACSM) and thermal desorption chemical ionization mass spectrometer
(TDCIMS) are in the category of on-line aerosol bulk measurement instruments. Particles are first vaporized by heating and then ionized by different ionization methods such as electron impact, chemical ionization and optical ionization. On the contrary, aerosol time-of-flight mass spectrometry (ATOFMS) and single particle aerosol mass spectrometry (SPAMS) are two commercial single particle instruments which can measure size distribution, chemical composition and mixing state of single particle at the same time[2]. In this paper, the basic principle, data processing methods and outputs of the two commercial on-line single particle aerosol time-of-flight mass spectrometers, ATOFMS and SPAMS were introduced. Main research and application areas of on-line single particle time-of-flight mass spectrometry (single particle aerosol mass spectrometry for short in following text) were also summarized with suggestions for future research direction.
________________________ Received 9 August 2014; accepted 12 November 2014 *Corresponding author. Email:
[email protected] This work was supported by the National Natural Science Foundation of China (Nos. 41121004, 21191150) and the State Key Joint Laboratory of Environment Simulation and Pollution Control, College of Environmental Sciences and Engineering, Peking University of China (No. 13L02ESPC). Copyright © 2015, Changchun Institute of Applied Chemistry, Chinese Academy of Sciences. Published by Elsevier Limited. All rights reserved. DOI: 10.1016/S1872-2040(15)60825-8
CAI Jing et al. / Chinese Journal of Analytical Chemistry, 2015, 43(5): 765–774
2
Development of single particle aerosol mass spectrometry
Friedlander[3,4] proposed that ideal aerosol instrument could measure the size, chemical composition and shape of every single particle simultaneously. At the beginning stage, researchers[5,6] tried to use metal filament (e.g. rhenium and tungsten) to vaporize and ionize aerosol. By this way, chemical composition of single particle was measured. In the 1980s and 1990s, with the rapid development of techniques such as laser, time-of-flight chamber, and ion trap and so on, the on-line single particle aerosol mass spectrometry technique had great progresses. In 1996, Prather et al[7] invented aerosol time-of-flight mass spectrometry (ATOFMS). The invention and later commercialization of ATOFMS made this technique widely applied in the atmospheric science and many other fields.
3
3.1
Introduction of commercial single particle aerosol mass spectrometry Operation principles
The basic operation principle of single particle aerosol mass spectrometry is that atmospheric aerosols are first induced into ion source region, then vaporized/ionized, and finally detected by a detector[5]. Specifically, atmospheric particles are first converged to a very narrow particle beam by converging nozzle or aerodynamic lens system. After size measurement, every single particle is vaporized/ionized to charged fragments and finally detected by time-of-flight chamber and micro channel plates (MCPs) detector. As the commercial single particle aerosol mass spectrometers, ATOFMS and SPAMS include four major systems: vacuum system, aerosol sizing system, ionization system and mass spectrometry detection system[8]. Aerodynamic lens and high energy laser ionization system are deployed in both two commercial single particle aerosol mass spectrometers. Detailed operation principles and parameters can be seen in Prather[7] and Li et al[9,10]. 3.2
Calibration methods
The calibration of single particle aerosol mass spectrometry includes size and mass calibration. Size calibration is to assure the accuracy of size measurement. Polystyrene latex spheres (PSLs) with standard size (0.2, 0.3, 0.5, 0.72, 1.0, 1.3 and 2.0 µm) are generated through atomization and then induced into spectrometer. Mass calibration, including calibration with standard materials or ambient air, is to assure the accuracy of mass spectra of particles. Standard materials or ambient air are induced into SPAMS to calibrate the shift of the mass to charge ratios (m/z) of some fragments in spectrum (e.g. 23Na+, 39 + 208 K , Pb+, 46NO2–, 62NO3–, 97HSO4–).
3.3
Methods for data analysis
Direct extraction and clustering analysis are the two main methods to analyze the single particle data. 3.3.1
Direct extraction of physical and chemical properties of single particles
Particle size affects the deposition velocity and residence time in the air. SPAMS and ATOFMS can be used to analyze aerosol sample and provide size distributions of particles in accumulation mode. The measurement range of particle size is 0.2–2.0 μm for SPAMS and 0.1–3.0 μm for ATOFMS. Moreover, ultrafine ATOFMS can measure nucleation mode particles in the size range of 50–300 nm[11,12]. Particle counts and relative areas for certain components can be obtained by some specific spectra analysis. Particle counts are used to show the number of particles containing some specific fragments, while relative area is to reflect the intensity of certain fragments. Thirty-minute is often chosen as the time resolution to obtain reliable and representative data. Response of individual species varies in SPAMS due to the difference in ionization energy of components and matrix effects. For instance, K+ could be 5 times more sensitive than Na+[13]. Furthermore, fragments with the same m/z might be from different ions. As a result, to minimize the interference from other ions, signal intensity, stable isotopes and oxidants of specific components are often considered together when identifying particles containing certain ions. For example, fragments of m/z ‒79 might be from Br–, PO3– or other ions, so only fragment with high signal of m/z ‒79 and ‒81 at the same time is identified as bromine containing particles to reduce the interference of PO3–[14]. Furthermore, because more than one fragment can be produced when a standard is analyzed or ionized by single particle aerosol mass spectrometry, till now there is no unified standard way to identify a specific chemical species. Taking nitrate for example, with m/z 30[15], 62[16], 30 or 46 or 62 or 108[17] were all used to identify whether a particle contains nitrate or not. Fu et al[18] summarized the ways to identify sulfate, nitrate, ammonium, EC and OC containing particles and found that it was very method-dependent. Thus, it is quite important to consider the method differences in determining certain components and to choose the best method when analyzing raw data from single particle aerosol mass spectrometry. 3.3.2
Particle clustering analysis
With such a large dataset, particles can be classified into different types on the basis of the similarity of their spectra. Typical ion clustering and algorithm clustering are two major methods for particle clustering analysis. As for clustering with typical ions, certain particles with specific fragments are selected
CAI Jing et al. / Chinese Journal of Analytical Chemistry, 2015, 43(5): 765–774
and defined as a certain cluster. For instance, Liu et al[19] defined particles with typical ions of Al, Fe, H, Li, Ca, CaO as dust particles, while particles with EC and OC fragments such as [Cn]+/– or [C3H]+ were defined as carbonaceous aerosol. Moreover, various algorithms were also used to cluster particles by the similarity of spectra of particles, such as ART-2a, K-means, K-medians and Fuzzy clustering[20]. As for ART-2a analysis, the similarity of one cluster could be adjusted by defining vigilance factor and learning rate. The lower the vigilance factor is, the less the similarity of particles in one cluster would be. Therefore, it is very important to choose appropriate vigilance factor and learning rate to ensure the similarity of one cluster and at the same time the total number of clusters remains small. In previous studies, learning rate was generally set as 0.05, while the vigilance factor would vary from 0.4 to 0.85. To reduce the similarity of different clusters, most researchers chose 0.8 or 0.85[21–23]. After primary analysis by ART-2a, some clusters could be combined into a certain source type or into a type due to some specific chemical process. The basic clustering principle and process of K-means are very similar to that of ART-2a. However, total cluster number is required specially by users as input when using K-means method. Previous studies indicated that the results of ART-2a and K-means were comparable[24]. In general, typical ion clustering is much easier while algorithm clustering is more complicated with more knowledge and experience required. 3.4
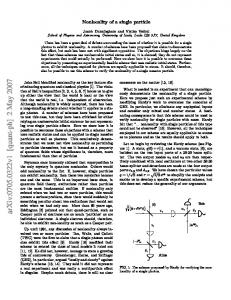
those in urban areas are complicated. The maximum frequency of pulse laser is 20 Hz for ATOFMS and for SPAMS[25,26]. Continuous on-line measurement produces huge dataset (e.g. 104–106 particles per day were usually detected by SPAMS in urban area of Beijing). Specific softwares are needed to analyze and process such a large dataset from ATOFMS and SPAMS. Until now, open source software includes Yet Another ATOFMS Data Analyzer (YAADA) and Environmental Chemistry through Intelligent Atmospheric Data Analysis (Enchilada)[20–27]. Data analysis and outputs are similar by using these two softwares. The difference is that YAADA needs to run in Matlab while Enchilada does not. YAADA is thus more convenient for programmers, while Enchilada is more suitable for general users. Data processing of single particle aerosol mass spectrometry is shown in Fig.1.
4
Application of single particle aerosol mass spectrometry
Single particle aerosol mass spectrometry can provide particle size distributions and temporal variations of particle components semi-quantitatively with high time resolution and has the potential for on-line source apportionment. As a result, it has been widely used in atmospheric and aerosol research. 4.1
Characterizing physical and chemical properties of aerosol
Software for data analysis 4.1.1
The compositions of fine particles in ambient air especially
Semi-quantification of fine particle and its composition
Fig.1 Flowchart of data processing for single particle aerosol mass spectrometry
CAI Jing et al. / Chinese Journal of Analytical Chemistry, 2015, 43(5): 765–774
With the applying high-energy laser (the laser energy of SPAMS is usually set at 0.1–1 mJ while ATOFMS is at 1.0–1.5 mJ), single particle aerosol mass spectrometry can not only be used to measure water-soluble ions and organic matter, but also non-refractory species such as EC and metals. Many metals, such as Al, Ba, Cr, Cu, Fe, Mn, Pb, Sb, V, Zn etc., were detected by using ATOFMS[13,28–30]. SPAMS was used to measure Li, Ca, Cu, Fe, Mg, Pb, V, Zn and SiOx[31,32]. Single particle aerosol mass spectrometry was used for measuring water-soluble ions including Ca+, K+, Mg+, Na+, NH4+, Br–, Cl–, F–, HSO4–, NO2–, NO3–, PO2–, PO3–, SO42–, EC: [Cn]+/[Cn]– (n = 1–13)[33–36], OC including hydrocarbons, carbohydrate (e.g. levoglucosan), PAHs, alcohols, terpene, phenols, ketone, trimethylamine, nicotine etc., and elements including Al, As, Ba, Ca, Ce, Cr, Cs, Cu, Fe, K, Li, Mg, Mn, Mo, Na, Ni, Pb, Pt, Rb, Sb, Se, Si, Ti, U, V, Zn, Zr[33,34,36‒38]. 4.1.2
Quantification of major components in particulate matter
This is quite a challenge for SPAMS to measure aerosol and its components quantitatively due to factors such as matrix effects, unsteady laser energy and incomplete ionization. However, it is possible to convert particle numbers to PM mass concentrations by calibrating with aerosol particle sizes (APS) and under some assumptions (e.g. assuming all particles as homogenous spheres). In previous studies, microorifice uniform deposit impactor (MOUDI) and APS were used to calibrate the size distributions of ATOFMS and compared the calibrated PM concentrations with those measured by beta attenuation monitor (BAM), dust aerosol monitor (DAM) and tempered oscillating microbalance (TEOM)[39,40]. Particle compositions have impacts on various particle properties including health, hygroscopic growth and radioactive forcing. After calibrating particle sizes, the mass concentrations of sulfate, nitrate, ammonium, EC and OC obtained by ATOFMS were compared with those by AMS, gas-particle ion chromatography (GPIC), monitor for aerosols & gasses in ambient air (MARGA) and other online/offline aerosol component measurement instruments[38–40]. In general, quantification studies of metals using ATOFMS and SPAMS are very few and limited. To improve its quantification for metals, it is quite necessary to conduct more comparison studies of single particle aerosol mass spectrometry with other online/offline metal measurement methods such as X-act (Automated multi-metals monitor) and ICP-MS (Inductively coupled plasma mass spectrometry). In summary, single particle aerosol mass spectrometry is appropriate for measuring multiple species including non-refractory metals with high time resolution (< 30 min), resulting in its wide application in environment monitoring. 4.2
Source profiles and source apportionment studies
Identifying and quantifying sources of atmospheric particles is important in haze problems due to high particle concentration in China especially in urban areas. Major source apportionment methods include emission inventory, receptor model and air quality model[41]. Traditional receptor model usually requires long and complicated sampling and time consuming chemical analysis, making it difficult to obtain particle and its source information within short period of time. To some extent, single particle aerosol mass spectrometry is complementary to traditional source apportionment methods. 4.2.1
Source profiles established with single particle aerosol mass spectrometry
Source profiles present the emission characteristics of various sources. Shortly after single particle aerosol mass spectrometry was invented, researchers started establishing source profiles of particles by using ATOFMS. Silva et al[42], for instance, measured automobile exhausted using ATOFMS in 1997. Many other source profiles such as biomass burning, sea salt, dust, cigarette, stove, fireworks and pesticides were also established by ATOFMS[12,25,44–51]. The source profiles of different source categories are summarized in Table 1. In general, the source profiles for important sources in China such as coal combustion, construction dust and cooking are still in lack. Thus it is very essential to establishing single particle source profiles of major source types in China for future source apportionment research using single particle aerosol mass spectrometry. 4.2.2
Source apportionment
Source apportionment by single particle aerosol mass spectrometry is carried by first clustering all particles detected and then determining possible sources or chemical processes of these major clusters based on their spectra. There are two major methods for the source apportionment: typical ions and algorithms. Major sources identified by this instrument and signatures used for identification are listed in Table 2. Besides all source apportionment methods above-mentioned, positive matrix factorization (PMF)-ATOFMS method is also developed in recent years. Particles can be first classified by ART-2a or K-means method and then served as input into the PMF model. For instance, Healy et al[54] classified all particles by K-means first and then obtained 6 factors including auto exhaust, sea salt, long range transport, combustion, solid fuel combustion and ship exhaust by PMF. Another method is to take raw data (signal intensity) of single particle aerosol mass spectrometry directly as input into the PMF model. For instance, Giorio et al[24] chose 106 major m/z ratios and their abundance as the input of PMF model. To our best knowledge, single particle aerosol mass spectrometry-PMF method is not as commonly used as AMS-PMF, especially for SPAMS.
CAI Jing et al. / Chinese Journal of Analytical Chemistry, 2015, 43(5): 765–774
Table 1 Source profiles of different source categories by single particle aerosol mass spectrometry Source categories
Typical ion
References
Gasoline
Combustion: Benzo[a]pyrene [C20H12]+, Benzo[ghi]perylene [C22H12]+, Coronene [C24H12]+, [PO2]–, [PO3]– Catalysts: [Ce]+, [Mo] +, [Pt]+
Diesel
[Ca]+, [Ca2O]+, [Na]+, [PO2]–, [PO3]–, [H2PO4]–/[HSO4]–, [Cn]+, PAHs
Automobile
+
+
+
+
+
+
+
[42,43]
[42–47]
+
Soil dust
[Al] , [Ca] , [Fe] , [K] , [Li] , [Mg] , [Na] , [Ti] , [C]–, [H]–, [OH]–, [F]–, [Cl]–, [NO2]–, [NO3]–, [PO2]–, [PO3]–, [SiO3]–, [HSO4]–, [AlSiO4]‒
Sea salt
[Na2]+, [Na2Cl]+, [Na2Cl]+, [K]+, [K2]+, [K2Cl] +, [KCl2]–, [K2O]+, [K(NO3)2]+, [K2CN]+, [K2CNO]+, [K3SO4]+, [Na]+, [Pb]+, [CN]–, [Cl]–, [NO2]–, [NO3]–, [OH]–
[49–51]
Biomass burning
[Cn]+/–, [CHO2]–, [C2H3]+, [C3H]+, [C2H3O2]–, [C3H3O2]–, [C4H2]+, [CN]–, [CNO]–, Levoglucosan ([C3H3O2]–, [C2O4H]–)
[52,53]
Cigarette
[CN]–, [CNO]–, Nicotine +
+
+
[48]
[21] +
+
+
+
–
–
–
–
–
[K] , [K2Cl] , [K3SO4] , [Na] , [Cn] /[CnHn] , [C2H3O] , [KCl2] , [NO2] /[NO3] , [SO3] /[HSO3] , [SO4]–/[HSO4]–, [Cl]–, [Cn]–, [CN]–/[CNO]–
Coal combustion Wood
[K2Cl]+, [K3SO4]+, [PO2]–, [C2H3]+, [C2H3O2]‒, methoxyphenol, PAHs, [PO3]–, [Cn]–, [CNO]–
Straw
[K2Cl]+, [K3SO4]+, [PO2]–, [PO3]–, [CNO]–, [C2H3]+
[54]
Stove
[44,45]
Table 2 Major sources identified by single particle aerosol mass spectrometry and signatures used for identification. Sources categories
Methods Algorithm clustering
Typical Ion ART-2a K-means
Biomass burning Typical ion
Dust
Algorithm clustering
ART-2a
Typical ion Algorithm clustering
ART-2a
Sea salt Typical ion Automobiles
Algorithm clustering
ART-2a
Ship exhaust
Algorithm clustering
K-means
Coal combustion
Algorithm clustering
ART-2a K-means
[K]+, OC ([CH3]+, [C3H+], [CN−], [C2H3]+, [C2H5]+, [C2H3O]+), EC ([C]+/– [C2]+/–…[Cn]+/–), [HSO4]– [Cn]+/–, [K]+, [Na]+, [NO2]–, [NO3]– [K]+, [K2Cl]+, [K3SO4]+, [C2H3]+/[NCH]+, [Cn]+/‒, [C3H]+, [C4H2]+/[C3N]+, [K(NO3)2]–, [CN]–, [CNO]–, [CHO2]–, [C2H3O2]– [Al]+, [Ca]+, [Ca2O]+, [CaO]+, [(CaO)2]+, [CaOH]+, [(CaO)2H]+, [Fe]+, [K]+, [Li]+, [Mg]+, [Na]+, [Na(H2O)]+, [Ti]+, [TiO]+, [AlO]−, [AlO(OH)]−, [AlO2(OH)]−, [Cl]‒, [FeO2]−, [HSiO3]−, [NO2]-, [O]−, [OH]−, [PO2]−, [PO3]−, [SiO2]−, [SiO3]−, [Si2O2]−, [CN]−, [CNO]− [Al]+, [Ca]+, [Ca2O]+, [Fe]+, [H]+, [Li]+ [K]+, [Na]+, [Na2Cl]+, [Na235Cl]/[Na237Cl]+, [Na2O]+, [Na2OH]+, [HNO3]+, [Na3SO4]+, [35Cl]‒, [37Cl]‒, [NO2]‒, [NO3]‒ [Ca]+, [K]+, [Mg]+, [Na]+, [Na2]+, [NaO]+, [Na2O]+, [35Cl]–, [37Cl]–, [CN]–, [NO2]–, [NO3]–, [NaCl]–, [Na2OH]+, [Na235Cl]+, [Na35Cl2]–, [Na37Cl2]–, [Na35Cl37Cl]–, [Na2NO3]+, [Na3SO4]+, [Na3SO4]+, [O]–, [OH]– [Ca]+, [H2PO3/HSO4]–, [NO2]–, [NO3]–, [PO3]–, [Cn]+/– (n = 1–5) [Ca]+, [Fe]+, [Na]+, [Ni]+, [V]+, [VO]+, [CN]–, [C]+, [C2]+, [C3]+, [C4]+, [C2H3]+, [C3H]+, [SO2]–, [SO3]–, [HSO3]–, [HSO4]– [Cu]+, [K]+, [Na]+, [Pb]+, [Cn]+/– (n = 1–11), [C2H3]+, [CH3CO]+, [C3H]+, [CN/C2H2]–, [NO2]–, [NO3]–, [SO3]– [K]+, [Na]+, [NH3]+/[NH4]+, [Cn]+/[CnHn]+, [C2H3O]+, [NO2]–/[NO3]–, [SO3]–/[HSO3]–, [SO4]‒/[HSO4]–, [CH2SO3]–, [Cn]–, [CN]–/[CNO]–
Recently, through collaboration with several local environment monitoring centers in China, Guangzhou Hexin Analytical Instrument Company Limited developed an online source apportionment method using typical ions from SPAMS source profiles established locally in China. With this method, it is possible to conduct source apportionment for particle number. Moreover, to accurately estimate the contributions of primary sources, thermal denuder (TD)-ATOFMS, thermal diluter (TD)-SPAMS and infrared-laser two stage ionization technologies were developed in recent years by reducing the
References [50,55–57] [58] [9,51,54,59]
[52,54,60–62]
[33,59,61] [60,63–65]
[13,61,66–69] [12] [35] [29] [54]
inference of secondary species in the particles[70–72]. 4.3
PM mixing state and aging process
PM mixing state can greatly affect the characteristics of particles such as radioactive forcing, toxicity and acidity. And it can also be helpful for identifying particles from local or transported sources[73,74]. ATOFMS and SPAMS are widely applied in particle mixing state research. By using aircraft-ATOFMS in Wyoming and Colorado,
CAI Jing et al. / Chinese Journal of Analytical Chemistry, 2015, 43(5): 765–774
Pratt and Prather[56] found that in the lower atmosphere, carbonaceous aerosols were mixed with ammonium, nitrate and sulfate while they were more likely to be mixed with nitrate and sulphuric acid at higher altitude. By analyzing the mixing state of aerosol with ATOFMS in Paris, Healy et al[75] found that only 22% particles came from local emissions. In China, Bi et al[59] found that more than 90% of biomass burning particles were mixed with secondary inorganic ions in Pearl River Delta. Furthermore, quantifying particle mixing state by species and their abundance provided by ATOFMS was developed recently[76]. In marine aerosol studies, ATOFMS was used to study chlorine loss, confirming the effect of heterogeneous reactions between sea salt and nitrate[68]. In inland studies, Qin and Prather[58] found that fresh biomass burning particles could have aqueous reactions, increasing the PM sizes and fragments of high molecular weight. Yang et al[33] found that during the haze period in Shanghai, China, the mixing state of carbonaceous aerosol and its extinction property changed. Sullivan[77] and Dall’Osto et al[78] found that dust aerosols would mix with nitrate, sulfate and methane sulfonic acid, changing their hygroscopicity and radioactive forcing impact due to aging process. Li et al[79] measured cigarette smoke in laboratory by SPAMS and found that CN–, NO3– and NH4+ increased while Cl– decreased after aging process. 4.4
Acidity and hygroscopicity studies of particles
By detecting the mixing state of particles, single particle aerosol mass spectrometry can also be used to study the acidity and hygroscopicity of particles. With ATOFMS and hygroscopicity tandem differential mobility analyzer (HTDMA), Herich et al[63] found that sea salt aerosol had the highest hygroscopic growth factor while particles from biomass burning had the lowest. By using similar system in Shanghai, China, Wang et al[80] found that carbonaceous aerosol mixed with secondary species and biomass burning particles with high K signals showed high hygroscopicity, while high ECOC particles and crustal particles (such as aluminum and silicon oxides) showed high hydrophobicity. Moreover, through the information of major water-soluble ions such as sulfate, nitrate and ammonium, aerosol acidity were determined[17,81]. However, since the response of individual ionic species varies and it is hard to calibrate, the acidity studies of single particle aerosol mass spectrometry are generally qualitative. 4.5
al[82] suggested that aerosol aging process played a very important role in CCN activity and local anthropogenic emissions affected the composition of CCNs greatly. Pratt et al[83] found that about 33% IN were biological particles, which were much higher than previous studies, while about 50% were from mineral dust. In Alps, ATOFMS studies showed that about 5% of ambient particles contained BC, while 7%–10% of IN particles did, indicating that BC played an important role in IN formation[84]. Besides all application areas mentioned above, single particle aerosol mass spectrometry can also be used in the study of SOA precursors[85], metal isotopes[86], bio-aerosols[87], drug aerosols[88], pesticide residues[89] and chemical warfare agent simulants[90].
5
Conclusions and prospect
After four decades of continuous effort, the single particle aerosol mass spectrometry technology was well developed. With the presence of laser size detection technique and laser ionization, PM size distribution and various components of particles can be measured simultaneously with high time resolution. Moreover, single particle aerosol mass spectrometry can also provide particle properties and sources by spectra clustering, and be widely used in various areas in various scientific research areas including establishing source profiles, conducting source apportionment of fine PM, and investigating mixing state and aging processes of particles, and composition of CCN and IN. However, there is still room for future improvement such as quantitation and identification of chemical composition in PM, methods of clustering, setting unified standard for qualitative measurement, and developing better classification method for online source apportionment. Setting a unified or standard method for identifying and quantifying chemical species in PM using single particle aerosol mass spectrometry, establishing single particle source profiles in China, developing a simplified online source apportionment method, and improving the single particle aerosol mass spectrometry technology by comparing with offline receptor method would be future research directions in China. Moreover, it would also be an important research and future development orientation to develop and improve the coupled system by connecting single particle aerosol mass spectrometry with other instruments such as thermal denuder, thermal diluter, aethalometer, HTDMA to obtain real-time information of fine particles such as composition, sources and formation mechanisms.
CCN and IN studies
Acknowledgements In cloud condensation nuclei (CCN) and ice nuclei (IN) studies, single particle aerosol mass spectrometry can provide the information of various species of CCN and IN in situ compared with traditional offline filter methods. Furutani et
The authors would like to thank Guangzhou Hexin Analytical Instrument Company Limited for their assistance in maintaining SPAMS and suggestions for data analyses. The
CAI Jing et al. / Chinese Journal of Analytical Chemistry, 2015, 43(5): 765–774
authors would also like to thank Professor Deborah S. Gross from Carleton College for her kind advice and suggestions.
[24] Giorio C, Tapparo A, Dall’Osto M, Beddows D C S, Marco C D, Nemitz E. Atmospheric Environment, 2012, 61: 316–326 [25] Su Y, Sipin M F, Furutani F, Prather K A. Anal. Chem., 2004,
References
76: 712–719 [26] Huang Z X, Gao W, Dong J G, Li L, Nian H Q, Fu Z, Zhou Z.
[1]
Zhang Y M, Sun J Y, Zhang X Y, Zhang X C. PTCA(Part B: Chem. Amal.), 2011, 47(11): 1371–1376
[2]
Pratt K A, Prather K A. Mass Spectrometry Reviews, 2011, 31: 17–48
Journal of Chinese Mass Spectrometry Society, 2010, 31(6): 331–341 [27] Allen J O. YAADA: Software Toolkit to Analyze Single-particle Mass Spectral Data, 2008, http://www.yaada.org
[3]
Friedlander S K. J. Aerosol Sci., 1970, 1: 295–307
[28] Fergenson P D, Song X H, Ramadan Z, Allen J O, Hughes L S,
[4]
Friedlander S K. J. Aerosol Sci., 1971, 2: 331–340
Cass G R, Hopke P K, Prather K A. Anal. Chem., 2001, 73:
[5]
Noble C A, Prather K A. Mass Spectrometry Reviews, 2000, 19: 248–274
[6]
Davis W D. J. Vac. Sci. Technol., 1973, 10: 278
[7]
Prather K A. United States. Patent, 1997, 5681752
[8]
Murphy D M. Mass Spectrometry Reviews, 2007, 26:150–165
[9]
Li L, Huang Z X, Dong J G, Li M, Gao W, Nian H Q, Fu Z, Zhang G, Bi X, Cheng P, Zhou Z. International Journal of Mass Spectrometry, 2011, 303(2-3): 118–124
[10] Zhang F, Wang S F, Guo C J, Nian H Q, Zhao D, Huang Z X, Gao W, Dong G J, Zhou Z. Modern Instruments, 2011, 49–52 [11] Li M, Li L, Huang Z X, Dong J G, Fu Z, Zhou Z. Research of Environmental Sciences, 2011, 24(6): 632–636 [12] Toner S M, Shields L G, Sodeman D A, Prather K A. Atmospheric Environment, 2008, 42: 568–581 [13] Gross D S, Markus E, GÄLLI Gälli M E, Silva P J, Prather K A. Anal. Chem., 2000, 72(2): 416–422 [14] Smyth M A, Thompson S L, Foy B D, Olson M R, Sager N, Mcginnis J, Schauer J J, Gross D S. Atmospheric Environment, 2013, 73: 124–13 [15] Liu D Y, Prather K A, Hering S V. Aerosol Science and Technology, 2000, 33(1-2): 71–86 [16] Sullivan R C, Guazzotti S A, Sodeman D A, Prather K A. Atmospheric Chemistry and Physics, 2007, 7: 1213–1236 [17] Wang X F, Zhang Y P, Chen H, Yang X, Chen J M. Environmental Science & Technology, 2009, 43(9): 3061–3066 [18] Fu H Y, Yan C Q, Zheng M, Cai J, Li X Y, Zhang Y J, Zhou Z, Fu Z, LI Mei, Lei L, Zhang Y H. Environmental Science, 2014, 35(11):4070–4077 [19] Liu D Y, Wenzel R J, Prather K A. Journal of Geophysical Research, 2003, 108(D7): 8426 [20] Gross D S, Atlas R, Rzeszotarski J, Turetsky E, Christensen J, Benzaid S, Olson J, Smit T, Steinberg L, Sulman J, Ritz A, Anderson B, Nelson C, Musicant D R, Chen L, Snyder D C, Schauer J J. Environmental Modelling & software, 2010, 25: 760–769 [21] Dall'osto M, Booth M J, Smith W, Fisher R, Harrison R M. Aerosol Science and Technology, 2008, 42(12): 981–991 [22] Dall'osto M, Harrison M R, Charpantidou E, Loupa G, Rapsomanikis S. Science of the Total Environment, 2007, 384(1-3):120–133 [23] Zhou L M, Hopke P K, Venkatachari P. Analytica Chimica Acta, 2006, 555: 47–56
3535–3541 [29] Zhang Y P, Wang X F, Chen H, Yang X, Chen J M, Allen J O. Chemosphere, 2009, 74:501–507 [30] Snyder D C, Schauer J J, Gross D S, Turner J R. Atmospheric Environment, 2009, 43: 4033–4042 [31] Guo C J, Huang Z X, Chen H Y, Zhou Z. Modern Instruments, 2007, 4: 23–26 [32] Huang Z X, Li M, Gao W, Nian H Q, Fu Z, Dong J G, Zhou Z. Journal of Shanghai University (Nature Science), 2011, 17(4): 562–566 [33] Yang F, Chen H, Du J, Yang X, Gao S, Chen J, Geng F. Atmospheric Research, 2012, 104: 193–201 [34] Pratt K A, Twohy C H, Murphy S M, Moffet R C, Heymsfield A J, Gaston C J, Demott P J, Field P R, Henn T R, Rogers D C, Gilles M K, Seinfeld J H, Prather K A. Journal of Geophysical Research, 2010, VOL. 115, D15301 [35] Healy R M, O’Connor P I, Hellebust S, Arnaud A, Sodeau J R, Wenger J C. Atmospheric Environment, 2009, 43: 6408–6414 [36] Spencer M T, Prather K A. Aerosol Science and Technology, 2006, 40(8): 585–594 [37] Dall’Osto M, Harrison R M, Beddows D C S. Environ. Sci. Technol., 2006, 40(16): 5029–5035 [38] Bhave P V, Allen J O, Morrical B D, Prather K A. Environ. Sci. Technol., 2002, 36: 4868–4879 [39] Qin X Y, Bhave P V, Prather K A. Anal. Chem., 2006, 78: 6169–6178 [40] Jeong C H, Mcguire M L, Godri K L, Slowik J G Rehbein P J G, Evans G J. Atmospheric Chemistry and Physics, 2011, 11(14): 7027–7044 [41] Tang X Y, Zhang Y H, Shao M. Atmospheric Environmental Chemistry, Peking University, Beijing: Higher Education Press, 2010: 44–46 [42] Silva P J, Prather K A. Environmental Science & Technology, 1997, 31(11): 3074–3080 [43] Gross D S, Gälli M E, Silva P J, Wood S H, Liu D, Prather K A. Aerosol Science & Technology, 2000, 32(2): 152–163 [44] Shields L G, Suess D T, Prather K A. Atmospheric Environment, 2007, 41: 3841–3852 [45] Pagels J, Dutcher D D, Stolzenburg M R, Mcmurry P H, Gälli M E, Gross D S. Journal of Geophysical Research: Atmospheres, 2013, 118:859–870 [46] Li L, Tan G B, Zhang L, Fu Z, Nian H Q, Huang Z X, Zhou Z,
CAI Jing et al. / Chinese Journal of Analytical Chemistry, 2015, 43(5): 765–774
Li M. Chinese J. Anal. Chem., 2013, 41(12): 1831–1836 [47] Suess D T, Prather K A. Aerosol Science & Technology, 2002, 36(12): 1139–1141 [48] Silva P J, Carlin R A, Prather K A. Atmospheric Environment, 2000, 34(11): 1811–1820 [49] Gaston C J, Furutani H, Guazzotti S A, Coffee K R, Bates T S, Quinn P K, Aluwihare L I, Mitchell B G, Prather K A, Journal of Geophysical Research: Atmospheres, 2011, 116: D18310 [50] Noble C A, Prather K A. Geophysical Research Letters, 1997, 24(22): 2753–2756
[68] Guazzotti S A, Whiteaker J R, Suess D, Coffee K R, Prather K A. Atmospheric Environment, 2001, 35(19): 3229–3240 [69] Bates T S, Quinn P K, Coffman D J, Covert D S, Miller T L, Johnson J E, Carmichael G R, Uno I, Guazzotti S A, Sodeman D A, Prather K A, Rivera M, Russel L M, Merrill J T. Journal of Geophysical Research, 2004, 109, D19S19 [70] Delbert J E, Grover B D, Woods R W, Norman L E, Russell L, Robert F. Atmospheric Environment, 2008, 42: 2706–2719 [71] Pratt K A Prather K A. Environ. Sci. Technol., 2009, 43: 8276–8282
[51] Spencer M T, Holecek J C, Corrigan C E, Ramanathan V,
[72] Dai S H, Bi X H, Huang H, Zhang G H, He J J, Wu G C, Sheng
Prather K A. Journal of Geophysical Research, 2008, VOL. 113,
G Y, Fu J M, Zhou Z. Chinese J. Anal. Chem., 2014, 42(8):
D16305 [52] Pratt K A, Murphy S M, Subramanian R, Demott P J, Kok G L, Campos T, Rogers D C, Prenni A J, Heymsfield A J, Seinfeld J
1155–1160 [73] Sipin M F, Guazzotti S A, Prather K A. Anal. Chem., 2003, 75(12): 2929–2940
H, Prather K A. Atmospheric Chemistry and Physics, 2011,
[74] Jacobson Z M. Nature , 2001, 409: 695–697
11(24): 12549–12565
[75] Healy R M, Sciare J, Poulain L, Kamili K, Merkel M, Muller T,
[53] Silva P J, Liu D, Noble C A, Prather K A. Environ. Sci. Technol., 1999, 33 (18): 3068–3076 [54] Healy R M, Hellebust S, Kourtchev I, Allanic A, O’Connor I P, Bell J M, Healy D A, Sodeau J R, Wenger J C. Atmospheric Chemistry and Physics., 2010, 10: 9593–9613 [55] Morrical B D, Fergenson D P, Prather K A. Journal of the American Society for Mass Spectrometry, 1998, 9(10): 1068–1073 [56] Pratt K A, Prather K A. Journal of Geophysical Research, 2010, VOL.115, D11305
Wiedensohler A, Eckhard S, Stoh A, Sarda-Esteve R, Mcgillicuddy E, O’Connor I P, Sodeau J R, Wenger J C. Atmospheric Chemistry and Physics, 2012, 12: 1681–1700 [76] Healy R M, Riemer N, Wenger J C, Murphy M, West M, Poulain L, Wiedensohler A, O’Connor I P, McGillicuddy E, Sodeau J R, Evans G J. Atmospheric Chemistry and Physics, 2014, 14: 6289–6299 [77] Sullivan R C, Guazzotti S A, Sodeman D A, Tang Y, Camichael G R, Prather K A. Atmospheric Environment, 2007, 41: 7166–7179
[57] Creamen J M, Ault A P, Hoeve J E T, Jacobson M Z, Roberts G
[78] Dall’Osto M, Harrison R M, Highwood E J, Highwood E J,
C, Prather K A. Environ. Sci. Technol., 2011, 45(19):
O’Dowd C, Ceburmis D, Querol X, Achterberg E P.
8208–8216
Atmospheric Environment, 2010, 44: 3135–3146
[58] Qin X Y, Prather K A. International Journal of Mass Spectrometry, 2006, 258 : 142–150 [59] Bi X, Zhang G, Li L, Wang X, Li M, Shen G, Fu J, Zhou Z. Atmospheric Environment, 2011, 45(20): 3447–3453 [60] Yang F, Chen H, Wang X, Yang X, Du J, Chen J. Atmospheric Environment, 2009, 43: 3876–3882 [61] Holecek J C, Spencer M T, Prather K A. Journal of Geophysical Research, 2007, VOL.112, D22S24 [62] Guazzotti S A, Coffee K R, Prather K A. Journal of Geophysical Research, 2001, VOL.106 D22: 28607–28627 [63] Herich H, Kammermann L, Frideman B, Gross D S,
[79] Li M, Dong J G, Huang Z X, Li L, Gao W, Nian H Q, Fu Z. Chinese J. Anal. Chem., 2012, 40(6): 936–939 [80] Wang X, Ye X, Chen H, Chen J, Yang X, Gross D S. Atmospheric Environment, 2014, 95: 318–326 [81] Yao X H, Rehbein P J G, Lee C J, Evans G J, Corbin J, Jeong C H. Atmospheric Environment, 2011, 45(34): 6251–6256 [82] Furutani H, Dall'osto M, Roberts G C, Prather K A. Atmospheric Environment, 2008, 42(13): 3130–3142 [83] Pratt K A, Demott P J, French J R, Wang Z, Westphal D L, Heymsfield A J, Twohy C H, Prenni A J, Prather K A. Nature Geoscience, 2009, 2(6): 398–401
Weingartner E, Lohmann U, Spichtinger P, Gysel M,
[84] Cozic J. Mertes S. Verheggen B, Cziczo D J, Gallavardin S J,
Baltensperger U, Cziczo D J. Journal of Geophysical Research,
Walter S, Baltensperger U, Weingartner E. Journal of
2009, VOL. 114, D13204 [64] Sullivan R C, Prather K A. Environ. Sci. Technol., 2007, 41(23): 8062–8069 [65] Pastor S H, Allen J O, Hughes L S, Bhave P, Cass G R, Prather K A. Atmospheric Environment, 2003, 37, Supplement 2: 239–258 [66] Dall'osto M, Beddows D C S, Kinnersley R P, Harrison R M. Journal of Geophysical Research, 2004, VOL. 109, D21302 [67] Gard E E, Kleeman M J, Gross D S, Hughes L S, Allen J O, Morrical B D, Fergenson D P, Dienes T, Gälli M E, Johnson R J, Cass G R, Prather K A. Science, 1998, 279(5354): 1184–1187
Geophysical Research, 2008, 113: D15209 [85] Hatch L E, Creamean J M, Ault A P, Surratt J D, Chan M N, Seinfeld J H, Edgeron E S, Su Y, Prather K A. Environmental Science & Technology, 2011, 45(12): 5105–5111 [86] Salcedo D, Onasch T B, Aiken A C, Williams L R, De Foy B, Cubison M J, Worsnop D R, Molina L T, Jimaenz J L. Atmospheric Chemistry and Physics, 2010, 10: 5371–5389 [87] Steele P T, Tobias H J, Fergenson D P. Anal. Chem., 2003, 75(20): 5480–5487 [88] Noble C A, Prather K A. Aerosol Science and Technology, 1998,
CAI Jing et al. / Chinese Journal of Analytical Chemistry, 2015, 43(5): 765–774
29(4): 294–306 [89] Whiteaker J R, Prather K A. Anal. Chem., 2003, 75(1): 49–56
[90] Martin N A, Farquar R G, Frank M, Gard E E, Fergenson D P. Anal. Chem., 2007, 79: 6368–6375