114
IEEE TRANSACTIONS ON BROADCASTING, VOL. 51, NO. 1, MARCH 2005
Brief Papers_______________________________________________________________________________ Application-Aware Buffer Management: New Metrics and Techniques Y. Bai and M. R. Ito
Abstract—An important issue for video transmission over IP networks is preservation of perceived video quality despite packet loss. Packet loss can be detrimental to compressed video. However, reducing packet loss to a very low level is difficult with current loss control techniques. Furthermore, even a very low objective loss probability can still seriously distort perceived video quality. This paper presents two buffer management schemes using video characteristics. They increase maximum loss tolerance for a desired level of video quality, providing better quality at equal loss ratios, when compared to a conventional buffer management scheme. Meanwhile, service fairness and network efficiency are also improved. Index Terms—Buffer management, packet video, QoS.
I. INTRODUCTION
P
ROTECTING video data against IP packet loss is widely discussed within the Quality of Service (QoS) research community. Many techniques have been designed to implement at end systems in order to remedy data loss in a network. Typical examples of these approaches include Forward Error Correction (FEC) [1] and Error Concealment [2]. FEC introduces relatively high overhead in the server side, and may result in low network efficiency due to transmission of redundant data, while Error Concealment only provides a certain level of video reconstruction ability at the receiver end. It is our belief that prevention of data loss within a network could be a reasonably effective way to improve the quality of video transport over IP networks. Therefore, we have investigated loss control techniques inside a network. A. Previous Work Network techniques for the provision of QoS can be classified as belonging to one of two categories: those related to modifications to network protocols and extended services and those dependent on a totally new network paradigm. The former is built upon a traditional network, where network nodes are solely devoted to packet forwarding operations. We refer to them nonactive solutions. The latter is based on a new Internet architecture, Active Networks, where network nodes perform some additional processing except packet forwarding. We called them active solutions.
Manuscript received August 1, 2003; revised August 17, 2004. The authors are with the Department of Electrical and Computer Engineering, University of British Columbia, Vancouver, BC V6T 1Z4, Canada (e-mail:
[email protected];
[email protected]). Digital Object Identifier 10.1109/TBC.2004.842517
1) Non-Active Solutions: Non-active solutions are the enhanced services added to the current IP networks, mainly consisting of Integrated Services (IS) [9], [10] and Differentiated Services (DS) [11]. The IS approach performs per-flow end-to-end resource reservation to provides QoS. Two main components in IS-related approaches are admission control and packet scheduling. The admission control determines if and how a flow is admitted to a network. In particular, it determines whether the network can accommodate the requested service and regulates traffic behavior to conform to predefined characteristics. For each admitted flow, the appropriate resources are reserved along the path through the Resource Reservation Protocol (RSVP) [9]. Scheduling is then applied to each admitted flow to guarantee service in a given reservation. IS has one important advantage: IS can provide a firm end-to-end delay guarantee on a per-flow basis. However, it has been widely recognized that IS is not scalable due to per-flow end-to-end resource reservation. In the past, the use of IS-based techniques to achieve a given delay and throughput on a per-video basis has been studied by researchers [21]. The results have shown that IS guarantees the service rate of video applications, but it does not always deliver a high quality of video because there is no linear relationship between quality and bit-rate. Some bits may be more important than others. In other words, perceived quality will generally be dependent on the data rate and the data content. Current resource reservation in IS does not use content information in the data; rather, it treats all the data in the same manner. Furthermore, it is not practical to make a high or full level of resource reservation for each flow during its whole activation period due to the large traffic volume. IS is clearly inefficient at providing a specified, user-perceived quality level. Finally, the multiplicity of high-bandwidth video flows may result in the insufficient availability of peak resources. Consequently, a lower level of QoS reservation may be taken, which would result in an overall, and most likely unnecessary, decrease in video quality. DS is defined on a per-class per-hop basis for the purpose of scalability. The DS approaches consist of two stages. In the first stage, traffic must be classified into one of a certain number of classes, and each class possesses similar service requirements. In the second stage, traffic management techniques provide different levels of service to different classes of traffic on a per-hop basis. DS-related technologies have been applied to networked video. A representative technique is to carry out buffer management, in which less important classes of video packets are discarded ahead of more important ones [20], thus reducing the
0018-9316/$20.00 © 2005 IEEE
IEEE TRANSACTIONS ON BROADCASTING, VOL. 51, NO. 1, MARCH 2005
loss of video quality. Another typical technique is to perform Class-based Queuing (CBQ) on layered video at individual routers where a higher proportion of the video bandwidth is assigned to the base layer [17]. Yet another method employs a combination of Weighted Fair Queuing (WFQ) and Random Early Drop (RED) and is used for the delivery of high quality H.263 video traffic [12]. Overall, these schemes provide a qualitative differentiation on loss and delay to different classes of video traffic, rather than to per-video traffic. Further, the differentiation is done on a per-hop basis. They cannot ensure per-flow-based end-to-end loss bounds. End-to-end loss is a combination of the loss target at each hop on the path, but the above schemes do not cover the distribution of the end-to-end loss bound of a flow to the desired loss at each hop. As a result, per-flow end-to-end loss cannot be entirely met. Lastly, DS fails to provide user-perceived QoS because it does not accurately consider the application characteristics. 2) Active Solutions: Active solutions are built upon Active Networks [7], [13], [18]. Active networks are about programming the infrastructure to support customized communications and computations. In an active network, an application can instruct the network how to treat its packets by injecting application-specific programs into routers. The routers can then perform computations up to the application layer on individual packets and deal with application-specific states within a network according to the injected code. Therefore, active network-based approaches can outperform those in a traditional network for the following reasons. First, Active Networks allow for a finer granularity of control when compared with traditional networks. Active Networks employ a packet-centric approach in which the packets can contain custom code, and in which the code is executed at the intermediate nodes as the packets travel through the network. Thus, active techniques can be performed on a per-packet basis, rather than on a per-flow basis as in IS, or on a per-class basis as in DS. Consequently, active solutions increase the likelihood that network services are well matched to the quality requirements of their applications. Second, active network technology speeds up the deployment of new services. In an active network, the end users can add, change, or delete services on the fly. Various traffic management techniques for QoS control can be used at different intermediate nodes independently or collectively. Conversely, in nonactive networks, service deployment completely relies on the equipment vendors, and all the nodes must possess similar traffic-management capabilities. The Internet is inherently a multivendor environment. Thus, service deployment in nonactive networks is always very slow. The industry is counting on service creation to drive revenue growth. This is the main reason why many companies, such as Nortel, CISCO, and Lucent, have been very active in the research and development of active routers. Furthermore, an active network is much more effective at providing quality assurance than DS, and it is more scalable than IS. An active network enables applications to load software programs into routers in a dynamic manner, which allows greater effectiveness and flexibility in assigning network resources at different times and at different network nodes.
115
B. Motivations Our work is motivated by both technology “pull” and user “push.” The “pull” is the emergence of active technologies, supporting the encapsulation, transfer, inter-position, and safe and efficient execution of program fragments. Today, the main areas of applications whose performance can be dramatically increased via Active Networks are: reliable multicast, network management, traffic control, and multimedia applications [13]. Recent research shows that Active Networks also provides benefits for mobile IP services [14] and grid computing [15], [16]. Our innovation is to leverage and extend Active Networking technology for use in other areas not really covered today in ways that will greatly benefit video over IP-based networks. The “push” comes from the limitations in nonactive solutions as stated in the following. We have recently investigated buffer management techniques. A conventional buffer management technique is Tail Drop (DT) in which packets are dropped when the buffer is full. All routers support DT because of its simple operation. Another popular technique is Random Early Drop (RED) [3] and its variants including RED with Input and Output (RIO) [22] and FairRED [19], RED-PD [23], LRU-RED [24], SRED [25]. The primary function of the above methods is to drop each arriving packet with some drop probability whenever the queue length exceeds some drop level, rather than wait for the queue to become full. All achieve better performance in terms of packet loss, and thus, are applicable for general-purpose loss control. These methods, however, cannot always eliminate or minimize the quality loss of networked video because there is no linear relationship between packet loss and the presentation quality of video [4]. Still other recent techniques such as Complete Buffer Sharing and Partial Buffer Sharing [26] have been studied in the context of ATM networks. From this arises the need for designing buffer management schemes in IP networks from a quality control viewpoint, rather than from a network measurement one (e.g., packet loss), as in current buffer management approaches. In other words, buffer management techniques to improve user perceived video quality are particularly desirable. The quality control perspective necessitates a video-oriented design. However, processing multimedia flows inside a network is currently unavailable in a conventional router which is not designed for such work. This could be overcome in light of Active Networking paradigm. Active networking techniques make networks recognize application and process application-specific procedures, certainly including video-specific processing. Therefore, this paper proposes two buffer management schemes at a router, Frame-Level Packet Discard with Dynamic Thresholds (FDDT) and Loss-based Buffer Sharing with Frame-Level Packet Discard (LBS_FPD), to maximize video quality under given network conditions while making the most efficient use of network resources. Both schemes use knowledge of the characteristics of compressed video, specifically MPEG video. One important feature of MPEG coded video is its hierarchical format. From the top of the hierarchy this format goes from Group of Pictures (GOP), to picture (or frame), slice, Macroblock, and finally, block. Of these, the most important component is the frame, as it is the basic unit of display. Frame error directly affects the viewing
116
IEEE TRANSACTIONS ON BROADCASTING, VOL. 51, NO. 1, MARCH 2005
quality of video [4], [5]. Another key feature of MPEG video is its inter-frame dependency: the -, -, and -packets rank in importance in descending order. Further, this paper proposes three new performance metrics, Frame Error Rate, Effective Throughput and Fair Index, which are better suited to the control and evaluation of video transmission than the traditional ones, such as Signal Noise Ratio (SNR) and Throughput. The rest of this paper is organized as follows: Sections II and III describe the proposed metrics and schemes. Section IV presents the simulation results. Section V gives conclusions. II. PERFORMANCE METRICS There are two types of performance metrics for the buffer management problem, application performance and network performance. Network performance evaluation is taken from a network viewpoint and is independent of application and user perception. It usually relies on standardization by the International Standardization Organization (ISO). Examples of network performance metrics include packet loss rate, available bandwidth, and throughput and delay. However, from an application standpoint, the required parameters are different. Application performance metrics can be described by objective and subjective parameters. The objective metrics description is limited to system-level technical parameters, such as the Peak Signal to Noise Ratio (PSNR), that are not related to network-level performance parameters in a simple way. The video’s score in the Human Viewer Trial, whose grading standards are set by the International Telecommunication Union (ITU), determines the subjective quality. An excellent image quality is associated with a score of 5, while a “bad” image quality is associated with a 1. The grading process does not provide results that correlate with network-controllable parameters. Application performance metrics and network performance metrics are not closely related to each other, and none of the existing metrics simultaneously account for application characteristics, user preferences, and relationships with network parameters. By following the existing performance evaluation paradigms, networks are not able to deliver satisfactory network services to their application users; instead, the services provide quality as perceived by the networks. However, it is perceptual quality, rather than network-perceived service quality, that determines the success or failure of a network. When using the current performance evaluation paradigm, network operation is unsatisfactory. To bridge the gap between user requirements and network services, users’ requirements for a specific application must be integrated with the parameters that characterize the underlying network performance. Three performance metrics have been developed: Frame Error Rate (FER), Fair Index (FI), and Effective Throughput (ET). The definitions are given below. FER (for each video stream): FER is the fraction of • frames in error for each video stream. A “Frame in error” is defined as follows: if one packet in a frame is lost then this whole frame and its propagated frames ( and or ) are considered to be frames in error. A low frame error rate represents high perceived quality of a video.
ET (for all video streams): ET is the fraction of usable data over all the video streams. “Useable data” is the video data that belongs to a successfully delivered frame, i.e., a video frame in which all of the packets and reference frames ( and or ) are completely transmitted. High effective throughput means high network efficiency. FI (for each video stream): FI is the ratio of actual • packet loss ratio (PLR) over the acceptable PLR for each video stream, yielding a value of one or less than one for a satisfactory loss performance, and a value of greater than one for unsatisfactory loss performance. Therefore, the higher the percentage of streams with the Fair Index equal to or less than one, the higher the level of fairness of service. The acceptable PLR relies on the users’ choice between the tradeoffs of quality and fees, and can be set by the network service provider. For example, an acceptable PLR of 5% is set for basic service and 1% for premium service. The reasons for choosing the above new metrics are given below. First, the FER directly impacts video viewing quality [5] and is more closely correlated with the human perception of video quality than the widely used Signal Noise Ratio (SNR) [8]. When using SNR as a guide, perceived video quality cannot be reliably predicted from network performance, since there is no straightforward relationship between SNR and network-level performance parameters. Conversely, FER is easily converted to related network-level performance parameters such as the packet loss rate and can thus be supported through in-network quality control. Second, ET measures network efficiency. ET differs from throughput, the conventional measure of network efficiency, because throughput does not show what percentage of delivered traffic is useful to application users and does not truly reflect network efficiency. ET reflects the percentage of traffic that is successfully transmitted: the traffic that is useful to end users. Finally, FI is a measure of service fairness. Service fairness means that service levels are allocated fairly to different video traffic, such that each individual video receives service at a level commensurate with individual expectations. Fairness in the allocation of link bandwidth or router buffer space has been explored, but neither of these approaches accurately reflects the fairness based on users’ satisfaction because there is no clear relationship between network resources and application performance. Clearly, fairness of service is a more rational objective since it reflects user perceived service quality that a network attempts to offer, while fairness in resource allocation is simply a means of achieving a network service goal. When the percentage of videos with the FI equal to or less than one is high, the fairness of service is also high. As a result, more video users can be charged for the satisfactory service, leading to more successful network operation. •
III. FRAME-LEVEL PACKET DISCARD WITH DYNAMIC THRESHOLDS (FDDT) AND LOSS-BASED BUFFER SHARING WITH FRAME-LEVEL PACKET DISCARD (LBS_FPD) This section presents the FDDT and LBS_FPD schemes for a router that handles streaming MPEG video over IP networks.
IEEE TRANSACTIONS ON BROADCASTING, VOL. 51, NO. 1, MARCH 2005
117
A. The FDDT Scheme
B. The LBS_FPD Scheme
The main idea of the FDDT scheme is to use three control thresholds in a router output buffer to always ensure enough free space for queuing the more important video packets and the entire set of packets of each accepted video frame. This scheme prevents error propagation and minimizes the number of frames in error. As a result, degradation of perceived video quality during congestion episodes is reduced and network efficiency is improved. Assuming that no error recovery and/or concealment is supported, FDDT works as follows: The first packet of a - or -frame is discarded when 1) the buffer occupancy thresholds (LOW or HIGH) are reached, respectively. In this case, the remaining packets of those frames are discarded, regardless of the instantaneous buffer occupancy. An -frame packet is only discarded when there is no 2) space in the buffer. All subsequent packets of a frame are discarded, once 3) an early packet of the frame is dropped. A packet from competing traffic is discarded when 4) the buffer occupancy threshold ( ) is reached ( is initially set to LOW); is decreased by one, when a or packet is discarded. Buffer space saved by dropping less important video packets can therefore be granted to more important video packets. The reason why the increment of from the preceding value is one rather than other values is to avoid low throughput that other competing traffic may experience. If the difference between initial and update values of is , is increased by one when an - or -packet is queued subject to remaining greater than zero. All new packets are dropped when the buffer is full. 5) The design of frame-level packet drop is based on the results of previous research on video watchability experiments and developed error reconstruction techniques. Experiments have shown that 3 to 7 consecutive er• rorred frames can cause shift in motion, and 8 or more consecutive frames in error cause a large discontinuity, or even a completely different picture from the original picture [5], resulting in an unacceptable video quality. Also a frame rate of 12 frames per second or more flows smoothly for most audiences, and thus, is widely accepted [27]. The results indicate that it is more visually pleasing to watch a video with no frames in error even at a lower frame rate, than one with a large number of consecutive frames in error at a higher frame rate. Error concealment techniques on reconstructing small • corrupted areas in a frame are very difficult and produce a less pleasing visual effect due to complex computation [1]. The technique of replacing a lost frame with its previous frame is simpler, yet efficient, for recovering a reduced frame rate. Hence, the postprocessing for recovering lost data is simpler for frame-level drop than for occasional packet drop. Therefore, frame-level drop provides better presentation quality of video with and without error concealment at the receiver.
The objectives of the LBS_FPD scheme are to assure high quality video streaming in the presence of loss, to improve network efficiency, and to provide fairness of service among multiple video streams. The classical notion of fairness refers to bandwidth fairness and buffer allocation fairness. This paper introduces an alternative fairness concept: fairness of service. Fairness of service means fair allocation of service levels to different traffic such that all traffic receives service at a level commensurate with their individual expectations. In other words, fairness of service tries to guarantee that all traffic with the same quality requirements perceives similar QoS; traffic with higher QoS requests obtains more quality, while traffic with lower QoS requests receives lower quality. Clearly, fairness of service is a more rational objective since it reflects user perceived service quality that a network endeavors to offer, while fairness in resource allocation is just a means of achieving a network service goal. The LBS_FPD scheme controls the distribution of network buffer space among contending video streams (LBS) and between different parts of the data within a stream (FPD). It works as described below. For each arriving packet from stream : /* perform LBS */ If ( ) and 1) ), drop the packet. Here, LOW is the ini( tial buffer length threshold at which -packets start being dropped, and is the ratio between the actual buffer occupancy, , of stream , , and the allocated buffer share which is given by product of weight and the buffer size . Thus,
For stream , is determined from the buffer allocation in inverse proportion to its normalized PLR, and is calculated as
2) 3)
4) 5)
where is the acceptable PLR of stream . Next, do the following: /* perform FPD */ If , and the packet is the first packet of a -frame, drop the packet. If , and the packet is the first -packet or -packet, drop the packet. Here, HIGH is the buffer length threshold at which -packets start being dropped. If the dropped packet is a -packet, LOW decreases by one. Let the difference between initial and update values of LOW be , LOW increases by one when an - or -packet gets accepted subject to remaining greater than zero. If the arriving packet(s) belongs to a partially discarded frame, drop the packet. If the buffer is full, drop the packet. Next, perform: /* update related parameters */
118
Fig. 1.
6) 7)
IEEE TRANSACTIONS ON BROADCASTING, VOL. 51, NO. 1, MARCH 2005
(a)
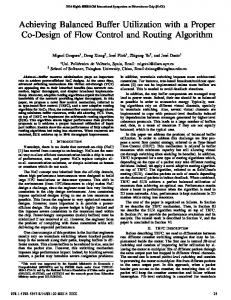
Simulation diagram.
If the packet is accepted, increase and Buffer Length each by one, respectively. For each departing packet from stream , decrease and Current Buffer Length each by one. IV. EVALUATION OF FDDT AND LBS_FPD
Simulations are performed to evaluate the FDDT and LBS_FPD schemes. Both schemes are compared with the DT scheme. The DT scheme is the conventional packet discard scheme in which packets are dropped when the buffer is full. In this work, our schemes were not compared with RED and its variants. It is our belief that the comparison is unfair because RED requires the assistance of the sender and our schemes do not involve a direct intervention by the sender. Another reason is that RED is not able to support the UDP-based transmissions that are most appropriate for the delivery of real-time video. This section provides the results. Fig. 1 illustrates the system used in the evaluation. In Fig. 1, the Network Simulation module is implemented in a C program, and simulates the behavior of an output packet buffer of a router with FDDT and LBS_FPD and DT schemes, respectively. The Packetization module first encapsulates actual MPEG-1 video traffic into RTP packets, then UDP packets, and finally the IP packets with 1500 bytes as the maximum packet size. The IP packets are then sent to the Network Simulation module. The video traffic derives from video traces where the number of bits per frame used by the MPEG coder is described [6]. Background traffic also consists of trace-driven MPEG-1 sources [6]. These sources show burstiness over small and large time scales. The Analysis module takes the original video file and output of the Network Simulation module as input to examine video loss and network throughput. In the simulation, the test video traces are the “soccer,” the “asterix” (a cartoon) and the “talk” traces. They represent high, medium, and low activity, respectively. They all follow the same GOP pattern, IBBPBBPBBPBB, and consist of 40 000 frames, which is approximately equivalent to half an hour of video. Each selected video trace ran for about half an hour. Each simulation lasted 40 minutes. The videos were started randomly over 60-second intervals. The capacity of output link of a router was 100 Mbps. The buffer size was 150 KB. These settings result in a queuing delay of 12 ms, closely to the latency specified for interactive video. The congestion level is varied by changing the number of background sources. The results presented in the following sections show the final values of the average of different
(b) Fig. 2. Performance comparison between FDDT and DT. (a) Difference in FER for the “asterix” trace. (b) Difference in ET.
runs. In each run, the starting sequence of a video stream was randomly selected. A. Performance of FDDT The effectiveness of FDDT was tested in scenarios when different packet loss rates (PLR) were applied. Fig. 2 shows the results. In this Figure, video sources are randomly selected from the “asterix,” the “soccer” traces, and the “talk” traces. LOW and HIGH are set to 0.90 and 0.93, respectively. A threshold value of 0.90 means that the buffer length threshold is 90% of the buffer size (in packets). As seen in Fig. 2, compared to the DT, the advantages of the FDDT are • Lower FER: FDDT normally admits packets belonging to completely correct video frames and discards packets from partially corrupted ones. Also, FDDT performs preventative priority packet dropping. Instead, DT discards packets arbitrarily, therefore, most likely distributing packet loss, which translates into a large FER. This is because each lost packet may belong to a different frame. In particular, a lost packet could belong to an or -frame. Consequently, small packet loss will affect a large number of consecutive frames due to error propagation. Therefore, DT yields significantly greater video quality degradation than FDDT under equal packet loss ratio. On the other hand, upon examining the PLR with an equal FER (e.g., 10%), it can be seen that the PLR in FDDT rises to approximately 3.0%, in comparison to only 1% in DT. This result shows that FDDT increases packet loss tolerance. It should be noted that the Fig. 2(a) plots the FER for one of the “asterix” traces. A similar
IEEE TRANSACTIONS ON BROADCASTING, VOL. 51, NO. 1, MARCH 2005
119
(a)
(a)
(b)
(b) Fig. 4. Difference in FI between LBS_FPD and DT with varying number of = 8. (b) = 10 videos ( ). (a)
N
(c) Fig. 3. Performance comparison between LBS_FPD and DT. (a) Difference in FER. (b) Difference in ET. (c) Difference in FI.
•
observation holds for other test video streams and the results are omitted here. Higher ET: FDDT prevents the residual part of the damaged frames from being transmitted, thus avoiding a waste of network resources.
B. Performance of LBS_FPD Fig. 3 shows the simulation results of LBS_FPD when six videos were used. Videos 1–3 are sports sources called “Soccer” with a packet loss constraint of 3%, and videos 4–6 are news sources called “Talk” with a packet loss constraint of 6%. LOW and HIGH are set to 0.80 and 0.90, respectively. As shown in Fig. 3(a) and (b), the LBS_FPD scheme provides lower FER and higher ET than the DT scheme. Also from Fig. 3(c), the level of fairness of service provided by the LBS_FPD scheme is much higher than that provided by the DT scheme. It can be seen that most of the time FI in the LBS_FPD scheme is less than or closer to one. This occurs because the LBS_FPD scheme sets the weight in the buffer sharing mechanism inversely proportional to the acceptable PLR. Therefore, when the LBS_FPD scheme is applied to nonhomogeneous videos, buffer sharing for streams with higher acceptable PLR
N
N
(streams #4 and #5, #6) is half of that for streams with lower acceptable PLR (streams #1, #2 and #3). In turn, every stream achieves a loss performance at a level commensurate with expectations. This results in an equitable loss distribution among the video streams with different loss tolerances. Conversely, the DT scheme does not have a mechanism to adjust buffer allocation in equilibrium with different loss tolerances. Thus, losses are arbitrarily distributed among video streams. This is shown by the following two facts. First, the streams with same packet loss tolerance, i.e., streams #4 and #5, exhibit significantly different FI, meaning that unfair service is provided to both streams. Second, most values of FI in the DT scheme are greater than one. In general, the DT scheme provides satisfactory service only for a small percentage of the video streams in terms of loss performance. A large fraction of streams cannot meet their loss constraints, and thus, the DT scheme does not provide fairness of service. Fig. 4 further demonstrates the fairness property of LBS_FPD. It plots the FI values for simultaneous transmission of eight and ten video streams, respectively. It can be clearly seen that for both cases, the FI of most video streams is below or close to one in the LBS_FPD scheme, meaning that a large percentage of streams receive service with acceptable packet loss. Thus, the LBS_FPD scheme reaches a high level fairness of service. Conversely, a random loss distribution among video streams occurs in DT. C. Comparison of FDDT and LBS_FPD The comparison of FDDT and LBS_FPD in terms of variance of FI is shown in Fig. 5. As seen in Fig. 5, the variance
120
IEEE TRANSACTIONS ON BROADCASTING, VOL. 51, NO. 1, MARCH 2005
2) Fig. 5.
Performance comparison between LBS_FPD and FDDT and DT.
of FI in the LBS_FPD scheme is lower than FDDT. It indicates that the loss differences fluctuate slightly between videos when LBS_FPD is applied. In other words, for many videos, the actual loss of each stream is controlled to nearly match the specified allowable values. Conversely, a relatively high and also too much loss variation from the expected packet loss rate appears in FDDT and DT. The results indicate that both DT and FDDT have a lower level of fair service than the LBS_FPD. This is, again, the result of the loss-based buffer sharing mechanism built into the LBS_FPD. Recall that in this scheme, the buffer usage among video streams is fairly distributed and inversely proportional to the loss constraints. The losses among the streams are equitably distributed, just matching their individual loss tolerance. Conversely, both DT and FDDT lack a buffer allocation mechanism for the contending streams. The ’greedy’ streams may use buffer space more than the weighted average, forcing other streams to use less buffer space than expected. As a result, the ’greedy’ streams exhibit much lower loss ratios than they should, while there are higher losses in other streams. Therefore, a random loss distribution among video streams occurs in DT and FDDT. However, the improvement in services fairness by LBS_FPD comes with a small cost: the LBS_FPD needs to know the application requirement and to compute the corresponding buffer share. The results shown earlies are for the purpose of demonstrating the effectiveness of both schemes. Experiments using a number to 10 exhibit similar trends as those presented of videos here. The DT is inferior to the FDDT and LBS_FPD in all the cases and only the absolute values of the FER, FI and ET are different. The detailed results are omitted here. The effects of varying threshold values and changing traffic patterns on FDDT and LBS_FPD performance were also studied. The results show the robustness of both schemes in terms of video quality and network efficiency, regardless of network load and the variety of videos, although a slight tuning of the parameters as thresholds for network conditions and various videos is necessary. A few guidelines derived from simulation experiments for configuring threshold parameters of both schemes are presented in the following: 1) Both schemes clearly work well with videos conand -packets. In sisting of large numbers of contrast, small values of thresholds should typically and be given to videos with smaller numbers of -packets. The number of and packets depends not only on activity level, but also on the GOP pattern and the packetization method of the videos. GOP
patterns determine the frequency of an occurrence of -frames. For example, the frequency of a -frame occurrence is 60% in a video with a GOP pattern of IPBBPBBPBB, but it is 50% in a video with a GOP pattern of IPBB. Packetization methods, on the other hand, determine the number of packets per video frame. There is a tradeoff between network utilization and video quality. The most likely scenario would be that FDDT and LBS_FPD only discards -packets for light traffic loads by decreasing the threshold LOW and discards packets for heavy loads by also decreasing the threshold HIGH. V. DISCUSSION
For FDDT and LBS_FPD, each router should know the information regarding the acceptable PLR of each sender and the used encoding mode in order to calculate the buffer allocations between videos at a router and make the decision to forward or drop a packet. The information can be communicated straightforwardly between application users and routers, and inter-nodes since the targeted network environment of FDDT and LBS_FPD is Active Networks. By definition, an Active Network consists of active packets and active nodes. An active packet can carry both program and data. The program portion of the packet can be executed in the active node. In an active network, the video sender generates and emits active packets for a sequence of video frames through appending active header and program information to a regular video packet. In particular, a small number of bits (e.g., 2 to 3 bits) is used in its active header to encode acceptable PLR for a given video stream and structure of transmitted data. The state information is recorded in the active packet and reduces state maintenance at a router thus increasing scalability. On the other hand, the active router extracts the code once from active packets to obtain the appropriate program to perform QoS transport based on FDDT and LBS_FPD. A. Our Contributions Our study differs from earlier on IS and DS-related techniques. IS and DS are at the opposite ends of a spectrum of QoS control techniques. IS are able to provide per-user based QoS but tend to be difficult to implement due to per-flow end-to-end resource reservation, while DS are simpler and scalable with increasing traffic on the Internet. However, users’ QoS provision is constrained on a per-class basis. Our work bridges the difference between IS and DS by having dynamic buffer reservation on a per-user basis. The techniques are more scalable than IS-related techniques and provide better QoS than DS-related techniques. Our scheme is based on careful consideration of the correlation among data content, required network resources, and the resulting application quality and user-driven computation performed at nodes within the network. The freedom to manipulate data streams such as high-level data format is the key distinctive feature of Active Networks, which is not available in a traditional network. Current routers have been designed to forward
IEEE TRANSACTIONS ON BROADCASTING, VOL. 51, NO. 1, MARCH 2005
packets, not to processing them. Therefore, our work demonstrates the importance and usefulness of Active Networks.
VI. CONCLUSIONS In this paper, we propose two buffer management schemes called FDDT and LBS_FPD. This study differs from previous studies of buffer management schemes used for video transportation in IP networks. Most of the existing schemes aim to minimize the amount of packet loss, while our design focus on minimizing the impact of packet loss, which is not related to packet loss rates in a simple way. User evaluations is one important aspect being concentrated on to guide our design of new schemes. Simulation experiments using actual MPEG video traces have been carried out to test the performance of the FDDT and LBS_FPD schemes. The experiments show that both schemes not only significantly increase the viewing quality of per video streams, but also improve network efficiency. The LBS_FPD also provides a superior level of fairness of service among competing video streams. The underlying assumption for both schemes is that Active Networking technology is available. Active Networks enable packets to carry application-specific “advice” for error control into the network and thus provide a QoS closer to users’ expectation because the application knows best what to do with the error and the network knows best where and when the error occurs. With this work, we demonstrate the benefits obtained from applying the active network paradigm to video flows, but we do not intend to prove that active techniques are the sole perfect solution to the problem of provision of QoS since no “one size fits all” solution exists. Further, current software and hardware prototypes are designed to demonstrate that commercial routers could be easily enhanced to support a few active processing capabilities. Our work serves as the practical application of these systems in supporting the deployment of new techniques and services. In other words, when active routers are in place, new schemes can be rolled out on-the-fly, rather than in a vendor-independent way. We also formulated three new performance metrics, FER, FI, and ET. These new metrics are novel in two aspects: first, the metric for an application quality, FER, reflects the quality perceived by application users and most importantly, can be directly mapped to network-controllable parameters. Second, the metrics for a network service quality, ET and FI, are based on users’ satisfaction with the application performance. These two aspects establish a basis for a new network management paradigm whereby a network can manage itself to match the expectations of application users, increasing users’ satisfaction with network services, while effectively utilizing network resources. This contrasts with the existing performance evaluation paradigm, which pays little attention to the relationship between user-perceived application quality and parameters characterizing network performance. In the existing performance evaluation paradigms, the improved quality of network services is only satisfied by the network itself but does not match users’ expectations well.
121
REFERENCES [1] A. Albanese and M. Luby, “PET-priority encoding transmission,” in High Speed Networking for Multimedia Applications. Boston, MA: Kluwer Academic Publishers, 1996. [2] Y. Wang and Q.-F. Zhu, “Error control and concealment for video communication: A review,” Proc. IEEE, vol. 86, pp. 994–997, May 1998. [3] S. Floyd and V. Jacobson, “Random early detection gateways for congestion avoidance,” IEEE/ACM Trans. Networking, pp. 397–413, Aug. 1993. [4] Y. Bai and M. R. Ito, “Loss control for MPEG-2 video transport over IP networks,” in Canadian Institute for Telecommunications Research 2001 Annual Research Conference, Alymer, Canada, Aug. 2001. [5] I. Joe, “Packet loss and jitter control for real time MPEG video communications,” Computer Communications, vol. 19, pp. 901–904, 1996. [6] [Online]. Available: http://nero.informatik.uni-wuerzburg.de/MPEG/ [7] D. L. Tennenhouse, J. M. Smith, W. D. Sincoskie, and D. J. Wetherall, “A survey of active network research,” IEEE Commun. Mag., vol. 35, no. 1, pp. 80–86, Jan. 1997. [8] H. Kanakia, P. P. Misha, and A. Reibman, “An adaptive congestion control scheme for real-time packet video transport,” in ACM/IEEE SIGCOMM Symp. Communications Architectures and Protocols, San Francisco, USA, Sep. 1993. [9] R. Braden et al., “Resource Reservation Protocol (RSVP) — Version 1 Functional Specification,”, RFC 2205, 1997. [10] R. Braden, D. Clark, and S. Shenker, “Integrated Services in the Internet Architecture: An Overview,”, RFC 1633, 1994. [11] S. Blake et al., “An Architecture for Differentiated Services,”, RFC 2475, 1998. [12] J. Shin, J. W. Kim, D. C. Lee, and C.-C. J. Kuo, “Adaptive packet forwarding for relative differentiated services and categorized packet video,” in IEEE Int. Conf. Communications, Helsinki, Finland, Jun. 2001. [13] K. Psounis, “Active networks: Applications, security, safety, and architectures,” IEEE Communication Surveys, vol. 2, no. 1, 1999. [14] G. T. Karetsos, S. A. Kyriazakos, and G. Karagiannopoulos, “Supporting mobile IP in an active networking environment,” in IEEE Wireless Communications and Networking Conf. 2000, Chicago, USA, Sep. 2000. [15] K. Yang, A. Galis, and C. Todd, “Policy-based active grid management architecture,” in 10th IEEE Int. Conf. Networks: Toward Network Superiority, Singapore, Aug. 2002. [16] C. Lee, E. Coe, J. M. Clark, and B. Davis, “Managing advanced communication services using active network overlays in grid environments,” in The 4th Annu. Int. Workshop on Active Middleware Services, Edinburgh, U.K., Jul. 2002. [17] S. Lavington, N. Dewhurst, and M. Ghanbari, “The performance of layer video over IP network,” in Packet Video 2000, Forte Village Resort, Italy, May 2000. [18] J. M. Smith and S. M. Nettles, “Active networking: One view of the past, present, and future,” IEEE Trans. Syst., Man Cybern., C, pp. 4–18, Feb. 2004. [19] W. Zhao, D. Olshefski, and H. Schulzrinne, “Internet Quality of Service: An Overview,” Columbia University, Computer Science Department, Columbia Technical Report, CUCS-003-00, 2000. [20] T. Ahmed, G. Buridant, and A. Mehaoua, “Encapsulation of and marking of MPEG-4 video over IP differentiated services,” in IEEE Symp. Computers and Communications, Hammamet, Tunisia, Jul. 2001. [21] D. Clark, S. Shenker, and L. Zhang, “Supporting real-time application in an integrated services packet network: Architecture and mechanism,” in ACM SIGCOMM’92, Baltimore, USA, Aug. 1992. [22] D. Clark and W. Fang, “Explicit allocation of best-effort packet delivery service,” IEEE/ACM Trans. Networking, vol. 6, pp. 362–373, Aug. 1998. [23] R. Mahajan, S. Floyd, and D. Wetherall, “Controlling high-bandwidth flows at congested router,” in 9th IEEE Int. Conf. Network Protocols, Riverside, USA, Nov. 2001. [24] Smitha and A. L. N. Reddy, “LRU-RED: An active queue management scheme to contain high bandwidth flows at a congested router,” in IEEE Globecom’01, San Antonio, USA, Nov. 2001. [25] T. J. Ott, T. V. Lakshman, and L. H. Wong, “SRED: Stabilized RED,” in IEEE INFOCOM’99, New York, USA, Mar. 1999. [26] J. W. Causey and H. S. Kim, “Comparison of buffer allocation schemes in ATM switched: Complete sharing, partial sharing and dedicated allocation,” in Int. Conf. Communications, New Orleans, LA, USA, May 1994. [27] Y. Wang, M. Claypool, and Z. Zuo, “An empirical study of real video performance across the internet,” in ACM SIGCOMM Internet Measurement Workshop, San Francisco, USA, Nov. 2001.