Crossover / ECSA Diagnostics Mode with the 850 Fuel Cell Test Station.
Introduction. This application note describes use of the 850 Fuel Cell Test System
and ...
Application Note – Automated Crossover / ECSA Measurement
Application Note – Automated Switching between Fuel Cell Operation and Fuel Crossover / ECSA Diagnostics Mode with the 850 Fuel Cell Test Station
Introduction This application note describes use of the 850 Fuel Cell Test System and accessories to perform completely automated transition from normal PEM fuel cell operation to in-situ electrochemical fuel crossover and electrochemical surface area measurement. The hardware and software components required are described and example data are presented. Background – Why Perform Fuel Crossover and ECSA Measurements? Fuel crossover rate, whether H2, methanol or other fuel, is an important property of PEM fuel cells and is often used as an indicator of membrane health and cell failure. In addition to the fuel crossover rate, this in-situ method can also reveal the presence and magnitude of electrical short within the cell. The fuel crossover rate is typically measured after cell assembly (i.e., beginning-of-life) as one measure of the cell build quality. A crossover rate threshold is also frequently used as an end-of-life criteria, for example in durability or accelerated stress testing to define cell failure. Electrochemical surface area (ECSA) and catalyst utilization are also commonly determined properties of PEM fuel cells. ECSA is determined using conditions similar to those used for crossover rate determination and therefore are commonly performed back-to-back. ECSA is a measure of the active area of the catalyst of the fuel cell and is indicative of the quality or effectiveness of the electrode production or application method and materials. Utilization is determined from the ECSA and quantifies the proportion of the catalyst available to participate in the electrochemical reactions vs. the total area of catalyst in the electrode layer. In-situ ECSA measurement is a common method employed in electrode materials development (catalyst, catalyst support and ionomer), catalyst layer (electrode) manufacturing method development, and electrode degradation studies. The principle and features of the in-situ fuel crossover, ECSA and voltammetry are described in the references cited at the end of this application note. It is recommended that users be familiar with these techniques before attempting to implement the fully-automated method described below.
System Requirements 1. 850C or 850e Fuel Cell Test System 2. 885 Fuel Cell Potentiostat 3. 850 Auto Multigas System 4. FuelCell (ver 4.0e) or later with auxiliary fuel control capability “fuelaux.ini” installed 5. Anode Reactants: Hydrogen (or methanol or other fuel) 6. Cathode Reactants: Air or oxygen for normal fuel cell operation, nitrogen for in-situ crossover / ECSA measurement 7. PEM (or DMFC) fuel cell
© 2011 Scribner Associates, Inc.
1
Application Note – Automated Crossover / ECSA Measurement
Setup 1. Install the 850 Fuel Cell Test System 2. Install the 885 Fuel Cell Potentiostat 3. Install the 850 Auto MultiGas (AMG). The following gases are required and should be plumbed to the indicated inlets on the 850 AMG: a. H2: Anode Inlet A b. Air (or oxygen): Cathode Inlet A c. N2: Cathode Inlet B d. Note: It is recommended that unused inlet ports on the 850 AMG be capped 4. Install FuelCell software version 4.0e or higher and the fuelaux.ini file as described in the AMG installation and setup guide. 5. Download the FuelCell setup file “850-AMG.fc3” from www.scribner.com/files/amg/850AMG.fc3 or contact Scribner Associates at
[email protected]. a. This FuelCell setup file consists of an experiment list that will execute the transition of the fuel cell from normal operating mode to the crossover / ECSA operating mode, perform the LSV and CV scans. b. Notes: Parameters of the experiments in this lets should be changed as needed. For example, the flow rates, cell and humidifier temperatures, duration of delays, LSV and CV scan rate, number CV cycles, etc. can be selected to obtain the desired test conditions. c. The default conditions are generally suitable for a 25 cm2 H2 PEM cell with diagnostics performed at 40 oC and 100% RH inlet gases.
© 2011 Scribner Associates, Inc.
2
Application Note – Automated Crossover / ECSA Measurement
General Procedure The FuelCell setup file “FuelCell 850 AMG.fc3” contains the following list of experiments used automatically perform the LSV (for fuel crossover) and CV (for ECSA) using an 850, 885 Potentiostat and 850 AMG. No. Experiment Type 1 Setup Fuel 2 3
5
Open Circuit Constant current Constant current Setup Fuel
6
Open Circuit
7
PSTAT Sweep
8
Open Circuit
9
PSTAT Sweep
4
Default Parameters
Important Experiment Parameters 0.1 SLM H2 / 1.0 SLM N2, N2 flow rate, humidifier 40 oC humidifiers temperatures 2 min Duration 0.25 A, 5 min, terminate Current, duration, experiment when Ecell < 0.1 V terminate voltage 0.1 A, 5 min, terminate Current, duration, experiment when Ecell < 0.1 V terminate voltage 0.1 SLM H2 / 0.1 SLM N2, Flow rates, humidifier 40 oC humidifiers temperatures 2 min Duration Voltage scan from 0 V vs. Sweep rate, final potential OCV to 0.6 V vs. REF at 1 mV/sec 1 min Duration Voltage scan between Vertex #1 = 0.005 V vs. OCV and Vertex #2 = 0.9 V vs. REF, 20 mV/sec, 10 points/sec, 3 cycles 0.1 SLM H2 / 1.0 SLM Air, 40 oC humidifiers
Sweep rate, Vertex #1 and Vertex #2 potentials, number of cycles, points/sec
11 Open Circuit
1 min
Duration
12 Setup Fuel
0.1 SLM H2 / 0.1 SLM Air, 40 oC humidifiers
Flow rates, fixed or stoichiometric flow rate control, humidifier temperatures
10 Setup Fuel
Flow rates, humidifier temperatures
Comment Switch to N2 on cathode; set high N2 flow rate to purge O2 Delay while cathode purges with N2 Apply small current to consume residual O2 to decrease cell OCV Apply small current to consume residual O2 to decrease cell OCV Decrease N2 flow rate to value appropriate for crossover / ECSA Delay while cell voltage stabilizes; should be < 0.1 V LSV for crossover and electrical short Delay while cell voltage stabilizes after LSV; should be < 0.1 V 3 CVs for ECSA
High air flow rate to purge cathode of N2, prepare for fuel cell operating mode Delay while cathode purges with airV Establish normal operating flow rates
Screenshots of the Experiment List in the FuelCell setup file “FuelCell 850 AMG.fc3”
Sample Data As an example of this procedure, the cell voltage, current, and anode and cathode flow rates are shown in following graphs. Individual experiments are indicated by the dashed lines. © 2011 Scribner Associates, Inc.
3
Application Note – Automated Crossover / ECSA Measurement 0.3
Current (A)
0.2 0.1 0.0 -0.1 Experiment #
-0.2
1 2
-0.3
3 4
5 6
7
8
10 11 12
9
4
6
8
10
12
14
16 18 Time (min)
20
22
24
26
28
30
4
6
8
10
12
14
16 18 Time (min)
20
22
24
26
28
30
4
6
8
10
12
14
16 18 Time (min)
20
22
24
26
28
30
28
30
Cell Voltage (V)
1.00 0.75 0.50 0.25 0.00
Cathode Flow (L/min)
1.25 1.00 0.75 0.50 0.25 0.00
Anode Flow (L/min)
0.3 1 2
0.2
3 4
5 6
7
Experiment #
8
10 11 12
9
0.1 0.0 -0.1 -0.2 4
6
© 2011 Scribner Associates, Inc.
8
10
12
14
16 18 Time (min)
20
22
24
26
4
Application Note – Automated Crossover / ECSA Measurement
Voltammogram from the LSV used for H2 crossover rate ~ 2 mA/cm2. The cell exhibits a significant electrical short as well, as evidenced by the positive slope at Ecell > 0.3 V. 5 Crossover LSV.fcd
Current Density (mA/cm²)
4
3
2
1
0 0
0.1
0.2
0.3
0.4
0.5
0.6
0.7
Cell Voltage (V)
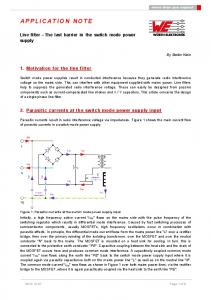
Data from Cyclic Voltammetry used to determine ECSA by the hydrogen adsorption / desportion method. 15 ECSA CV.fcd
Current Density (mA/cm²)
10
5
0
-5
-10
-15 0
0.1
0.2
0.3
0.4
0.5
0.6
0.7
0.8
0.9
1.0
Cell Voltage (V)
© 2011 Scribner Associates, Inc.
5
Application Note – Automated Crossover / ECSA Measurement
Suggested Reading and References General 1. K.R. Cooper, V. Ramani, J.M. Fenton, H.R. Kunz, Experimental Methods and Data Analyses for Polymer Electrolyte Fuel Cells, Scribner Associates, Inc.: Southern Pines, NC (2005). 2. A.J. Bard and L. Faulkner, Electrochemical Methods: Fundamentals and Applications, New York, NY: John Wiley & Sons (2001). In-situ Fuel Crossover Rate and E;ectrical short by Linear Sweep Voltammetry 1. K.R. Cooper, “In Situ PEM Fuel Cell Fuel Crossover and Electrical Short Circuit Measurement," Fuel Cell Magazine, Aug/Sept, 34-35 (2008). (pdf) 2. X. Ren, T.E. Springer, T.A. Zawodzinski and S. Gottesfeld, "Methanol Transport Through Nafion Membranes - Electro-osmotic Drag Effects on Potential Step Measurements," Journal of the Electrochemical Society, 147, 466-474 (2000). In-situ Electrochemical Surface Area by Cyclic Voltammetry 1. K.R. Cooper, “In Situ PEM Fuel Cell Electrochemical Surface Area and Catalyst Utilization Measurement," Fuel Cell Magazine, Jan/Feb, 28-30 (2009). (pdf) 2. K. Kinoshita and P. Stonehart, "Preparation and Characterization of Highly Dispersed Electrocatalytic Materials" in Modern Aspects of Electrochemistry, Vol. 12, Ch. 4, J.O.M. Bockris and B.E. Conway, Eds., Plenum Press: New York, 183-266 (1977). 3. T.R. Ralph, G.A. Hards, J.E. Keating, S.A. Campbell, D.P. Wilkinson, M. Davis, J. St-Pierre and M.C. Johnson, "Low Cost Electrodes for Proton Exchange Membrane Fuel Cells -Performance in Single Cells and Ballard Stacks," Journal of the Electrochemical Society, 144, 3845-3857 (1997). 4. F. Gloaguen, J.-M. Leger and C. Lamy, "Electrocatalytic Oxidation of Methanol on Platinum Nanoparticles Electrodeposited onto Porous Carbon Substrates," Journal of Applied Electrochemistry, 27, 1052 (1997). 5. K.C. Neyerlin, W. Gu, J. Jorne, J.A. Clark and H.A. Gasteiger, "Cathode Catalyst Utilization for the ORR in a PEMFC," Journal of the Electrochemical Society, 154, B279-B287 (2007). 6. Parthasarathy, B. Dave, S. Srinivasan, J.A. Appleby and C.R. Martin, "The Platinum Microelectrode/Nafion Interface: An Electrochemical Impedance Spectroscopic Analysis of Oxygen Reduction Kinetics and Nafion Characteristics," Journal of the Electrochemical Society, 139, 16341641 (1992). 7. K.H. Kangasniemi, D.A. Condit and T.D. Jarvi, "Characterization of Vulcan Electrochemically Oxidized under Simulated PEM Fuel Cell Conditions,” Journal of the Electrochemical Society, 151, E125-E132 (2004). 8. R.N. Carter, S.S. Kocha, F.T. Wagner, M. Fay and H.A. Gasteiger, "Artifacts in Measuring Electrode Catalyst Area of Fuel Cells through Cyclic Voltammetry," ECS Transactions, 11(1), 403-410 (2007).
© 2011 Scribner Associates, Inc.
6