Nov 12, 2004 - capture the alloy properties predicted from first-principles electronic structure ..... tight-binding analysis of the energetics of Mo-W, in full agreement with the .... reciprocal lattice positions that are indicative of a B2 signature 3].
UCRL-JRNL-207953
Application of Ab Initio and CALPHAD Thermodynamics to Mo-Ta-W Alloys
P. E. A. Turchi, V. Drchal, J. Kudrnovsky, C. Colinet, L. Kaufman, Z-K. Liu November 12, 2004
Physical Review B
Disclaimer This document was prepared as an account of work sponsored by an agency of the United States Government. Neither the United States Government nor the University of California nor any of their employees, makes any warranty, express or implied, or assumes any legal liability or responsibility for the accuracy, completeness, or usefulness of any information, apparatus, product, or process disclosed, or represents that its use would not infringe privately owned rights. Reference herein to any specific commercial product, process, or service by trade name, trademark, manufacturer, or otherwise, does not necessarily constitute or imply its endorsement, recommendation, or favoring by the United States Government or the University of California. The views and opinions of authors expressed herein do not necessarily state or reflect those of the United States Government or the University of California, and shall not be used for advertising or product endorsement purposes.
submitted to Phys. Rev. B
Application of Ab Initio and CALPHAD Thermodynamics to Mo-Ta-W Alloys P. E. A. Turchi Lawrence Livermore National Laboratory, L-353, P.O. Box 808, Livermore, CA 94551, USA
V. Drchal and J. Kudrnovsk�y Institute of Physics, Academy of Sciences of the Czech Republic, Na Slovance 2, CZ-180 40 Praha 8, Czech Republic
C. Colinet LTPCM-ENSEEG, Domaine Universitaire, BP 75, F-38402 Saint Martin d'H eres, France
Larry Kaufman Dept. of Materials Science and Engineering, MIT, Cambridge, MA 02139
Zi-Kui Liu Dept. of Materials Science and Engineering, The Pennsylvania State University, University Park, PA 16803
(October 8, 2004)
Abstract A parameter-free electronic structure approach is applied to the study of stability and chemical order in substitutional bcc-based Mo-Ta, Ta-W and Mo-W alloys. The method is based on a Green function description of the electronic structure of random alloys. Con gurational order is treated within
1
the generalized perturbation method, and temperature e ects are accounted for by a generalized mean- eld approach. The practical application of this study to phase stability in Mo-Ta-W alloys is tested by converting the ab initio output thermodynamics of the three binary subsystems to a format
amenable to a CALPHAD treatment. The results of this conversion are then used to predict isothermal sections of the ternary phase diagram of the MoTa-W system that are compared with the results obtained directly from the ab initio approach with the cluster variation method. It is concluded that the
proposed CALPHAD conversion of the ab initio results is a viable scheme to capture the alloy properties predicted from rst-principles electronic structure calculations. 61.66.Dk, 64.60.Cn, 71.20.Be, 81.30.Bx
Typeset using REVTEX 2
I. INTRODUCTION According to the assessed phase diagrams of the Mo-W, Mo-Ta, and Ta-W systems, the pure elements form in the solid phase a continuous series of body centered (bcc or A2, or ) solid solutions with each other, with no existence of intermediate phases or superlattices �1]. However indications exist that at least two of these alloys should display chemical order. For Mo-Ta alloys, it has been observed that the evolution of the lattice parameter with alloy composition exhibits a negative departure from Vegard's law �2{4]. Note that the positive departure observed in Ref. �5] has been attributed to the neglect of the measurement of the molybdenum weight loss in the samples. In addition, the relative magnitude of the peak heights as a function of alloy composition measured by X-ray di�raction has been attributed to short-range order (SRO) �3]. This SRO combined with size e�ect has been associated with the cleavage fracture of Mo-Ta alloys located in the central region of the phase diagram. Finally, the activities of Ta and Mo exhibit large negative deviations from ideality (Raoult's law), and the overall measured thermodynamic properties between 1000 K and 1300 K �5] are compatible with the existence of SRO. These sparse experimental facts have led us to reexamine this alloy system with a �rst-principles approach to stability and chemical order. Similar experimental �ndings have been reported in the literature for the Ta-W system �6,7], and a recent �rst-principles analysis has led to the prediction of two ordered phases, namely B2 around equi-atomic composition and D03 around TaW3 and Ta3W �8]. Except for the determination of the solidus-liquidus line, very few results are available about the solid-phase portion of the phase diagram of Mo-W alloys. Hence in this paper, the study has been extended to Mo-Ta and Mo-W with a similar �rst-principles approach to examine the ternary Mo-Ta-W alloy. The con�gurational order has been formulated within the Generalized Perturbation Method (GPM) �9{12]. The electronic properties of the reference medium on which the GPM relies were described in the framework of the self-consistent tight-binding-linear mu�n-tin orbital (TB-LMTO) multiple scattering formulation of the Coherent Potential Approximation (CPA) �12,13]. Finally, 3
temperature e�ects on local order and stability were accounted for by means of a standard generalized mean-�eld approach, namely the cluster variation method (CVM) �10,14]. From the �rst-principles thermodynamic analysis, Mo-Ta alloys should exhibit a de�nite tendency toward order with a B2 (or ) superstructure of CsCl-type. The theoretical analysis also reveals a low-lying phase diagram that supports the experimental �ndings discussed above. The critical order (B2)-disorder (A2) line exists below 1772 K with a maximum transition temperature around 47 at.% Ta. Similar �ndings have been reported in the case of Ta-W alloys with a maximum critical B2-A2 around 57 at.% W and slightly below 1000 K �8]. For all practical purposes, we will neglect in the following the existence of a D03 ordered structure that exists below 200 K around TaW3 and 100K around Ta3W, since this long-range order (LRO) can never be observed (the energetics associated with the SRO of D03 -type is quite negligible at temperatures where this alloy can �nd applications). Finally, our results show that the Mo-W alloy system should exhibit a negligible heat of formation and almost no SRO as would be expected for an ideal solid solution. Before analyzing the data for the ternary Mo-Ta-W alloy (for which no data, assessed or measured, are available) the results from ab initio calculations indicate that two of the binary subsystems, Mo-Ta and Ta-W, exhibit a tendency towards order with a broad range of stability of the B2 ordered phase below 1770 K and 1000 K, respectively, whereas MoW behaves like an ideal solid solution. Prior to the investigation of the phase diagram of the ternary alloy, the predicted output thermodynamic information deduced from ab initio calculations for Mo-Ta and Ta-W will be converted in a Redlich-Kister/Bragg-Williams format �15,16] to express the Gibbs energy of each binary alloy in a form amenable to a so-called CALPHAD (CALculation of PHAse Diagrams) thermodynamic treatment �17{19]. This conversion will then allow us to explore the impact of the predicted chemical order in the binaries on ternary-phase equilibrium, and to predict isothermal sections of the ternary phase diagram of Mo-Ta-W. The phase diagram results compare advantageously to those obtained from a CVM treatment directly applied to the ternary system with input energetics from the ab initio calculations. It is worth noting that since all three pure metals and their 0
4
binary combinations are stable in the bcc structure, the questions that may arise about lattice stability �18{20] between the results of the ab initio approach and CALPHAD do not apply here. The paper is organized as follows. In section II, we discuss the electronic structure and equilibrium properties of Mo-Ta, Mo-W, and Ta-W alloys based on a �rst-principles TB-LMTO-CPA description of the electronic structure of disordered alloys. In section III we present the results of the ground-state analysis of the Ising Hamiltonian based on a treatment of ordering within the GPM. In section IV the in�uence of temperature on stability and local order is studied with a standard generalized mean-�eld approach and the predicted coherent phase diagrams are presented. Then in section V, we show how the thermodynamic information obtained from ab initio can be used to cast the Gibbs energy for each phase of the three binaries in a CALPHAD format to give properties that favorably compared with those directly derived from ab initio. In section VI, the CALPHAD approach is used to describe the thermodynamics of the ternary Mo-Ta-W alloys, and the results on some isothermal sections of the ternary phase diagram are discussed with and without direct input from ab initio calculations for comparison sake. The CALPHAD ternary phase diagram of Mo-Ta-W is compared with the one obtained from the direct application of the CVM to the ternary system with the input energetics from the binary subsystems obtained from ab initio. Finally, in section VII, conclusions are drawn on the validity and potential applications of this procedure.
II. ELECTRONIC STRUCTURE AND EQUILIBRIUM PROPERTIES In a previous study we reported the electronic structure properties of Ta-W based on a proper treatment of the disordered alloys �8]. Since the single-site CPA, expressed with the Green's function formalism and implemented within the TB-LMTO-CPA �12], provides an appropriate basis, the same methodology has been applied to the other binaries Mo-Ta and Mo-W for completeness. The electronic structure calculations were carried out on the 5
basis of the charge self-consistent fully relativistic version of the TB-LMTO-CPA method within the atomic sphere approximation (ASA) and the local density approximation (LDA) of density functional theory. The LDA calculations were based on the exchange-correlation energy of Ceperley and Alder �21] as parameterized by Perdew and Zunger �22]. To eliminate the charge transfer e�ects, at each lattice parameter and alloy composition, the atomic sphere radii of the two species were adjusted in such a way that atoms were charge neutral while preserving the total volume of the alloy. In our calculations we used 168 k-points in the irreducible wedge of the Brillouin zone to perform the integrations that are necessary during the self-consistent calculations, and 2320 k-points in the full Brillouin zone for the calculation of the e�ective cluster interactions within the GPM. We use 12 energy points on a semi-circle in the upper half-plane of complex energy to perform the energy integration using Gauss' method. The densities of states (DOS) were evaluated on a line 0.005 Ry above the real axis (with an energy step of about 5 mRy) and then deconvoluted on the real axis. The CPA equations were solved iteratively using the method described in Ref. �12]. In Fig. 1 we display the DOS of the alloy species and of the chemically random alloys at equi-atomic composition. Although the DOS of the three transition metals are similar, note that, at the Fermi energy, the DOS of Ta is located in a region of high density, whereas those of Mo and W are in the pseudo-gap region. This simply re�ects the variation of the number of valence electrons Nv from 4 for Ta to 5 for Mo and W. The minor di�erences in the DOS of Mo and W can be solely attributed to the di�erence in electronic properties between the 4d and 5d series, and mostly to relativistic e�ects. The overall shape of the DOS is preserved in the alloy cases. However, the DOS of the two equi-atomic alloys TaMo and TaW display a stronger e�ect due chemical disorder since the di�erence in the numbers of valence electrons �Nv is equal to unity, as opposed to 0 in the MoW case. At this composition, the Fermi energy of TaMo and TaW correspond to Nv = 4:5 whereas the one of MoW is kept �xed at Nv = 5 pretty much at the same location in the pseudo-gap as in the case of the pure metals Mo and W. Since disorder is minimal for these alloys, the deep minimum observed in the DOS still corresponds to a clear separation between bonding 6
and anti-bonding states in the alloy band structure, and the overall DOS remain practically unchanged with alloy composition. Thus the variation of the electronic structure properties with alloy composition is almost entirely re�ected in the variation of Nv, and therefore in the location of the Fermi energy as would be the case for an alloy treated within the virtual crystal approximation. P eq In Fig. 2, we show the departure from Vegard's law, given by �aeq = aeq alloy ; i ci ai , where aeqi is the equilibrium lattice constant of the pure element i, for the three chemically random alloys at composition ci and equilibrium lattice parameter aeqalloy. We also report the curves obtained from the experimentally measured lattice parameter (in � A) versus composition represented by a = 3:164 + 0:1054 cTa + 0:03226 c2Ta �6] in the case of Ta-W, and by a = 3:146+0:1209 cTa + 0:03398 c2Ta in the case of Ta-Mo �2,4]. Note that the equilibrium lattice parameters of Ta, Mo, and W from these calculations are 3.2806, 3.1738, and 3.1808 � A, compared with the experimental values of 3.3009, 3.146, and 3.164 � A, respectively. Although there is about a 1% discrepancy between the theoretical and experimental values of lattice constant, the departure from Vegard's law are well reproduced. The results suggest that alloy formation is favored, at least in the case of Ta-Mo and Ta-W, and should lead to a denser structure than a simple combination of both alloy species would. Figure 3 displays the variation of the bulk modulus for each of the chemically random alloys with composition. For the pure elements, there is a typical 15% discrepancy between predicted and measured values. One should note that, as observed experimentally, a onevalence electron di�erence leads to a 50% (35%) increase in the bulk modulus when going from Ta to W (Mo). For comparison purposes, we report in Table I the equilibrium lattice constant and bulk modulus for the pure species, obtained by two ab initio approaches. Method 1 refers to the standard scalar relativistic LMTO-ASA �23] with inclusion of so-called combined corrections that account for overlap of atomic spheres and for higher partial waves inside the atomic spheres, and with exchange and correlation potential proposed by von Barth and Hedin �24]. Method 2 corresponds to the fully relativistic TB-LMTO-ASA-CPA �12], that has been 7
selected in this work for its applicability to o�-stoichiometric alloys (including the pure elements), whereas method 1 is only applicable to stoichiometric alloys (and pure elements) describable by supercells. Note that both methods give values for the lattice constant and the bulk modulus which are within the error expected from any LDA calculation. Finally in Fig. 4 we show the variation of the formation (or mixing) energy of the chemically random alloy with composition. This energy for an A-B alloy is given by CPA ; �Emix = Ealloy
X c E eq i
i i
(2.1)
CPA is the total energy of the alloy described within the CPA at its equilibrium lattice where Ealloy parameter, and Eieq is the total energy of pure species i at its corresponding equilibrium lattice parameter. This mixing energy is negative in the case of Ta-W and Ta-Mo with a maximum value of ;12:292 and ;17:670 kJ/mol at a tantalum composition of about 0.375 and 0.433, respectively (To make contact with the CALPHAD results, J/mol is adopted as the units of energy). Note that in the case of Mo-W the maximum mixing energy is -51 J/mol, i.e., zero for all practical purposes. Hence, the energetics favors the formation of the disordered alloy con�guration in the whole range of alloy composition for Ta-Mo and Ta-W alloys. On the other hand, Mo-W behaves like an ideal solid solution. Our results con�rm a previous conclusion drawn from a semi-empirical tight-binding estimation of the energy of formation of the random Ta-W and Ta-Mo alloys as a function of composition �25]. However in this study, the tight-binding energies are way underestimated, and the general evolution of the formation energy with alloy composition does not reveal any asymmetry as it should since the DOS at the Fermi energy that controls the strength of the bonding in these two alloys varies signi�cantly with composition (i.e., the number of valence electrons). Once again, since Ta-Mo and Ta-W are iso-electronic, the di�erence in the bond strength can solely be attributed to relativistic e�ects that impact band hybridization �26]. Note that the tight-binding analysis of the energetics of Mo-W, in full agreement with the present results, suggests a negligible contribution of d-band mixing to the mixing energy since �Nv = 0 �25,27].
8
III. GROUND-STATE PROPERTIES Within the GPM �9{12], the quantum mechanical description of the alloy energetics is mapped onto an Ising model by expressing the formation energy of an alloy A1 cBc in a particular con�guration C as the sum of two terms: a con�guration-independent but composition-dependent term, �Edis(c), that is associated with a reference medium, and a con�guration-dependent term, the ordering energy �Eord(fpn g), that can be expanded to lowest order in perturbation in terms of pair interactions that are composition dependent according to ;
C
�Eord(fpn g) = 21
X V �c �c nm n m
n m=n
(3.1)
6
where �cn refers to the �uctuation of composition at site n, �cn = pn ; c, where c is the concentration in B-species, and pn is an occupation number associated with site n, equal to 1 or 0 depending on whether or not the site is occupied by a B-species. The Vnm corresponds to an e�ective pair interaction between site n and m that is composition dependent and is AA + V BB ; 2V AB . At zero temperature Eq.(3.1) takes the simple given by the combination Vnm nm nm form �Eord(fqsg) '
Xq V s
s s
(3.2)
BB with qs = 2c (nBB s ; cns ), where ns and ns refer to the number of BB pairs and the total number of pairs per site, respectively, associated with the sth-neighbor shell, and c is the concentration in B species. In this last equation, Vs represents a sth-neigbor e�ective pair interaction (EPI). Hence, the sign convention that has been adopted is such that when Vs > 0 (< 0), AB (AA or BB) pairs associated with a species at the origin and the other in the sth-neighbor shell are favored. As seen from Eq.(3.2), any alloy con�guration is speci�ed by a unique set of parameters fqsg that only depends on site occupancies. For example, at zero temperature and for s = 1-5, these parameters take the values ;1, 3/4, 3/2, ;3, 1 for B2 order (of CsCl-type) at
9
equi-atomic composition and ;1=4, ;3=16, 9/8, ;3=4, ;1=4 for D03 order (of Fe3Al-type) at c = 1=4� 3=4. For all three alloy systems, the EPIs were computed from the knowledge of the electronic structure of the chemically random state within the CPA that is chosen as the reference medium at each composition and lattice parameter �9{11]. In Fig. 5 the �rst and second neighbor pair interactions, V1 and V2, are plotted as functions of alloy composition at the equilibrium lattice parameter and Fermi energy of the corresponding chemically random alloy. The more distant EPIs (Vs , s � 3), at least an order of magnitude smaller than the �rst two EPIs, contribute very little to the ordering energy. Also the variation of lattice parameter (and therefore pressure) has a negligible in�uence on the magnitude of the EPIs at any alloy composition. The results of a ground-state analysis of the Ising model applied to the bcc lattice �10,28{31], together with the magnitude and sign of the EPIs displayed in Fig. 5 lead to the prediction of the most probable ground states at zero temperature. In the case of Ta-W alloys, two ground states exist: the D03 ordered phase for TaW3 , and to a less extent Ta3W, and the B2 ordered phase for TaW, with the corresponding ordering energies equal to about ;2:035, ;1:076, and ;5:340 kJ/mol, respectively �8]. For Mo-Ta alloys, only a B2 ordered state at equi-atomic composition is found with an ordering energy of about ;8:446 kJ/mol. Overall, the ordering tendencies are stronger for the W-rich Ta-W and Mo-rich Ta-Mo alloys, and this trend is consistent with what is expected for transition metal alloys �10,11]. Indeed, the variation of the dominant EPIs with the number of d-electrons displays in general two zeros that are located around 3 and 7 d-electrons, with a positive sign of the EPIs in the central region (that indicates an ordering trend). Although the location of the zeros varies with the scattering properties of the electrons and alloy composition, hetero-atomic pairs are increasingly favored when the number of d-electrons increases from Ta (about 3.3) to Mo or W (about 4.4) in the Ta-Mo or Ta-W case, which is what Fig. 5 shows in a more quantitative way. Since Mo and W are iso-electronic, diagonal disorder e�ects are negligible and the ordering trend is rather negligible. In the case of Mo-W, with V1 < 0 and V2 > 0, the prediction of a slight tendency towards phase separation con�rms the conclusions drawn 10
from a semi-phenomenological tight-binding approach �25,27]. To con�rm the GPM predictions, calculations were performed with method 1, LMTOASA, mentioned in section II, and compared with those of method 2, i.e., TB-LMTO-ASACPA-GPM, to study the equilibrium properties and the energetics of the ordered B2 phase of Ta50W50. In the case of method 2, the energy of formation of the ordered con�guration B2 is B2 = �Emix +�E B2 , see Eqs. (2.1) and (3.2). The equilibrium lattice constant given by �Eform ord B2 with respect to volume since, of the B2 phase was obtained by minimizing the energy �Eform from the CPA and the GPM calculations, the variation with volume of �Emix and of the B2 are known. The results of both methods, EPIs that built up the ordering energy �Eord reported in Table I, are consistent in the sense that the formation energy of the ordered B2 phase, of the order of ;11 and ;17 kJ/mol from methods 1 and 2, is negative, and therefore favors phase formation. The variation in the results, within the error expected from any LDA calculation, re�ects the various levels of approximation that characterize each method: form of exchange-correlation potential, and scalar relativistic versus fully relativistic treatment. However, one can note that the departure of the lattice constant from Vegard's law given by both methods is about ;0:008 � A, once again consistent with a tendency towards alloy formation and order. These ordering trends con�rm previous analysis performed within tight-binding �25] and with full-potential LMTO electronic structure calculations �8] in the case of Ta-W alloys, and with the VASP implementation �32] of pseudo-potential electronic structure method �33] and tight-binding analysis �27,34] in the case of Ta-Mo.
IV. STABILITY AT FINITE TEMPERATURE By making use of the energetics presented in sections II and III the Ising model has been solved with the CVM �10,14]. At each temperature and alloy composition, the con�gurational part of the free energy has been minimized with a Newton-Raphson technique. For the bcc-based alloys considered here, the irregular tetrahedron made of four �rst and two second-nearest-neighbor pairs �35] was considered as the maximum cluster that characterizes 11
the level of approximation of the CVM. This cluster allows a proper statistical treatment with the EPIs V1 and V2 included in the pair expansion of the Ising model, an approximation which is justi�ed here since the more distant EPIs have negligible amplitude. The predicted phase diagrams of Ta-Mo and Ta-W are presented in Fig. 6. Considering the high melting point of the alloy species, the B2 ordered phase of Ta-W and Ta-Mo alloys are stable at low temperature, not exceeding 1000 K and 1800 K, respectively. More details about the Ta-W phase diagram can be found in Ref. �8] where the region of stability of the D03 ordered structure below room temperature is discussed. The asymmetry of both phase diagrams is a direct consequence of the alloy energetics that exhibits an extremum in the mixing energy, see Fig. 4, and stronger ordering trends, see Fig. 5, for W-rich and Mo-rich Ta-based alloys. In what follows, for all practical purposes, we will ignore the existence of the D03 phase in the case of the Ta-W system, and will assume that the Mo-W alloy behaves like an ideal solid solution since its phase diagram in the solid phase displays a miscibility gap well below room temperature. Note also that despite the noticeable di�erence in the elastic properties of Ta, Mo, and W, the vibrational free energy estimated from a simple Debye theory �36] is more than an order of magnitude smaller than the CVM free energy, and therefore has little e�ect on the predicted phase diagrams displayed in Fig. 6. In summary, for both Ta-W and Ta-Mo alloys, the existence of a region of B2 order in the phase diagram is predicted. This �nding obviously translates in a negative departure of the species-resolved activities �37] from linearity as a function of alloy composition (Raoult's law), as con�rmed experimentally in the case of Ta-W �7,8]. In the present study, the departure from linearity not only indicates a tendency towards formation of the Ta-W and Ta-Mo solid solutions but also chemical short-range order (SRO). Only one x-ray di�raction investigation reports in the case of Ta-Mo the existence of SRO with peak maxima near the (100) and (300) reciprocal lattice positions that are indicative of a B2 signature �3]. Anomalous dispersion X-ray di�use scattering measurements at a synchrotron source (in the case of Ta-Mo alloys) or neutron di�raction experiments (for Ta-W alloys) are highly desirable, and should reveal unambiguously the nature of the short-range order on samples 12
well annealed at relatively high temperature to promote the thermally activated ordering process. Meanwhile, experimental evidence for such trends can be challenging since slow kinetics at relatively low temperature can obliterate the observation of long-range order in these refractory alloys. The only positive point to make is that since the B2!A2 transition is second order, one should expect strong di�use scattering intensities well above the critical order-disorder temperature and away from stoichiometry, as was shown in the case of Ta-W alloys �8]. Finally, note that cleavage behavior is found for Ta-Mo and Ta-W whereas in the case of Mo-W �ow behavior �5] is observed. This change in mechanical response is consistent with the di�erence in the ordering trends that are predicted here.
V. AB INITIO INPUT TO CALPHAD ALLOY THERMODYNAMICS In this part of the study we are aiming at describing the thermodynamics of the binary systems obtained from ab initio calculations with the CALPHAD formalism so that assessment of the stability properties of the ternary alloy can be easily carried out. We will show that by supplementing the thermo-chemical database with information from ab initio, CALPHAD-based calculations for higher-order component alloys can lead to useful prediction that can guide experiments. The coupling of phase diagram calculations and thermo-chemistry makes CALPHAD a powerful tool to predict the thermodynamic properties of complex multi-component materials �19,38{40]. For the pure elements, we will consider the formulation suggested by the Scienti�c Group Thermodata Europe (SGTE) �41] that gives the Gibbs energy 0G�i (T ) of each element i in a particular phase � with reference to the enthalpy HiSER(298:15K) of element i in a standard element reference state (SER is usually taken as the ground-state structure) at 298.15 K and ambient pressure. These Gibbs energies, expressed as functions of temperature, can be found in Ref. �42]. For a substitutional binary phase (the liquid phase and the bcc-A2 solid solution in the present case), the Gibbs energy is de�ned as �19,38,40]
G� (fcig� T ) =ref G� (fcig� T ) +id G� (fcig� T ) +xc G� (fcig� T ) 13
(5.1)
where ci is the molar fraction of species i in the phase �. In this equation the �rst term represents the concentration-weighted average molar Gibbs energies of the pure elements, the second term is the ideal molar Gibbs energy of mixing (i.e. the mixing entropy contribution), and the last term is the excess Gibbs energy due to non-ideal contributions given by the Muggianu expression �43]. More explicitly the three terms are given by the following equations
X c 0G� (T ) i i i X id G� (fc g� T ) = RT ci ln ci i i xs G� (fc g� T ) = X X c c X pL� (T )(c ; c )p i i j i j ij
ref G� (fc g� T ) = i
(5.2)
p=0 n
i j =i 6
where pL�i j (T ) is the p-th order binary interaction parameter expressed as a polynomial in temperature T that contributes to the so-called Redlich-Kister expansion �44]. To describe the ordered alloy A-B in the B2 phase we will consider a two-sublattice model �45{47] that leads to the de�nition of the three terms entering Eq.(5.1) as follows
X yIyII 0G� (T ) i j ij ij idG� (fy s g� T ) = RT X N X y s ln y s (5.3) s i i i s=I II i xsG� (fy s g� T ) = y I y I X y II X p L� (y I ; y I )p + y IIy II X y I X pL� (y II ; y II)p i A B i A B:i A B A B i i:A B A B
ref G� (fy s g� T ) = i
i
p=0 n
i
p=0 n
where 0 G� ij
0 SER � = NI 0GSER i + NII Gj + �Gi:j
(5.4)
and yis is the fractional site occupation of species i on sublattice s given by the ratio nsi=Ns , with nsi and Ns representing the number of atoms of species i and the total number of sites on sublattice s, respectively. In Eq.(5.3) pL�A B:i is the p-th order interaction parameter between species A and B on the �rst sublattice with species i on the second sublattice (note that a colon separates species occupying di�erent sublattices whereas a comma separates species that interact on the same sublattice). As usually assumed pL�i j:k = pL�i j:k . In the case of the B2 compound the Gibbs energy is expressed as 0
14
Gbcc
B2 (fc g� T ) = Gbcc A2 (fc g� T ) + �Gord(T ) i i
;
;
(5.5)
where Gbcc A2(fcig� T ) is given by Eqs.(5.1) and (5.2), and the ordering energy, �Gord(T ), is written as ;
�Gord(T ) =xs Gord(fyisg� T ) ;xs Gord(fcsig� T )
(5.6)
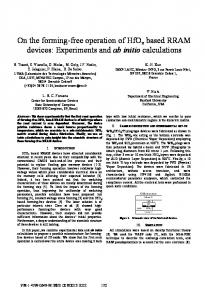
with xsGord(fcsi g� T ) given by Eq.(5.3). For both Ta-W and Ta-Mo alloys, a one-sublattice model is considered for the liquid phase and the bcc-A2 solid solution whereas a two-sublattice model describes the thermodynamics of the bcc-B2 ordered phase. The Gibbs energies and molar enthalpies of formation of the bcc phases (between 800 and 3000 K for Ta-W, and 1500 and 3000 K for Ta-Mo) as well as the location of the second-order critical line that delineates the region of stability of the B2 phase, as obtained from the CVM minimization with the energetics calculated from ab initio, have been considered as input information for the �tting procedure. The procedure itself made use of the PARROT module �48] of the Thermo-Calc application software �49]. Finally to match the energetics between the bcc-A2 solid solution and the liquid phase we assumed that the Redlich-Kister parameters of the two phases were the same except for an extra contribution to 0Lliq A B for the sake of simplicity. Hence, this procedure ensures that the T0 temperature, that is de�ned by the equality of the Gibbs energies of the liquid and the bcc-A2 solid solution at equi-atomic composition, is compatible with the experimental and CALPHAD assessed data on the liquidus-solidus lines �1]. The results of the �t are given in the appendix �50], and the output of the procedure just described will be referred to as ab initio-CALPHAD in what follows. As illustrated in Fig. 7 for Ta-Mo alloys the molar Gibbs energies and enthalpies of formation (solid lines) obtained from the �tting procedure reproduce very well the CVM results in a broad range of temperatures, and well within the range of accuracy accepted in a CALPHAD assessment of experimental data. To compensate for the simple Bragg-Williams approximation the temperature dependence of the Redlich-Kister (or interaction) parameters gives ample �exibility to reproduce low- and high-temperature results at the same time. The fact that SRO is not well accounted for is 15
most seen in Fig. 8 for Ta50Mo50 in the variation of the long-range order (LRO) parameter with temperature, de�ned as I ; y II ) � = 2c1 (yMo Mo
(5.7)
Mo
s is a direct measure of the local composition in Mo species on one of the two simple where yMo cubic sublattices (s=I or II) that form the bcc lattice. The order parameter varies between 0 (fully disordered) to 1 (fully ordered). Note that a better agreement between CVM and CALPHAD LRO parameters could have been achieved by including information on LRO parameters in the �tting procedure in the detriment of a less accurate determination of the Gibbs energies. It is worth noting that the enthalpies of mixing calculated both ways for Ta50Mo50 show di�erences that are within the accuracy of any CALPHAD-type calculations as illustrated in Fig. 8. Another test of the validity of the �tting procedure can be made by analyzing the ab initio results displayed in Fig. 4 for the mixing energy with a second-order Redlich-Kister A2 1 bcc A2 expansion. The coe�cients of the expansion are (in J/mol) 0Lbcc Ta W = ;45� 454, LTa W = A2 1 bcc A2 +27� 961, 0Lbcc Mo Ta = ;69� 341, and LMo Ta = ;19� 629, and compare well with those given in the appendix, keeping in mind that the transcription of the ab initio results in a CALPHAD format has been performed between 800 and 3000 K in the case of Ta-W, and 1500 and 3000 K for Ta-Mo. The overall quality of the �t is re�ected in the comparison of the phase diagrams obtained from this CALPHAD assessment, represented by a solid line in Fig. 6, and the CVM results, represented by open circles in the �gure. Note that the solidus-liquidus lines are those that have been assessed within CALPHAD, based on the available experimental data �1], cf. appendix. In the spirit of a CALPHAD assessment performed on experimental data for which the resulting Gibbs energies implicitly contained information on SRO, good agreement with experimental results can be achieved despite the fact that the con�gurational entropy is treated within the Bragg-Williams approximation. Because the CALPHAD methodology relies on temperature-dependent interactions, low- and high-temperature Gibbs energies can ;
;
;
16
;
be successfully reproduced. To conclude this section, we have shown that the predictions from ab initio alloy thermodynamics can be well accounted for in a CALPHAD framework, and therefore adequately supplement existing phenomenological databases in use to study higher-order component alloys. In the next section we will show that the results obtained for the binaries re-generated in a CALPHAD format can be used to study their impact on the thermodynamics of higherorder component alloys.
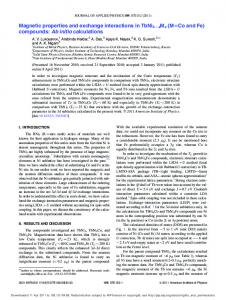
VI. THERMODYNAMIC PROPERTIES OF MO-TA-W ALLOYS To describe the thermodynamic properties of the ternary alloy within ab initio, we will assume that the EPIs obtained for the three binaries are not altered by the presence of a third element. This translates in the neglect of speci�c ternary interaction parameters in the de�nition of the excess Gibbs energy, a common assumption made when describing higher-order component alloys within CALPHAD. In both cases, the excess Gibbs energy is given by a Muggianu-like expression �43], see Eq.(5.2). In existing thermodynamic databases such as SSOL provided by SGTE �41], the three binary subsystems are treated as ideal solid solution (i.e., no excess Gibbs energies), and therefore the solidus-liquidus lines that separate the liquid from the bcc solid solution is the only feature that characterizes isothermal sections of the ternary phase diagram between the melting points of Mo (2890 K) and W (3680 K), as shown in Fig. 9. With the CALPHAD assessment of the ab initio data presented in the previous section the high-temperature isothermal sections are only slightly modi�ed, as shown in the �gure, because of the �tting procedure that guarantees compatibility between the Gibbs energies of the bcc-A2 solid solution and the liquid phase. On the other hand, as expected, the two phase diagrams in the solid phase di�er noticeably. The CALPHAD phase diagram obtained with the SSOL thermodynamic database only displays a region of bcc solid solution whereas, below about 1800 K, the ab initio-CALPHAD one shows in Fig. 10a a region of stability of B2 ordered phase that connects the two binaries Ta-W and 17
Ta-Mo, with a maximum temperature associated with cW =0. It is worth mentioning that because of the assumption made on the description of the ternary system, we may miss some enhancement e�ect due to ternary addition that could lead to a higher order-disorder temperature at �xed and non-zero Mo, Ta, and W mole fractions. To check how well the expression for the Gibbs energy is extended to the ternary case, an ab initio study of the ternary system has been carried out within the approximation alluded to in the introduction of this section. Note that the extension of the CVM to multicomponent systems �51] has been applied to only a few ternary systems, e.g. cf. Refs. �52{54]. In the present case the irregular tetrahedron approximation of the CVM has still been considered for the Mo-Ta-W system (in what follows the irregular tetrahedron will be described by its 4 �rst-neighbor pairs and 2 second-neighbor ones referred to by fik� il� jk� jlg and fij� klg). The internal energy of the bcc-based system per lattice site is expressed as
E =6
Xz � ijkl ijkl ijkl
(6.1)
where �ijkl is the energy of the tetrahedron in the con�guration fijklg with probability zijkl. This energy can be expressed as a function of pairwise interaction energies according to 1 (2) (2) (1) (1) (1) �ijkl = 61 (�(1) (6.2) ik + �il + �jk + �jl ) + 4 (�ij + �kl ) where the constants 1=6 and 1=4 account for the fact that the �rst and second neighbors pairs are common to 6 and 4 tetrahedra, respectively. With the expression (6.1) for the internal energy of an alloy, the energy parameters for the binary subsystems have been rede�ned in such a way that they give the same ordering energies as those obtained within the GPM as follows �53] �AAAB = 61 �EAD03B3 B2 (6.3) �AABB = 16 �EAB B32 �ABAB = 16 �EAB where the sequence fijklg� (i� j = A� B) describes the occupation of the four sites of a tetrahedron as discussed above. The ordering energies on the right-hand side of Eqs. (6.3) 18
are given within the GPM by Eq.(3.2). Note that this method is equivalent to de�ning a Hamiltonian as proposed in the Connolly-Williams method �55], and gives phase diagram results (dashed line) that are almost undistinguishable from those obtained in section IV (open circles), as shown in Fig. 6. In the ternary case, two methods have been considered to estimate the pairwise interaction energies �53], and both neglect ternary interaction parameters . In the �rst method we assume that these energies are given by
�AABC = 21 �AABB + 12 �AACC + 21 �BCBC ; 14 �BBCC �ABAC = 12 �ABAB + 12 �ACAC + 41 �BBCC
(6.4)
with the energies of the other con�gurations obtained by permutation of the species. In the second method, the pairwise interaction energies have been de�ned in such a way that they reproduce the energies of ordered con�gurations speci�cally found in ternary alloys, such as the L21 and F43m ordered states given at the composition A2BC (cf. Ref. �53] for a description of these superstructures). For these two states, the ordering energies are given by 9 V BC L21 A2 BC �Eord = ; 21 (V1AB + V1AC ) + 41 V1BC + 83 (V2AB + V2AC ) ; 16 2 F 43m A2 BC �Eord = ; 38 (V2AB + V2AC ) ; 41 V1BC + 163 V2BC
(6.5)
with corresponding expressions for states at the compositions B2AC and C2AB by permutation of A, B, and C in Eq. (6.5). In these expressions, the VsIJ are in principle those EPIs estimated from GPM calculations for ternary alloys. However to compare the ab initio results to those obtained within the ab initio-CALPHAD treatment of ternary alloys, the EPIs have been evaluated from the data available for the binary subsystems only. Hence, at the composition A2BC, the VsAB and VsAC (s = 1� 2) are taking at the composition xA = 3=8 for the alloys A-B and A-C whereas the V1BC is taken at the composition xB = 1=2 for the alloy B-C. 19
Note that the �rst method is more in line with the calculations that can be performed within CALPHAD, as shown by comparing the solid-phase portion of the phase diagrams shown in Figs. 10b (�rst method) and 10c (second method) with the one obtained from ab initio-CALPHAD calculations presented in Fig. 10a. The CVM improvement of the ideal Gibbs energy (or con�gurational entropy) over the Bragg-Williams estimation is still noticeable although the impact of SRO in ternary alloys becomes less pronounced than in the binary case. To conclude this section, we have shown that the information collected from ab initio can be used to study the stability properties of ternary alloys, and make use of powerful commercial software to easily compute their phase diagrams. The comparison between a full ab initio thermodynamic treatment and the ab initio-CALPHAD results indicate that the Bragg-Williams approximation for the con�gurational entropy is better justi�ed for higherorder component alloys than it was for binaries. This later point adds to the assumption that complex multi-component systems can be studied from the knowledge of binaries (and in some instances ternary systems) without having to include additional information than the one gathered for the binary subsystems.
VII. CONCLUSIONS Detailed calculations were carried out on electronic structure and equilibrium properties of Ta-W, Ta-Mo, and Mo-W alloys using the TB-LMTO formulation of the coherent potential approximation. The GPM was used to predict ordering tendencies and related thermodynamic information across the concentration range of these alloys. Temperature e�ects were accounted for within the generalized mean-�eld approach on which the CVM is based. We predict that Ta-W and Ta-Mo alloys should exhibit a tendency towards order with a B2 superstructure in a broad range of alloy composition. This should not come as a surprise since experimentally there were indications that these two alloy systems should not follow an ideal law of mixing. This result is also consistent with the behavior of quantities related to ordering trends in alloys, such as the negative departure from Vegard's law of the 20
equilibrium lattice constant and the negative departure from Raoult's law of the activity of each alloy species, as a function of composition. Although a solid phase part of the phase diagram of Ta-Mo and Ta-W is predicted at low temperature, relatively to the location of the solidus-liquidus line, the second-order nature of the transition from B2 to the disordered state can be used advantageously to identify B2 short-range order. Di�use scattering experiments should provide a quantitative measure of the ordering strength in these alloys, and con�rm or challenge these predictions. In contrast to the two previous alloys, we �nd that Mo-W should behave like an ideal solid solution if one neglects the slight tendency towards phase separation that should occur at extremely low temperatures. In the second part of this study we have shown that the results of ab initio thermodynamics can be cast in a CALPHAD formalism for subsequent prediction of isothermal sections of ternary phase diagrams. Short-range order e�ects that indicate departure from ideal solid solution behavior are accounted for in an approximate way by assessing the ab initio results in the same way experimental phase diagram information are, hence providing a robust and yet simple scheme that is consistent with standard assessment of multi-component alloy phase diagrams. In the case of the Mo-Ta-W phase diagram, ab initio alloy thermodynamics of the binary subsystems has been transcribed in a CALPHAD format to generate isothermal sections of the ternary phase diagram. We have shown that the results compare favorably to those directly obtained by performing CVM calculations for the ternary system. This observation indicates that SRO e�ects become negligible, thus validating a single-site Bragg-Williams statistical treatment of chemical order for higher-order component alloys. The phenomenological thermo-chemical database has been supplemented with ab initio information, and predictions have been made on the existence, at low temperatures, of a B2 ordered phase in a broad range of alloy composition in the ternary Mo-Ta-W system. With the present interface being validated, one can envision that the reverse path from CALPHAD to ab initio may be used as a tool to challenge ab initio predictions on binary systems from experimental information gathered on ternary or higher-order component 21
alloys, a knowledge that was until now ignored.
VIII. ACKNOWLEDGMENTS This work performed under the auspices of the U.S. Department of Energy by the University of California Lawrence Livermore National Laboratory under contract No. W-7405ENG-48. The work of V. D. and J. K. was carried out within the project AV0Z1-010-914 of the Academy of Sciences of the Czech Republic, and supported by the Grant Agency of the Academy of Sciences of the Czech Republic (Project A1010203).
IX. APPENDIX Solution and compound phase parameters for the three binaries of the Mo-Ta-W system (Temperature T in K, and energy in J/mol), as obtained from CALPHAD assessments performed on the thermodynamic results from ab initio. Parameters not indicated here are implicitly set to zero. Notations are explained in the text. Liquid: 1-sublattice model (Mo,Ta,W)1 0 Lliq Ta W
= A0 ; 4� 000
1 Lliq Ta W
= A1
0Lliq Mo Ta
= B0 ; 3� 000
1Lliq Mo Ta
= B1
bcc-A2: 1-sublattice model (Mo,Ta,W)1 0Lbcc A2 Ta W
= A0
1Lbcc A2 Ta W
= A1
0Lbcc A2 Mo Ta
= B0
1Lbcc A2 Mo Ta
= B1
0Lbcc A2 Mo W
= +2� 000
;
;
;
;
;
22
bcc-B2: 2-sublattice model (Mo,Ta,W)0:5(Mo,Ta,W)0:5 (with NI = 0:5 and NII = 0:5) B2 bcc B2 �Gbcc Ta:W = �GW:Ta = C0 ;
;
B2 bcc B2 �Gbcc Mo:Ta = �GTa:Mo = D0 ;
;
0 Lbcc B2 Ta:Ta W
B2 = 0Lbcc Ta W:Ta = C1
0 Lbcc B2 Ta W:W
B2 = 0Lbcc W:Ta W = ;C1
0 Lbcc B2 Mo:Mo Ta
B2 = 0Lbcc Mo Ta:Mo = D1
0 Lbcc B2 Mo Ta:Ta
B2 = 0Lbcc Ta:Mo Ta = ;D1
;
;
;
;
;
;
;
;
with
A0 = ;54� 661 + 7:012 T ; 1:2958 10 3 T 2 ;
A1 = +29� 646 ; 0:467 T B0 = ;76� 019 + 2:721 T ; 0:0426 10 3 T 2 ; 8:23845 10 8 T 3 ;
;
B1 = ;18� 025 ; 4:164 T + 2:1399 10 3 T 2 ; 3:24184 10 8 T 3 ;
C0 = ;3� 788 ; 3:864 T ; 0:6479 10 3 T 2 ;
D0 = ;9� 000 ; 3:085 T ; 0:0213 10 3 T 2 ;
C1 = ;838 + 2:697 T D1 = +1� 778 ; 3:479 T + 1:0700 10 3 T 2 ;
23
;
REFERENCES �1] Binary Alloy Phase Diagrams, T. B. Massalski ed. (ASM International, Materials Park, OH, 1990), vols. 1 to 3. �2] R. Krishnan, S. P. Garg, and N. Krishnamurty, J. Alloy Phase Diag. 2, 205 (1986). �3] R. Predmore and R. J. Arsenault, Script. Metall. 4 213 (1970). �4] G. A. Geach and D. Summers-Smith, J. of the Inst. of Met. 80, 143 (1951-1952). �5] L. I. van Torne and G. Thomas, Acta. Metall. 14, 621 (1966). �6] R. Krishnan, S. P. Garg, and N. Krishnamurthy, J. of Alloy Phase Diag. 3, 1 (1987). �7] S. C. Singhal and W. L. Worrell, Met. Trans. 4, 895 (1973). �8] P. E. A. Turchi, A. Gonis, V. Drchal, and J. Kudrnovsk�y, Phys. Rev. B 64, 085112 (2001). �9] F. Ducastelle and F. Gautier, J. Phys. F: Met. Phys. 6, 2039 (1976). �10] F. Ducastelle, Order and Phase Stability in Alloys, ed. by F. R. de Boer and D. G. Pettifor (North-Holland, Amsterdam, 1991), Cohesion and Structure series, vol. 3. �11] P. E. A. Turchi, in Intermetallic Compounds: Principles and Practice, ed. by J. H. Westbrook and R. L. Fleischer (John Wiley & Sons, Ltd., New York, 1995), vol. 1, Chap. 2, pp. 21-54. �12] I. Turek, V. Drchal, J. Kudrnovsk�y, M. S"ob, and P. Weinberger, Electronic Structure of Disordered Alloys, Surfaces and Interfaces (Kluwer, Boston-London-Dordrecht, 1997). �13] J. S. Faulkner, in Progress in Materials Science, ed. by J. W. Christian, P. Hassen and T. B. Massalski (Pergamon Press, New York, 1982), vol. 27, No. 1 and No. 2# and references cited therein. �14] R. Kikuchi, Phys. Rev. 81, 988 (1951). 24
�15] O. Redlich and A. Kister, Ind. Eng. Chem. 40, 345 (1948). �16] L. Kaufman, P. E. A. Turchi, W. Huang, and Zi-Kui Liu, CALPHAD 25, 419 (2001). �17] L. Kaufman and H. Bernstein, Computer Calculation of Phase Diagrams with Special Reference to Refractory Metals (Academic Press, New York, 1970). �18] CALPHAD and Alloy Thermodynamcis, ed. by P. E. A. Turchi, A. Gonis, and R. D. Shull (TMS, Warrendale, 2002). �19] N. Saunders and A. P. Miodownik, CALPHAD - Calculation of Phase Diagrams: A Comprehensive Guide, Pergamon Materials series ed. by R. W. Cahn, vol. 1 (Elsevier, Oxford, 1998). �20] G. Grimvall, Ber. Bunsenges. Phys. Chem. 102, 1083 (1998). �21] D. M. Ceperley and B. J. Alder, Phys. Rev. Lett. 45, 566 (1980). �22] J. P. Perdew and A. Zunger, Phys. Rev. B 23, 5048 (1981). �23] H. L. Skriver, The LMTO Method, Springer series in Solid-State Sciences, vol. 41 (Springer-Verlag, Heidelberg, 1983)# O. K. Andersen, O. Jepsen, and D. Gl$otzel, in Highlights of Condensed Matter Theory, ed. by F. Bassani, F. Fumi, and M. P. Tosi (North-Holland, Amsterdam, 1985), p. 59. �24] U. von Barth and L. Hedin, J. Phys. C: Condensed Matter 5, 1629 (1972). �25] C. Colinet, A. Bessoud, and A. Pasturel, J. Phys. F: Met. Phys. 18, 903 (1988). �26] D. G. Pettifor, in Physical Metallurgy, ed. by R. W. Cahn and P. Hassen (North-Holland, Amsterdam, 1983), chapt. 3. �27] R. Hawkins, M. O. Robbins, and J. M. Sanchez, Phys. Rev. B bf 33, 4782 (1986). �28] A. Finel and F. Ducastelle, in Phase Transformations in Solids, ed. by T. Tsakalakos (North-Holland, Amsterdam, 1984), p. 293. 25
�29] A. Finel, D. Gratias, and R. Portier, in L'Ordre et le D�esordre dans les Mat�eriaux (Les Editions de Physique, Les Ulis, 1984), p. 9. �30] A. Finel, Th%ese de Doctorat d'Etat es Sciences Physiques, University Paris VI, France, unpublished (1987)# and Technical Report ONERA 1987-3. �31] S. M. Allen and J. W. Cahn, Acta Metall. 20, 423 (1972). �32] G. Kresse and J. Furthm$uller, Comput. Mater. Sci, 6, 15 (1996). �33] V. Blum and A. Zunger, Phys. Rev. B 69,020103 (2004). �34] C. Sigli, M. Kosugi, and J. M. Sanchez, Phys. Rev. Lett. 57, 253 (1986). �35] N. S. Golosov and A. M. Tolstik, J. Phys. Chem. Sol. 36, 899, 903 (1975). �36] V. L. Moruzzi, J. F. Janak, and K. Schwarz, Phys. Rev. 37, 790 (1988). �37] C. Bichara and G. Inden, in Statics and Dynamics of Alloy Phase Transformations, NATO-ASI Series, series B: Physics, vol. 319, ed. by P. E. A. Turchi and A. Gonis (Plenum Press, New York, 1994), p. 541. �38] L. Kaufman and H. Bernstein, Computer Calculation of Phase Diagrams with Special Reference to Refractory Metals (Academic Press, New York, 1970). �39] MRS Bulletin, Vol. 24, No. 4, pp 18-49 (April 1999). �40] CALPHAD and Alloy Thermodynamics, ed. by P. E. A. Turchi, A. Gonis, and R. D. Shull (TMS Publication, Warrendale, PA, 2002)# and references therein. �41] I. Ansara and B. Sundman, The Scienti�c Group Thermodata Europe, P. S. Glaeser ed., Computer Handling and Dissemination of Data (Elsevier Science Pub. Co., 1987). �42] A. Dinsdale, CALPHAD 15, 317 (1991). �43] Y. M. Muggianu, M. Gambino, and J. P. Bros, J. Chem. Phys. 22, 83 (1975). 26
�44] O. Redlich and A. Kister, Ind. Eng. Chem. 40, 345 (1948). �45] B. Sundman and J. Agren, J. Phys. Chem. Sol. 42, 297 (1981). �46] J. O. Andersson, A. F. Guillermet, M. Hillert, B. Jansson, and B. Sundman, Act. Metall. 34, 1986 (1986). �47] I. Ansara, N. Dupin, and B. Sundman, CALPHAD 21, 535 (1997). �48] B. Jansson, Trita-Mac-0234, Royal Institute of Technology, Stockholm, Sweden (1984). �49] B. Sundman, B. Jansson, and J.-O. Andersson, CALPHAD 9, 153 (1985). �50] The results of the �tting procedure for Ta-W that are reported in the appendix have been corrected for a few typographical errors that appear in Ref. �16]. �51] H. Ackermann, G. Inden, and R. Kikuchi, Acta Metall. Mater. 37, 1 (1989). �52] G. Rubin and A. Finel, J. Phys.: Condens. Matter 7, 3139 (1995). �53] V. Chaumat, C. Colinet, and F. Moret, J. of Phase Equil. 20, 389 (1999). �54] C. Colinet, Ref. �40], pp. 21-52# and references therein. �55] J. W. D. Connolly and A. R. Williams, Phys. Rev. B 27, 5169 (1983).
27
TABLES TABLE I. Equilibrium properties, i.e., lattice constant (in � A), bulk modulus (in GPa), and when applicable formation energy of the ordered B2 phase (in kJ/mol), of bcc-based pure Ta, Mo, and W, and of the B2 ordered phase of TaW and TaMo. Methods 1 and 2 correspond to LMTO-ASA, and TB-LMTO-ASA in the case of the pure species or TB-LMTO-CPA-GPM in the case of the ordered B2 phase of TaW and TaMo, respectively. Property
Method
Pure Ta Pure Mo Pure W Ordered B2 TaW Ordered B2 TaMo
Lattice Constant Experiment 3.3031 (in � A) Method 1 3.3098
3.1472
3.1652
-
-
3.1781
3.1934
3.2421
-
3.2766
3.1738
3.1802
3.2203
3.2139
Bulk Modulus Experiment 196.1
262.6
310.4
-
-
Method 2 (in GPa)
Method 1
206.4
273.1
314.0
255.8
-
Method 2
215.3
291.9
337.3
276.8
226.7
B2 �Eform
Method 1
-
-
-
-10.5
-
(in kJ/mol)
Method 2
-
-
-
-17.0
-26.5
28
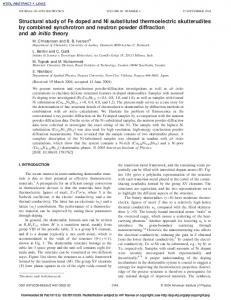
FIGURES FIG. 1. Density of states of bcc-based pure Ta, Mo, and W (left panels), and of Ta50W50, Ta50Mo50, and Mo50W50 disordered alloys (right panels) as a function of energy), as obtained from TB-LMTO-CPA. The Fermi energy EF is indicated by a vertical line and taken as zero of energy. In the alloy case, the solid line indicates the total density of states, whereas the dotted and dashed line refer to the partial densities of states of Ta (Ta, Mo) and W (Mo, W). FIG. 2. Variation of the bcc lattice constant aeq (in � A) of the chemically random alloys Ta-W (solid circle), Ta-Mo (open circle), and Mo-W (square) (top), and of the departure from Vegard's �) (bottom) with alloy composition. The dashed line corresponds to the theoretical law, aeq (in A results and the solid line to the experimental data from Ref. �6] and �2] for Ta-W and Ta-Mo, respectively. FIG. 3. Variation of the bulk modulus (in GPa) of the bcc-based chemically random Ta-W (solid circle), Ta-Mo (open circle), and Mo-W (square) alloys with composition. The solid circles indicate the experimental value of the endpoints. FIG. 4. Variation of the mixing energy �Emix (in kJ/mol) of the bcc-based chemically random Ta-W (solid circle), Ta-Mo (open circle), and Mo-W (square) alloys with composition. FIG. 5. First (solid line) and second (dashed line) e ective pair interactions (EPIs) V1 and V2 (in kJ/mol) as functions of composition for bcc-based Ta-W (solid circle), Ta-Mo (open circle), and Mo-W (square) alloys, as obtained from TB-LMTO-CPA-GPM. FIG. 6. Predicted bcc-based Ta-W (a) and Ta-Mo (b) phase diagrams, as obtained from the tetrahedron approximation of the CVM (open circles) and from the CALPHAD data summarized in the appendix (solid lines). The CVM results based on the Hamiltonian described in section VI are represented by a dashed line.
29
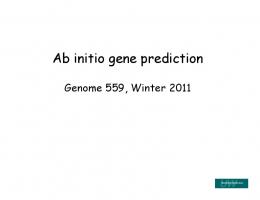
FIG. 7. Molar Gibbs energy (a) and molar enthalpy (b) (in kJ/mol) of Mo-Ta alloy as functions of Ta composition and at various temperatures. The points are derived from the ab initio method (see text) whereas the curves are obtained from the ab initio-CALPHAD approach. FIG. 8. Enthalpy of mixing (in kJ/mol) and order parameter of Mo50Ta50 alloy as functions of temperature (in K) obtained from CVM (solid lines) and ab initio-CALPHAD modeling (dotted lines). FIG. 9. Isothermal sections of the phase diagram of Mo-Ta-W as obtained from CALPHAD (left panels) and from ab initio-CALPHAD (right panels) calculations performed at 3000, 3200, and 3400 K (from top to bottom). FIG. 10. Solid-state portion of the Phase diagram of Mo-Ta-W obtained from ab initio-CALPHAD (a), and from ab initio-CVM with method 1 (b) and method 2 ( c)� see text
for details.
30
FIG. 1. Turchi et al.
31
FIG. 2. Turchi et al.
32
FIG. 3. Turchi et al.
33
FIG. 4. Turchi et al.
34
FIG. 5. Turchi et al.
35
3300
3800
(a)
≈
bcc-A2
Temperature (K)
Temperature (K)
≈
2900
3400
≈ 1000 800 600
(b)
Liquid
Liquid
3600
≈
bcc-A2
1800
1400
bcc-B2
1000
bcc-B2 600
400 200 0.0
Ta
0.2
0.4
0.6
Mole Fraction of W
0.8
1.0
200 0.0
W
Ta
FIG. 6. Turchi et al.
36
0.2
0.4
0.6
Mole Fraction of Mo
0.8
1.0
Mo
0
0
(b)
(a) -5
Molar Enthalpy (kJ/mol)
Molar Gibbs Energy (kJ/mol)
-5 -10
-15
-20
-25
-30
-35
-40 0.0
Mo
3000 K
0.2
0.4
0.6
Mole Fraction of Ta
3000 3000KK 2500 2500KK 2000 2000KK 1750 1750KK 1500 1500KK 0.8
-1 0
-1 5
-2 0
1.0
-2 5 0.0
Ta
Mo
FIG. 7. Turchi et al.
37
1500 K
0.2
0.4
0.6
Mole Fraction of Ta
3000 3000 K 2000 2000 K 1500 1500 K
0.8
1.0
Ta
FIG. 8. Turchi et al.
38
W
W 1.0
1.0
0.8
W Mo
W of
bcc-A2 solid solution
Fra c le
bcc-A2 solid solution
Mo
le
Fra
cti
0.6
0.4
0.6
tio n
on
of
0.8
0.4
0.2
0.2
Liquid
Liquid
3000 K
3000 K 0.0
Mo 0.0
0.4
0.2
0.6
1.0 Ta
0.8
Mo 0.0
0.2
Mole Fraction of Ta
0.4
0.6
1.0 Ta
0.8
W of
fW
on
no
cti
bcc-A2 solid solution
0.6
bcc-A2 solid solution
le
Fra
tio
0.6
Fra c 0.4
Mo
le
0.8
1.0
0.8
Mo
1.0 Ta
W
W 1.0
0.4
0.2
0.2
Liquid
Liquid 3200 K
3200 K 0.0 1.0 Ta Mo 0.0
0.0
Mo 0.0
0.4
0.2
0.6
0.8
0.4
0.2
0.6
Mole Fraction of Ta
Mole Fraction of Ta
W
W 1.0
1.0
bcc-A2 solid solution
fW no tio Fra c
on cti
0.6
0.6
Mo
le
Fra Mo le
bcc-A2 solid solution
0.8
of
W
0.8
0.4
0.4
Liquid
Liquid 0.2
0.2
3400 K
3400 K 0.0
0.0
Mo 0.0
0.8
Mole Fraction of Ta
0.2
0.4
0.6
0.8
1.0 Ta
Mo 0.0
0.2
0.4
0.6
Mole Fraction of Ta
Mole Fraction of Ta
FIG. 9. Turchi et al.
39
0.8
1.0 Ta
W
W
1.0
1.0
(a)
fW no le F
rac tio
1050 1200
Mo
1500 1600
0.4
bcc-A2 solid solution
0.8
800
0.6
le F
rac tio
no
fW
0.8
Mo
(b)
bcc-A2 solid solution
800
0.6 1050 1200
0.4
1700
0.2
1500
0.2
bcc-B2 0.0 Mo 0.0
bcc-B2 0.0
0.2
0.4
0.6
0.8
1.0 Ta
Mole Fraction of Ta
Mo 0.0
W 1.0
(c) bcc-A2 solid solution 800
0.6
Mo
le
Fra
ctio
no
fW
0.8
1050
0.4 1200
0.2 1500
bcc-B2
0.0
Mo 0.0
0.2
0.4
0.6
0.8
1.0 Ta
Mole Fraction of Ta
FIG. 10. Turchi et al.
40
0.2
0.4
0.6
Mole Fraction of Ta
0.8
1.0 Ta