An artificial neural network is a non-parametric attempt to model the .... In this research, MLP with back propagation learning rule was used. The MLP network.
10 Application of Artificial Neural Network (ANN) to Predict Soil Organic Matter Using Remote Sensing Data in Two Ecosystems Shamsollah Ayoubi1, Ahmahdreza Pilehvar Shahri1, Parisa Mokhtari Karchegani2 and Kanwar L. Sahrawat3 1Department
of Soil Science, College of Agriculture, Isfahan University of Technology, Isfahan, 2Department of Soil Science, College of Agriculture, Islamic Azad University, Khorasgan Branch, Isfahan 3International Crops Research Institute for the Semi Arid Tropics (ICRISAT), Patancheru, Andhra Pradesh 1,2Iran 3India
1. Introduction 1.1 Importance of soil organic matter prediction Concern over global problems induced by rising CO2 has prompted attention on the role of forests and pastures as carbon ‘storage’ because forests and pastures store a large amount of carbon in vegetation biomass and soil. Soil organic matter (SOM) plays a critical role in soil quality and has the potential to cost-effectively mitigate the detrimental effects of rising atmospheric CO2 and other greenhouse gas emissions that cause global warming and climate change(Causarano-Medina, 2006). SOM, an important source of plant nutrients is itself influenced by land use, soil type, parent material, time, climate and vegetation (Loveland &Webb, 2003). Important climatic factors influencing SOM include rainfall and temperature. Within the same isotherm, the SOM content increases with increase in rainfall regime. For the same isohyet, the SOM content increases with decrease in average annual temperature. Within the same landscape unit, the SOM pool rises with increase in clay content and available water-holding capacity in the root zone (Lal, 2001). SOM is also one of the important factors affecting soil quality, sustainability of agriculture, soil aggregate stability and crop yield (Loveland &Webb, 2003). Dynamic soil properties such as organic carbon as well as static soil properties need to be monitored and managed (Sullivan et al., 2005). The application of quantitative soil– landscape modeling (McKenzie et al., 2000), precision agriculture (Thomasson et al., 2001), and global soil carbon monitoring (Post et al., 2001) necessitate more affordable (Lu et al., 1997), accurate (Blackmer &White, 1998), and simple methods to estimate SOM concentration. Study in environmental monitoring, modeling need good quality soil data generated in a cost-effective manner to develop, rapid and cost-effective methods of soil C
182
Biomass and Remote Sensing of Biomass
analysis. There is need to develop methods that use the minimum number of soil analysis to reduce and minimize cost for preparing SOM maps to support precision agriculture (Wetterlind et al., 2008), quantitative soil-landscape modeling (McKenzie et al., 2000) and global soil C monitoring (Post et al., 2001). 1.2 SOM and remote sensing High resolution secondary information such as RS could be used to provide greater details as an alternative to less extensive soil measurements like SOM (Causarano-Medina, 2006). It is hypothesized that RS imagery may play a role in aiding the detection of SOM variability in natural landscapes through the relationship between SOM and forage growth conditions, since the latter has been shown to be highly correlated with RS data Recent research has suggested that spectral bands are correlated with soil properties and could minimize the cost of prediction of soil physical, chemical and biological characteristics (e.g. Roy et al., 2006). SOM plays a critical role in influencing chemical and physical processes in the soil environment; and SOM also affects the shape and nature of a soil reflectance spectrum. Generally, soils with higher in organic matter appear darker. It is proposed that correlation among reflectance in spectral bands and soil properties could provide cost effective prediction of SOM (Ladoni et al., 2010). The wide spectral range proposed by different workers to estimate SOM content suggests that SOM is an important soil component across the entire spectrum. Soil minerals, organic matter, and moisture are the major components of soils, with distinct spectral features in the visible and near-infrared regions (Henderson et al., 1992). The essential characteristics related to various constituents of SOM generally occur in the mid to thermal-infrared range (2500–25, 000nm), but their feeble overtones and combinations of these essential vibrations due to the curving of NH, OH and CH groups dominate the NIR (700–2500 nm) and the VIS (400–700 nm) portions of the electromagnetic spectrum(Shepherd &Walsh, 2002). In the VIS range, important bands for the prediction of SOM are around 410, 570, 660and 520, 540 and 550 nm(Brown et al., 2006). Organic matter decreases the reflectance in the range 550–700 nm(Galvao &Vitorello, 1998) or it results in a concave curve for larger OM contents and a convex one for smaller amounts of OM in the 500–1300 nm range (Huete &Escadafal, 1991). Henderson et al. (1992) found that reflectance of organic matter extracted from four Indiana agricultural soils strongly correlated with organic C content and significantly responded to the concentrations of Fe and Mn oxides in the visible range for soils developed from the same parent material. A portable near-infrared spectrophotometer designed by Sudduth and Hummel (1993) was used to predict soil organic matter (R2= 0.85), moisture (R2=0.94), and CEC (R2= 0.85) in soils from Illinois (Sudduth &Hummel, 1993); and it concluded that the prediction of these soil properties became less accurate as the geographic range of samples increased . Recently, NIR technique was developed for in-field analysis of soil properties (Christy et al., 2003). Near-infrared spectra are produced by weak overtones and combinations of fundamental vibrational bands for H–C, H–N, and H–O bonds from the near- and midinfrared region (Christy et al., 2003; Sorenson &Dalsgaard, 2005). Since organic matter in the soil mainly consists of C, H, O and N elements, the NIR measurements are greatly affected (Sorenson &Dalsgaard, 2005). Christy et al. (2003) showed that NIR spectra were related to soil carbon in agricultural fields of central Iowa and Kansas. Suchenwirth et al. (2010) modeled the distribution of organic carbon stocks in floodplain soils with remote sensing data and additional geoinformation.
Application of Artificial Neural Network (ANN) to Predict Soil Organic Matter Using Remote Sensing Data in Two Ecosystems
183
Chen et al. (2005) examined the relationship between SOM content in the upper 15 cm of the soil profile and selected parts of the spectrum from the image by two different methods. In the first method, an equation was used to calculate the surface SOM concentrations for each pixel with the resulting values grouped into one of eight classes. In the second method, the image was classified into 20 groups and the above equation was applied to the classified result. Finally, the original 20 groups were sub-grouped further into eight classes. There was good agreement between the measured and the predicted values for both the methods in all of the images (Chen et al., 2005). 1.3 Artificial neural network modeling ANNs provide a method to characterize synthetic neurons to solve complex problems in the same manner as the human brain does. For many years, especially since the middle of the last century, an interest in studying the brain’s mechanism and structure has been increasing. This growing research interest has led to the development of new computational models, connectionist systems or ANNs, based on the biological background, for solving complex problems like pattern recognition, and fast information processing and adaptation (Huang, 2009). Neural networks use machine learning based on the concept of self-adjustment of internal control parameters. An artificial neural network is a non-parametric attempt to model the human brain. Artificial neural networks are pliable mathematical structures that are capable of identifying complex non-linear relationships among input and output data sets. The principal differences between the various types of ANNs are arrangement of neurons and the many ways to assess the weights and functions for inputs and neurons (training). Application of statistical methods, in SOM estimation, has been limited, because of oversimplification, illiteracy of complex nonlinear interactions. Another approach in dealing with nonlinear systems is to use non-linear methods such as ANN. ANN has been successfully used in the classification and prediction (Zhang &McGrath., 2004). The potential benefits of this method include greater prediction credibility, cost-effective estimation and solving complex problems involving nonlinearity and uncertainty. There are a variety of ANN architectures, such as multi-layer perceptron. The multilayer perceptron (MLP) neural network has been designed to function well for non-linear phenomena. A feed forward MLP network consists of a layer of input neurons and output layer with selected number of input and output neurons, respectively with one or more hidden layers in between the input and the output layer with some number of neurons on each (Melesse, 2005). 1.4 Objective No investigation has been made in the semiarid regions to use non-linear and intelligent models to predict surface SOM using imagery data. Therefore, the objectives of this study were to (i) predict SOM in the hilly regions using an ANN and multiple linear regression (MLR) modeling, (ii) compare the efficacy of two models to predict SOM using remotely sensed data, and (iii) identify the most important bands and ratios for explaining the variability of SOM based upon the ANN modeling using sensitivity analysis at two selected sites under rangeland and forested land in central and western Iran, respectively.
184
Biomass and Remote Sensing of Biomass
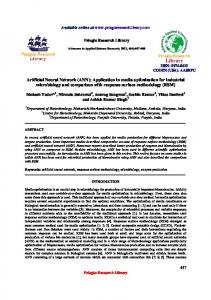
2. Methods and materials 2.1 Description of the studied sites This study was conducted at two sites in the hilly region. One site was under natural rangeland and located in Semirom region, Isfahan province, Central Iran (site1), the second site was under natural forested land located in Lordegan region in the Charmahal and Bakhtirai province, west of Iran (site 2) (Fig.1). General description of the selected sites is presented in Table 1. Soil temperature and moisture regimes of the selected sites were mesic and xeric for site1, and thermic and xeric for site 2, respectively.
Fig. 1. Location of the sites studied in western and central Iran
Site
1 2
Mean Mean Elevation Lateral Soil annual Parent annual slopes classifications (a.s.l) temperature precipitation material (%) (USAD, 2008) (m) (mm) (C) Range Typic Quaternary 51˚˚ 39΄΄ E 31˚ 18΄ N 2500 10.6 350 20-30 land Calcixerepts deposits Typic Quaternary Forest 50˚ 32΄ E 32˚ 03΄ N 1800 15 600 20-40 Calcixerept deposits Land use
Long.
Lat.
Table 1. General description of the two selected sites in central and west of Iran
Application of Artificial Neural Network (ANN) to Predict Soil Organic Matter Using Remote Sensing Data in Two Ecosystems
185
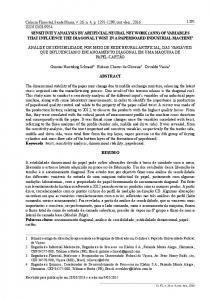
2.2 Soil sampling and laboratory analysis A total of 125 soil samples were collected from the study site1 in October 2008 following grid sampling strategy on a regular 350× 350m grid, and a total of 108 soil samples were collected at site 2 in September 2009 following a randomly stratified sampling scheme (Fig. 2). Prior to analyses for physical and chemical characteristics, the soil samples were air-dried for two weeks and ground to pass through a 2 mm sieve to remove stones, roots and large organic residues. Soil organic carbon was determined using a wet combustion method (Nelson & Sommers, 1982).
Fig. 2. Spatial distribution of the sampling points within the landscapes (a): Hilly range lands in Semiroum region, central Iran, (b): hilly forest Querqus in Lordegan region, western Iran. 2.3 Descriptive statistical analysis Descriptive statistics such as means, minimum, maximum, coefficient of variation (CV) and skewness were determined (Wilson &Gallant, 2000). The coefficient of variation was utilized to explain the variability in soil organic carbon. 2.4 Remote sensing data The remote sensing data used to build the model in this study included the Landsat ETM band 1, 2, 5 and band 7 and combination of bands 3 and 4 for the calculation of NDVI, with spatial resolution of 30 x 30 m. The acquisition date of the image was 22 June 2001. The subset image covering the study area was then geometrically corrected using the landform map of Iran 1:25000 scale as the reference. All image processing was performed using ILLWIS software. The spectral characteristics used in this study consisted of single band data (i.e. the digital number of band 1, 2, 5 and 7) and vegetation index (NDVI). These data were then used as inputs in ANN modeling. The NDVI is known to be closely related to biophysical crop characteristics, such as absorption of photosynthetic active radiation and productivity (Rondeaux, 1996; Pettorelli,
186
Biomass and Remote Sensing of Biomass
2005) and its values range between -1 and +1. High positive values usually reveal the occurrence of dense green vegetation, pointing to an optimum state of water and nutrient supply. Low NDVI values express limited photosynthetic activity and negative ones correspond to sparse ground coverage (Huete, 1994). NDVI was calculated as the reflectance ratio from near-infrared (NIR) and red channel (R) of satellite or airborne sensors as follows:
NDVI
NIR-R NIR+R
(1)
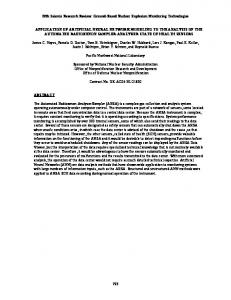
2.5 Artificial neural network development In this research, MLP with back propagation learning rule was used. The MLP network (Fig.3) is the most commonly used network in engineering problems relative to non-linear mapping (Haykin, 1994). Back propagation was developed by Rumelhart et al. (1986) and is one of the widely implemented of all neural network paradigms. It is based on a multilayered feed forward topology with supervised learning. Back propagation uses a type of gradient descent method, following the slope of the error surface downwards toward its minimum (Rumelhart, 1986; Melesse, 2005).
X X
Y=SOM
X X
Input layer
Hidden layer
Output layer
Fig. 3. Multilayer perceptron neural network used for the estimation of SOM The learning process is performed using the well known back propagation (BP) algorithm, which is based on the delta learning rule (Rumelhart, 1986). Two main processes are implemented in a BP algorithm, a forward pass and a backward pass. In the forward pass, an output pattern is presented to the network and its effect propagated through the network, layer by layer. For each neuron, the input value is calculated as follows (Haykin, 1994):
Application of Artificial Neural Network (ANN) to Predict Soil Organic Matter Using Remote Sensing Data in Two Ecosystems m
netin wnji .Onj 1
187
(2)
j 1
where netin is the input value of ith neuron in nth layer; wnji is the connection weight between ith neuron in nth layer and jth neuron in the (n-1)th layer; Onj 1 is the output of jth neuron in the (n-1)th layer; m is the number of neurons in the (n-1)th layer. In each neuron, the value calculated from Eq. (2) is transferred by an activation function. The common function for this purpose is the sigmoid function, and is given by: Sig(net nj ) 1 /(1 Exp( net nj ))
(3)
The output of each neuron computed and propagated through the next layer until the last layer. Then, the final computed output of the network is prepared to compare with the target output. In this regard, an appropriate objective function such as the root mean square error (RMSE) is calculated as follows (Degroot, 1986). np no
(Tpj Opj )2 RMSE
i 1 j 1
np .no
(4)
where Tpj is the jth element of the target output related to the pth pattern; Opj is the computed output of jth neuron related to the pth pattern; np is the number of patterns; no is the number of neurons in the output layer. After calculating the objective function, the second step of the BP algorithm, i.e. the backward process is started by back propagation of the network error to the previous layers. Using the gradient descent technique, the weights are adjusted to reduce the network error by performing the following equation (Rumelhart, 1986): wnji
( m 1)
( E ) wnji wnji
(m)
(5)
where,
wnji
( m 1)
is the weight increment at the (m+1)th iteration (Epoch);
is the learning rate is the momentum term (0 , 1) . This process was continued until the allowable network error was obtained. For designing the artificial neural network, the measured field data were used. The data set was shuffled; 60% of them were used for the learning process, 20% sets were used for testing, and the remaining 20% sets were used for verification, respectively. The data sets for learning, testing, and verification processes were selected randomly at different points on the landscape in the field to avoid bias in estimation. In this study, ANN modeling was
188
Biomass and Remote Sensing of Biomass
performed using MATLAB software package (MATLAB. 2008). The number of neurons in input and output layers depend on the independent and dependent variables, respectively. The network was designed with 5 parameters (i.e. the digital number of band 1, 2, 5 and 7 and NDVI) as input pattern and SOM as the output parameters. The number of hidden layers, number of neurons in the hidden layers, the parameter , and the number of iterations were selected by calibration through several test runs and trial and error (Marquardt Levenberg learning rule). Various activation functions were tested for MLP neural networks and the tansigmoid function presented the best results. 2.6 Sensitivity analysis Sensitivity analysis was performed so that a better understanding of the importance of each input on the output could be examined. Thus, sensitivity analysis was performed to investigate a behavior of input variables. In order to identify the most important band of ETM+ and vegetation index explaining the variability of SOM, sensitivity analysis was done using the StatSoft method(StatSoft, 2004). A sensitivity ratio was calculated by dividing the total network error when the variable was treated as being not variable by the total network error when the actual values of the variable were used. A ratio greater than 1.0 implied that, then, the variable made an important contribution to the variability in soil organic matter. The higher the ratio, the more important the variable (StatSoft, 2004; Miao, 2006). 2.7 Multivariate statistical regression Multivariate statistical regression was selected to model the relationships of selected variables with soil organic matter concentration. Multivariate statistical regression concentrated to find the combination, which is called as the linear discriminate function against the variables and the discriminate score. The linear expression is as follows:
D B0 B1X1 B2 X 2 ... Bn Xn
(6)
where D is a discriminate score B0 is an estimated constant Bn are the estimated coefficients Xn are the variables 2.8 Performance of the methods Two statistical parameters were used for performance analysis: coefficient of determination (R2) and root mean square error (RMSE). RMSE is one the most commonly used statistical parameters, which expresses the mean differences between estimated and observed values (Uno et al, 2005, Douaoui et al. 2006). The data set for comparison of two approaches (MLR and ANN) was selected similarly. In addition, the performance of each model was evaluated by plotting the estimated value against the actual value and by testing the statistical significance of regression parameters
3. Results and discussions 3.1 Descriptive statistics The descriptive statistics and variation in SOM are given in Table 2. The SOM content in site 1 under natural range land varied from 0.33 to 2.2%, whereas in the site 2 under forest it
Application of Artificial Neural Network (ANN) to Predict Soil Organic Matter Using Remote Sensing Data in Two Ecosystems
189
varied from 1.5 to 5.4 %. It is obvious that significant increase in SOM is attributed to greater precipitation and higher biomass production in site 2 under forest than in site1. The remote sensing data and SOM, were normally distributed as confirmed by the KolmogorovSmirnov (K-S)) test and the values on skewness. SOM had moderate variability (CV=34% for site1 and CV=32% for site2) for the two sites studied. It seems that this variability in SOM depends on the landscape position, causing differential accumulation of water at different positions of landscape (over the landscape), resulting in variability in SOM content. Variable SOM(Site 1) SOM(Site 2)
Unit % %
No 125 108
Min 0.33 1.50
Max 2.20 5.40
Mean 0.81 2.33
CV% 34 32
Skewness 0.29 -0.54
Range 1.87 3.90
Min: Minimum; Max: maximum; CV: Coefficient of variation; SOM: soil organic matter
Table 2. Descriptive statistics of SOM variability in the two sites studied The correlation coefficients among variables (Table 3) showed that the correlation coefficients between SOM with band 1, 2, 5 and 7 were negative, and correlation between SOM and NDVI was significantly positive, (α = 0.010). Site 1 2
Variable SOM SOM
**Significant at99% probability
Band1 -0.47** -0.23*
Band2 -0.48** -0.20*
Band5 -0.28* -0.21*
Band7 -0.44** -0.32**
NDVI 0.45** 0.78**
*Significant at 95% probability
Table 3. Pearson correlation coefficients of SOM with remote sensing data variables at the two sites studied, in Iran The soil generally has reflectance spectra in the 1100–2500 nm range, containing three distinct absorption peaks around 1400, 1900 and 2200 nm with a few small absorption peaks between 2200 and 2500 nm (Chang &Laird, 2002). Chen et al. (2000) related surface organic matter content to image intensities in the red, green, and blue bands of the visible spectrum and discovered a good agreement between the measured and the predicted values with R2 varying from 0.97 to 0.98 (Chen, 2000). 3.2 Multiple linear regression analysis The results of the multivariate linear regression are presented in Table 4. In these data, SOM denotes the soil organic matter concentration and Band 1 and 2 present digital numbers of ETM, NDVI present the normalized difference vegetation index. The results revealed a moderate relationship between the measured SOM contents and the predicted ones with the R2 of 0.54, implying that we can predict the soil organic matter concentration at 54% confidence with ±26% error (e.g. soil organic matter of 0.5 would be predicted to vary from 0.37 to 0.63). The results showed that the MLR models explained 54 % of the total variability in SOM at the rangeland site. On the other hand, MLR model could explain 77% of variability in SOM at the forested site. This means that SOM content can be explained through independent variables band 1, 2 and NDVI by 54 and 77 percent for rangeland and forested sites respectively, whereas 46 and 23% left might be explained by other variables not used in the model, and the results also indicated the existence of nonlinear interactions between variables.
190
Site 1 2
Biomass and Remote Sensing of Biomass
Regression model SOM(%)=2.433-0.011(Band2)+3.872(NDVI) SOM(%)= 1.3766+4.78(NDVI) -0.012(Band1)
R2 0.54 0.77
MAE 0.18 0.09
RMSE 0.26 0.13
SOM: Soil organic matter; . MAE: Mean absolute error, RMSE: Root mean square error. NDVI: Normalized difference vegetation index.
Table 4. Stepwise linear regression parameters used to estimate SOM at the two selected sites in Iran. When five independent variables were used in stepwise regression analysis, the output showed that the frequency of band2 and NDVI for site 1 and NDVI and band1 for site 2. Band 2 and 1 have negative relationship and NDVI has positive relationship with soil organic matter content as shown by the regression model. In these formulations, the SOM content increases with decrease in band2 and band 1 and SOM pool rises with increase in NDVI. Multivariate statistics has widely been used to exploit the relationships between spectral characteristics and SOM content. For exmaple, Mc Carty and Reeves (2006) predicted SOM using multivariate analysis and spectral response in the near infrared (NIR) regions of the electromagnetic spectrum 3.3 ANN's structure optimization The data on best structure having optimum parameters (Table 5) of the final selected ANN model could be used to predict the SOM. Finding the optimum number of hidden neurons in the hidden layer is an important step in developing MLP networks. The hidden-layer nodes were determined to be 10 for the two sites studied . Also, the optimum iteration learning rates were determined as 10000 and 12000 for SOM in rangeland and forested land, respectively.
Sites 1 2
ANN structure Transfer function 5-10-1 Tangsigm 5-10-1 Tangsigm
Iteration 10000 12000
Number of hidden layers 1 1
Number of hidden neurons 10 10
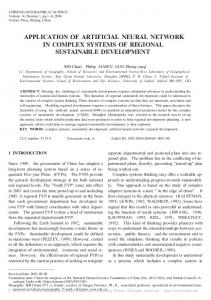
Table 5. Optimum parameters of ANN model for predicting soil organic matter using ETM data at sites 1 and 2 in Iran 3.4 Comparison of MLR and ANN models to estimate SOM in two ecosystems The relationship between measured and predicted values of SOM using MLR model are shown in Fig. 4a and 4b for rangeland and frosted area, respectively. As shown, MLR in forested land explained greater variability of SOM than in the rangeland. It seems that NDVI index as a indicator of vegetation cover plays a greater role in explaining the variability in SOM in the hilly region than in the rangeland area with lower variation in NDVI .Normalized predicted data versus normalized observed data for testing data set are shown in Fig 4c and 4d for rangeland and forested area, respectively; and the coefficients of determination (R2) were determined. Moreover the MAE and RMSE values were calculated to be 0.18 and 0.26 for MLR model for SOM in rangeland and 0.09 and 0.13 for forested area using MLR. On the other hand, ANN
Application of Artificial Neural Network (ANN) to Predict Soil Organic Matter Using Remote Sensing Data in Two Ecosystems
191
model improved the MAE and RMSE, which were 0.09 and 0.12 for rangeland and 0.01 and 0.09 for forested land, respectively. Overall, the ANN models explained greater variability and had higher capacity to predict SOM because these models use the non-linear relationships among inputs and output variables. The developed ANN model for predicting the soil organic matter in the present study explained 84% and 91% of the total SOM variability in the rangeland and forest landscapes receptively. Overall, the results implied that the ANN modeling was successful in identifying most of the remote sensing data, which influence soil organic matter. However, our results also suggest that this methodology used for analyzing the data has wider applicability and can be applied to other sites.
Fig. 4. Scatter plot displaying the relationships between measured and estimated value of the SOM in MLR and ANN models at the two sites studied in west and central Iran. (a): MLR for rangeland (b): MLR for forested land (c): ANN for rangeland, (d):ANN for forested land. 3.5 Determining the most important bands for explaining variability in SOM The results on the relative importance of digital numbers and vegetation index using sensitivity analysis based upon coefficients of sensitivity of the ANN model for soil organic matter are shown in Fig. 5. The variables with high values made contributions to explain the variability in SOM. Band 1 of ETM was identified as the most important band for detecting SOM variability in the study area of rangeland (Fig. 5a). Other important factors for predicting SOM, included
192
Biomass and Remote Sensing of Biomass
band 2 and 5 with relative coefficients of sensitivity ranking as 1.21 and 1.06, respectively. Two other selected variables included band 7, and the NDVI showed sensitivity coefficient of less than 1, implying that they make lower contribution in predicting SOM in the rangeland site. In the ANN analysis for SOM variability in forested land, the NDVI was identified as the most important and other digital numbers were also identified. NDVI, a widely used indicator in remote sensing showing abundance of vegetation cover. Spatial distribution of the NDVI was strongly influenced by the relief, which controls the movement of water and nutrients along the hillslopes. The distribution of vegetation could be controlled the variability in SOM within the landscape, and the reflectance of soil surface in red and infrared spectrums can determine the presence of different amounts of SOM. (Liu et al., 2004). The NDVI indicates the greenness cover on the land surface and shows a well documented relationship with crop and vegetation productivity (Pettorelli, 2005). LozanoGarcia et al. (1991) reported on the correlations between NDVI and soil properties. Li et al. (2001) found that the NDVI between red and infrared wavelengths was cross-correlated with soil water content, sand, clay and elevation. However, a composed and complex index such as NDVI, which mostly reflects biomass status, indicates soil-dependent site quality (Sommer, 2003).
Fig. 5. Histogram displaying the results on sensitivity analysis, relative sensitivity coefficients of remote sensing data for the SOM. NDVI: normalized difference vegetation index.(a): Rangeland of Semiroum; (b): Forested land of Lordegan Independent variable Landsat ETM digital numbers of bands 1, 2, 5 and 7, which may have been influenced by the presence of vegetative cover, were identified as important factors for the variability in SOM. Band 1 is useful for soil/vegetation differentiation and in distinguishing the forest types. Band 2 detects green reflectance from healthy vegetation. The two mid-IR red bands on TM ( bands 5 and 7) are useful for vegetation and soil moisture studies (Lillesand &Kieffer, 1987). Moreover, SOM has been related to reflectance in data collected over agricultural fields in several studies (Coleman et al., 1991; Henderson, 1992; Chen, 2000) and it has been reported that visible wave-lengths (0.425 to 0.695 mm) (Bands 1 to 3) had a strong correlation with SOM for soils with the same parent material. The use of middle infrared bands (Band 5 of ETM) improved the prediction of SOM content when the soils were from different parent materials (Henderson, 1992). Chen et al. (2000) were able to accurately predict SOM using true color imagery of a 115-ha field with the use of locally developed regression relationships.
Application of Artificial Neural Network (ANN) to Predict Soil Organic Matter Using Remote Sensing Data in Two Ecosystems
193
Organic matter influences soil optical properties. Organic matter may indirectly affect the spectral influence, based on the soil structure and water retention capacity. High organic matter in soil may produce spectral interferences for band characteristics of mineral like manganese oxide and iron oxide (Coleman et al., 1991). The relationships of surface SOM concentration with the pixel intensity values, with data ranging from 0 to 255 for each band, were not linear (Chen, 2000). Therefore, non-linear regression analyses were developed. Stamatiadis et al. (2005) observed that the red and NIR regions are more sensitive to matterates in soils. The results of this study also showed that in samples that contain high amounts of matterates, the visible bands showed higher correlation (Stamatiadis et al., 2005). These results are similar to those reported by Fox and Sabbagh (2002) who found the strongest correlation of SOM with reflectance in red band, but their results did not confirm the result reported by Sullivan et al. (2005) and Agbu et al. (1990), who showed that reflectance in green band was more strongly correlated with SOM than the reflectance in red band. Krishnan et al. (1980), reported that no absorption climax was caused by organic matter in the NIR region (800–2400 nm), and SOM content was better measured with visible bands than NIR bands. Overall, organic matter is the factor that influences soil optical properties. Organic matter may indirectly affect the spectral influence, based on the soil structure and water retention capacity. High organic matter in soil may produce spectral interferences for band characteristics of minerals such as manganese and iron oxides. The developed ANN models for predicting the SOM in the present study by ETM-Landsat explained 84% and 91% of the total SOM variability within the two selected landscapes. A part of the unexplained variability is probably due to the management practices such as grazing and deforestation in some parts that influenced the plant density over the landscape. Moreover, as reported by other researchers (Kaul et al., 2005), it is important to compare the results of the ANN models with those obtained by other statistical approaches for determining the precision of the model under development. Hence the learning rate, number of hidden layer, number of hidden nodes and the training tolerance need to be determined accurately for developing models for SOM prediction. However, the performance of the ANN models as compared to other approaches suggest that ANN models have better realistic chance to predict SOM, especially when complex non-linear relationships exist among factors. In such cases, the correlation study may provide inaccurate and even misleading results about the relationships (Liu et al., 2001).
4. Conclusions In this study, the potential of remote sensing data for the estimation of within-field variability of SOM was explored for hillslopes in the semiarid region under rangeland and forested uses. Multivariate statistical techniques and ANNs were employed for model development to explore the potential of remote sensing data. To achieve a nonlinear function relating soil organic matter to remote sensing data in hilly region of the semiarid region of central and western Iran, the results of this study indicated that the designed ANN models was able to establish the relationship between the remote sensing data and SOM content. Some of remote sensing data such as band 1, band 2 and NDVI were identified as the important factors that explained the variability in SOM content at the sites studied both in in rangeland and forested areas. The results showed that the MLR and ANN models explained 54 and 84 % of the total variability in SOM, respectively, in the rangeland site.
194
Biomass and Remote Sensing of Biomass
On the other hand, the MLR and ANN models explained 77 and 91% of the total variability of SOM in forested area using remotely sensed data. The calculated MAE and RMSE values were 0.18 and 0.26 for the MLR model for SOM in rangeland and 0.09 and 0.13 for the forested area using MLR. On the other hand, ANN improved the MAE and RMSE to 0.09 and 0.12 for rangeland and 0.01 and 0.09 for forested land, respectively. Therefore, the ANN model could provide superior predictive performance when compared with the MLR model developed. Our results also suggest that the future research should consider soil properties which are used as factors in the equation, because soil reflectance properties depend on numerous soil characteristics such as mineral composition, texture, structure and moisture content in the use of remote sensing imagery to achieve a high accuracy in research.
5. References Agbu, P. A.; Fehrenbacher, D. J. & Jansen, I. I. (1990). Soil property relationships with SPOT satellite digital data in East Central Illinois. Soil Science Society of America Journal, 54, 807-812. Blackmer, A. M. & White, S. E. (1998). Using precision farming technologies to improve management of soil and fertilizer nitrogen. Australian Journal of Agricultural Research, 49, 555–564. Brown, D. J.; Shepherd, K. D.; Walsh, M. G.; Dewayne Mays, M. & Reinsch, T. G. (2006). Global soil characterization with VNIR diffuse reflectance spectroscopy. Geoderma, 132, 273–290. Caudill, H. J. (2006). Management and landscape influences on soil organic carbon in the southern piedmont and coastal plain. the Graduate Faculty of Auburn University, 152. Chang, C. W. & Laird, D. A. (2002). Near-infrared reflectance spectroscopic analysis of soil C and N. Soil Science, 167, 110-116. Chen, F.; Kissel, D. E.; West, L. T. & Adkins, W. (2000). Field-scale mapping of surface soil organic carbon using remotely sensed imagery. Soil Science Society of America Journal, 64, 746–753. Chen, F.; Kissel, D. E.; West, L. T.; Rickman, D.; Luvall, J. C. & Adkins, W. (2005). Mapping surface soil organic carbon for crop fields with remote sensing. Journal of soil and water Conservation, 60, 51-57. Christy, C. D.; Drummond, P. & Laird, D. A. (2003). An on-the-go spectral reflectance sensor for soil. American Society of Agricultural Engineers Meeting, 3, 10-44. Coleman, T. L.; Agbu, P. A.; Montgomery, O. L.; Gao, T. & Prasad, S. (1991). Spectral band selection for quantifying selected proper-ties in highly weathered soils. Soil Science, 151 (5), 355-361. Fox, G. A. & Sabbagh, G. J. (2002). Estimation of soil organic matter from red and nearinfrared remotely sensed data using a soil line Euclidean distance technique. Soil Science Society of America Journal, 66, 1922-1929. Galvao, L. S. & Vitorello, I. (1998). Role of organic matter in obliterating the effects of iron on spectral reflectance and colour of Brazilian tropical soils. International Journal of Remote Sensing, 19, 1969-1979. Haykin, S. (1994). Neural Networks: A Comprehensive Foundation. Macmillan, New York, NY.
Application of Artificial Neural Network (ANN) to Predict Soil Organic Matter Using Remote Sensing Data in Two Ecosystems
195
Henderson, T. L.; Baumgardner, M. F.; Franzmeier, D. P.; Stott, D. E. & Coster, D. C. (1992). High dimensional reflectance analysis of soil organic matter. Soil Science Society of America Journal, 56, 865–872. Huang, Y. (2009). Advances in Artificial Neural Networks – Methodological Development and Application. Algorithms, 2, 973-1007. Huete, A. R. & Escadafal, R. (1991). Assessment of biophysical soil properties through spectral decomposition techniques. Remote Sensing of Environment, 35, 149-157. Huete, A. R., Liu, H.Q. (1994). An error and sensitivity analysis of the atmosphericcorrecting and soil-correcting variants of the NDVI for the modis-eos. IEEE Trans. Geosci. Remote Sensing, 32, 897-905. Kaul, M.; Hill, R. & Walthall, C. (2005). Artificial neural networks for corn and soybean yield prediction. Agricultural Systems, 85, 1-18. Krishnan, P.; Alexander, J. D.; Butler, B. J. & Hummel, J. W. (1980). Reflectance technique for predicting soil organic matter. Soil Science Society of America Journal, 44, 12821285. Ladoni, M.; Bahrami, H. A.; Alavipanah, S. K. & Norouzi, A. A. (2010). Estimating soil organic carbon from soil reflectance: A review. Precision Agriculture, 11, 82-100. Lal, R. (2001). Soils and the greenhouse effect, Soil Science Society of America Special pub. Lillesand, T. M. & Kieffer, R. W. (1987). Remote sensing and image ineroretation, New York: John Wiley and Sons. Liu, J.; Goering, C. E. & Tian, L. (2001). A neural network for setting target yields. American Society of Agricultural and Biological Engineers, 44, 705–713. Liu, C. W.; Huang, H.C.; Chen, S.K. & Kuo, Y.M. (2004). Subsurface return flow and ground water recharge of terrace fields in northern Taiwan. J. Am. Water Resources Assoc, 40, 603-614. Loveland, P. & Webb, J. (2003). Is there a critical level of organic matter in the agricultural soils of temperate regions: a review. soil Till Res, 70, 1-18. Lozano-Garcia, D. F.; Fernandez, R.N. & Johannsen, C.J. (1991). Assessment of regional biomass-soil relationships using vegetation indexes. IEEE Trans. Geosci. Remote Sensing, 29, 331-339. Lu, Y. C.; Daughtry, C.; Hart, G. & Watkins, B. (1997). The current state of precision farming. Food Reviews International, 13, 141–162. McKenzie, N. J.; Cresswell, H. P.; Ryan, P. J. & Grundy, M. (2000). Contemporary land resource survey requires improvements in direct soil measurement. Soil Science and Plant Analysis, 31, 1553-1569. Melesse, A. M. & Hanley, R. S (2005). Artificial neural network application for multiecosystem carbon flux simulation. Ecological Modelling, 189, 305-314. Miao, Y.; Mulla, D.J. & Robert, P.C. (2006). Identifying important factors influencing corn yield and grain quality variability using artificial neural networks. Precision Agriculture, 7, 117-135. Nelson, D. W. & Sommers, L.E. (1982) . Total carbon, organic carbon, and organic matter. Pettorelli, N.; Vik, J.O.; Mysterud, A.; Gaillard, J.M.; Tucker, C.J. & Stenseth, N.C. (2005). Using the satellite-derived NDVI to assess ecological responses to environmental change. Trends Ecol. Evol., 20, 503-510. Post, W. M.; Izaurralde, R. C.; Mann, L. K. & Bliss, N. (2001). Monitoring and verifying changes of organic carbon in soil. Climate Change, 51, 73-99.
196
Biomass and Remote Sensing of Biomass
Roy, S. K.; Shibusawa, S. & Okayama, T. (2006). Textural analysis of soil images to quantify and characterize the spatial variation of soil properties using a real-time soil sensor. Precision Agriculture, 7, 419-436. Rumelhart, D. E. & McClelland, J.L. (1986). Parallel Recognition in Modern computers. Explorations in the Microstructure of Cognition, 1. Foundations(MIT Press/ Bradford Books, Cambridge, MA.). Shepherd, K. D. & Walsh, M. G. (2002). Development of Reflectance Spectral Libraries for Characterization of Soil Properties. Soil Science Society of America Journal, 66, 988998. Sommer, M.; Wehrhan, M.; Zipprich, M.; Weller, U.; Castell, W.Z.; Ehrich, S.; Tandler, B. & Selige, T. (2003). Hierarchical data fusion for mapping soil units at field scale. Geoderma, 112, 179-196. Sorenson, L. K. & Dalsgaard, S. (2005). Determination of clay and other soil properties by near infrared spectroscopy. Soil Science Society of America Journal, 69, 159-167. Stamatiadis, S.; Christofides, C.; Tsadilas, C.; Samaras, V.; Schepers, J. S. & Francis, D. (2005). Groundsensor soil reflectance as related to soil properties and crop response in a cotton field. Precision Agriculture 6, 399-411. StatSoft (2004). Electronic Statistics Textbook (Tulsa, OK). http://www.statsoft.com/textbook/stathome.html. Suchenwirth, L.; Kleinscmit, B. & Forster, M. (2010). Modelling the distribution of organic carbon stocks in floodplain soils with VHSR remote sensing data and additional geoinformation. Proceedings of the remote sensing and photogrammetry society conference remote sensing and the carbon cycle, Burlington House, London, 5th, 14. Sudduth, K. A. & Hummel, J. W. (1993). Potable, near-infrared spectrophotometer for rapid soil analysis. Trans. ASAE, 36, 185-193. Sullivan, D. G., Shaw, J. N., Rickman, D., Mask, P. L., & Luvall, J. C. (2005). Using remote sensing data to evaluate surface soil properties in Alabama ultisols. Soil Science, 170 954–968. Thomasson, J. A.; Sui, R.; Cox, M. S. & Al-Rajehy, A. (2001). Soil reflectance sensing for determining soil properties in precision agriculture. Transactions of ASAE, 44, 1445-1453. Wetterlind, J.; Stenberg, B. & Soderstrom, M. (2008). The use of near infrared (NIR) spectroscopy to improve soil mapping at the farm scale. Precision Agriculture, 9, 57-69. Wilson, J. P. & Gallant, J. C. (2000). Terrain analysis. New York, Wiley & Sons. Zhang, C. & McGrath., D. (2004). Geostatistical and GIS analyses on soil organic carbon concentrations in grassland of southeastern Ireland from two different periods. Geoderma, 119, 261-275.