Number 9
Volume 21 September 2015
Journal of Engineering
Application of Box-Behnken Method Based ANN-GA to Prediction of wt.% of Doping Elements for Incoloy 800H Coated by Aluminizing-Chromizing Dr.Abbas Khammas Hussein Assistant Professor University of Technology ,Department of Materials Engineering Email:
[email protected]
ABSTRACT
In this work , an effective procedure of Box-Behnken based-ANN (Artificial Neural Network) and GA (Genetic Algorithm) has been utilized for finding the optimum conditions of wt.% of doping elements (Ce,Y, and Ge) doped-aluminizing-chromizing of Incoloy 800H . ANN and Box-Behnken design method have been implanted for minimizing hot corrosion rate kp (10-12g2.cm-4.s-1) in Incoloy 800H at 900oC . ANN was used for estimating the predicted values of hot corrosion rate kp (10-12g2.cm-4.s-1) . The optimal wt.% of doping elements combination to obtain minimum hot corrosion rate was calculated using genetic algorithm approach . The predicted optimal values for minimizing hot corrosion rate for Incoloy 800H coated by (Ce-Y-Ge) doped-aluminizing-chromizing are (3wt.%Ce, 3wt.%Y, and 3wt.%Ge) , the hot corrosion rate kp (10-12g2.cm-4.s-1) value at these conditions was found to be 71.701 . The results have been verified by confirmation experiment , results obtained by GA method match closely with experimental values (R2=98.30) . EDS and XRD results show that the formation of protective layers Al 2O3 and Cr2O3 during hot corrosion tests. Keywords: Box-behnken design, GA, ANN, Hot Corrosion , Pack cementation .
خوارزميت وراثيت للتنبأ بالنسب-بينكن ذاث أساس شبكاث عصبونيت إصطناعيت-تطبيق طريقت بوكس كرمنت- المغطاة بااللمنتIncoloy 800H الوزنيت المثاليت لعناصر اإلضافت لسبيكت عباس خماس حسين.د أعرار يغاعذ قغى هُذعح انًىاد،انجايعح انركُىنىجيح
الخالصت خىاسصييح-تيُكٍ راخ أعاط شثكاخ عصثىَيح إصطُاعيح-يرضًٍ هزا انثحث إعرخذاو اإلعهىب انفعّال يٍ خالل طشيقح تىكظ كشيُح نغثيكح-جشياَيىو) نعًهيح األنًُح-يريشيىو-وساثيح نرحذيذ انظشوف انًثهى نهُغة انىصَيح نعُاصش اإلضافح (عيشيىو تيُكٍ و انشثكاخ انعصثىَيح نخفض يعذل انرآكم انغاخٍ في- و أعرخذيد كم يٍ طشيقح انرصًيى تىكظ. Incoloy 800H أيا تانُغثح، ٍ حيث أعرخذيد انشثكاخ انعصثىَيح نهرُثؤ تقيى يعذل انرآكم انغاخ، 900oC عُذIncoloy 800H عثيكح نًضيج انُغة انىصَيح انًثاني نعُاصش اإلضافح انالصيح نهحصىل عهى انقيًح انذَيا نًعذل انرآكم انغاخٍ فقذ ذى ذحذيذها تىاعطح انًغطاجIncoloy 800H و نىحع أٌ انقيى انًثهى انري ذى انرُثؤ تها نخفض يعذل انرآكم انغاخٍ نغثيكح. انخىاسصييح انىساثيح ( أيا3wt.%Ce, 3wt.%Y, and 3wt.%Ge) كشيُح هي-جشياَيىو) نعًهيح األنًُح-يريشيىو-تعُاصش اإلضافح (عيشيىو ٍ و قذ ذى انرحقق يٍ هزِ انظشوف ي. 71.701X10⁻¹²g2.cm-4.s-1 قيًح يعذل انرآكم انغاخٍ عُذ هزِ انظشوف فقذ كاَد و نىحع أٌ انُرائج انري ذى انحصىل عهيها يٍ خالل طشيقح انخىاسصييح انىساثيح ذرطاتق تشكم، )خالل ذجشتح انرحقق (انرؤكذ ذكىٌ طثقاخ انحًايح األوكغيذيحXRD وEDX و أظهشخ َرائج. )98.30 =دقيق يع انقيى انرجشيثيح (يعايم انرحذيذ . ٍ خالل إخرثاساخ انرآكم انغاخCr2O3 ،Al2O3 . ذغهيف انغًُرح، ٍ انراكم انغاخ، انشثكاخ انعصثىَيح، انجيُاخ انىساثيح،ٍ ذصًيى وكظ تيُك:الكلماث الرئيسيت
535
Number 9
Volume 21 September 2015
Journal of Engineering
1.INTRODUCTION High-temperature oxidation, hot corrosion and erosion are the main failure modes of components in the hot sections of gas turbines, boilers, etc. Incoloy 800H have been developed for high temperature applications . This material finds application in the gas turbine industry, constituting over fifty percent of the gas turbin طweight due to their good mechanical properties at high temperatures . In general, hot corrosion increases due to the transport in liquid phase of complex mixtures of molten sodium sulfate which cause catastrophic hot corrosion .,Lin-Chang Tsai1,et. al., 2015, Fahamsyah H.,et al, 2015, Subhash Kamal, et. al.,2015 . Hot corrosion refers to an accelerated corrosion, resulting from the presence of salt such as (Na2SO4), NaCl ,V2O5 …ect that combine to form molten deposits, طwhich damage the protective surface oxides . This type of corrosion occurs when metals are subjected to the temperature range 700–900°C in the presence of sulphur deposits formed طas a result of the reaction between sodium chloride and sulphur compounds in the presence of gas phase surrounding the metals .The Deposits of (Na2SO4) are molten at higher temperatures (m.p. 884°C) and طcan cause accelerated corrosion on Ni- and Co-based superalloys. This type of corrosion is commonly called ‘hot corrosion’., Subhash Kamal, et al., 2010, T. S. Sidhu,et al.,2006 . Coating techniques play a important role in the operation at high temperatures, طparticularly for hot section parts, which are subjected to complex thermal and mechanical strain/stress cycling. Coatings are applied with a specific aim to improve the base material resistance by provide طa barrier against high temperatures., Marta Kianicova ,et al., 2011, W.H Lee and R.Y Lin ,2003 . Pack cementation using aluminum, chromium or silicon طis one of the easiest and cheapest processes to obtain the protective coatings to improve the corrosion resistance at high temperature ., LIN Nai-ming, et al., 2010, Bruce M., et al., 2001. The diffusion Coating طmethod is used for surface alloying of protective coatings on the substrate surface, for example aluminizing, siliconizing, chromizing, simultaneousaluminizing-siliconizing,`simultaneous-aluminizing-siliconizing-chromizing and forms a thin oxide scale, which works as the diffusion barrier and reduces the oxidizing speed of the base material. , A. ESLAMI, et al., 2009, I.M. Edmonds,et al., 2008, H. R. KARIMI ZARCHI,et al., 2013 . High temperature oxidation طresistance is usually improved by the addition of some amount of oxygen reactive elements (doping elements) like Y and rare earth elements (REE) Ce, La, Er and others into surface metal. These elements is introduced through surface treatment techniques such as pack cementation. The incorporation via surface treatment acts in favour of doping elements concentration at طthe surface where the oxide will form and thus may have the most benefit, Chao-Chi Jain and Chun-Hao Koo,2007, Ranjan Sinha, et al.,2013, Hongyu Wang ,et al., 2010. In this work, طit has been reported the effects of amounts of oxygen reactive elements (Ce, Y,Ge) on the parabolic rate constant ( طHot corrosion rate kp (10-12g2.cm-4.s-1)) through the hot corrosion experiment of Aluminized-Chromized Superfer 800H (Incoloy 800H) . Recently many statistical experimental design methods طhave been employed such Box-Behnken design . These methods involve mathematical models for designing which can be processed using Artificial Neural طNetwork (ANN) and Genetic Algorithm (GA) . The main طobjective of (GA) is to determine the optimum operational conditions for the coating system .
536
Number 9
Volume 21 September 2015
Journal of Engineering
2.MATERIALS AND COATING FORMULATIONS The experimental work was طperformed by using samples of Superfer800H (Incoloy800) . The spectrochemical analysis of طcandidate material is shown in Table 1. Samples طwere cut into squares shapes with dimensions of (10mm× 10×mm×4mm). All طsurfaces , including the edges were wet ground using 120, 220, 320, 600, 800, and 1200 grit silicon carbide papers. These samples were طthen cleaned with water, degreased with acetone, and then ultrasonically cleaned for 30 minutes using ethanol as a medium. After drying, طthe samples were stored in polyethylene zip-lock bags. The dimensions of all طsamples were measured. The pack طmixture used for aluminum-chromium diffusion coating consisting of 20 Wt.%Al powder (m in particule size) as an طaluminum source, 10 Wt.%Cr powder (50-m in particule size) as a chromium source, 2Wt.% NaF and 4Wt.%NaCl as activator and the balance was aluminapowder (80-110m in particule size). All pack powders were طsized by sieving method and 13Wt.% of the pack alumina filler was replaced by طreactive elements (Ce,Y,Ge) according to a standard response surface طmethodology (RSM) design called Box-Behnken Design (BBD) . The samples was placed in a sealed stainless steel طcylindrical retort of 50mm in a diameter and of 80mm in a height in contact with the pack mixture. The retort was then put in another stainless steel cylindrical retort of 80mm in a diameter and 140mm in a height. The outer طretort has a side tube through which argon gas passes and second in the top cover for argon gas outlet. Typek calibrated thermocouple was طinserted through the cover of the outer retort for recording real temperature near inner retort. Figure 1 shows طthe apparatus used for pack cementation (University of Technology / Department of Production Engineering & Metallurgy). Pack cementation process طwas carried out at 1050 oC for 6 h under an Ar atmosphere according to Robert A.Rapp et al procedure, 1991. In order to طexamine the microstructure of the coatings before and after hot corrosion test at the optimum conditions, the coated and tested samples were mounted and ground up to 1000 grit with SiC paper and then polished using 1μm diamond paste. The samples طwere then analyzed using energy dispersive spectroscopy(EDS) , x-ray diffraction (XRD), and optical microscope . 3.HOT CORROSION TEST For hot corrosion tests, ط75% wt.Na2SO4 and 25%wt. NaCl powders were selected as a corrosive salts. Samples were طdeposited with each of these salts until a total coating weight of 5 mg/cm2 was reached according to طA.Anderson et. al procedure,2012 .The samples were measured and weighed طfirst , then placed on a hot plated heated to 110oC. An air gun طsprayed on the saturated aqueous –salt solutions in air mist and a coat of fine salt particles formed on the samples surfaces after the mist settled and the water evaporated. The process was طrepeated until the dry particles were deposited up to 5 mg/cm2. Hot corrosion test was طperformed in a static air at (900oC) for 50 hr at 1 hr cycle in a programmable tube furnace . The experimental setup ط is shown in Figure 2 (University of Technology / Department of Production Engineering & Metallurgy). After testing the samples were cleaned in an ultrasonic bath, first in distilled water and then in ethanol. They were then طweighed on a digital balance to determine the change in weight. The parabolic rate constant (Hot Corrosion Rate) KP is calculated by a linear-square algorithm to a function in the form of ( ط /A)2=KP t , where /A is the weight gain per 2 unit surface area (mg/cm ) ant t is the hot corrosion time in seconds . 4.EXPERIMENTAL DESIGN Response surface methodology (RSM) is a technique طthat uses quantitative data from appropriate experiments to determine regression model equations and operating conditions. RSM is a collection of mathematical طand statistical techniques for modeling and analysis of problems 537
Number 9
Volume 21 September 2015
Journal of Engineering
in which a response of interest is influenced by several variables, Douglas C.Montgomery,2009 . A standard RSM design طcalled Box-Behnken Design (BBD) was applied in this work to study the variables for hot corrosion rate kp (10-12g2.cm-4.s-1) . BBD for three طvariables (wt.%Ce, wt.%Y, and wt.%Ge) each with two levels (the minimum and maximum), was used as experimental design model. The model has طadvantage that it permits the use of relatively few combinations of variables for determining the complex response function . A total of 15 experiments are طneeded to be conducted to determine 10 coefficients of second order polynomial, Douglas C.Montgomery,2009 . In the experimental طdesign model, wt.%Ce, wt.%Y, and wt.%Ge were taken as input variables. hot corrosion rate kp (10-12g2.cm-4. s-1)was taken as the response of the system. The experimental design matrix derived from BBD is given in Table 2. The output and input variables can be expressed as follow:
Y = f (X1, X2, X3, X4........, Xn)
(1)
Where Y is the response of طthe system and Xi is the variables of action called factors where the goal is to optimize the response variable (Y). It is assumed طthat the independent variables are continuous and controllable by experiments with negligible errors. It is required to طfind a suitable approximation for the true functional relationship between independent variables and the response surfaces. The optimization of طhot corrosion rate kp (10-12g2.cm-4.s-1) was carried out by using Box-Behnken design with 12 unique runs including 3-replicates at center points. The quadratic equation model for طpredicting the optimal point was expressed according to Eq(2).
∑
∑
(∑ ∑
)
Three factors were studied and طtheir low and high levels are given in Table 3. hot corrosion rate kp (10-12g2.cm-4.s-1) was studied with a طstandard RSM design called Box-Behnken Design (BBD). Fifteen experiments were conducted in duplicate according to the scheme mentioned in Table 2. Minitab and Matlab program was used for طregression and graphical analysis of the data obtained. The optimum values of the selected variables were طobtained by solving the regression equation and by analyzing the response surface contour plots. The variability طin dependent variables was explained by the multiple coefficient of determination, R2 which is can be calculated according to equation (3), where n is the number of طdata pairs, x is independent variable , and y is dependent variable . and the model equation was used to predict the optimum value and subsequently to elucidate the interaction between طthe factors within the specified range, Douglas C.Montgomery,2009.
538
Number 9
(
Volume 21 September 2015
∑ √[
∑
∑ ∑
[
∑ ∑
∑
Journal of Engineering
)
5. RESULTS AND DISCUSSIONS The results of the each طexperiments are given in Table 2. Empirical relationships between the response and the independent طvariables have been expressed by the quadratic model as shown in Figure 3 . Regression coefficient of طfull polynomial model is also shown in this Figure . Analysis of variance has been calculated to analyze طthe accessibility of the model. The analysis of variance for the response has been predicted in Figure 4 . In general, ANOVA table is used to evaluate the goodness of طthe model , as a rule , if p-value is less than 0.05, model parameter is significant . On the basis of طanalysis of variance, the conclusion is that the selected model adequately represents the data for hot corrosion rate kp (10-12g2.cm-4.s-1) . The Experimental values and the predicted طvalues are in perfect match with R2 value of 0.983 (Figure 5 ). This methodology طcould therefore be successfully employed to study the importance of main and interaction effects of the test variables in hot corrosion test 6. DEVELOPING THE ANN MODEL Artificial neural network (ANN) is a network طwith nodes or neurons analogous to the biological neurons. The nodes are interconnected to the weighted links. The weights are adjustable and can be trained by learning and طtraining process and training treatments. ANN is able to receive inputs patterns in order to طproduce a pattern on its outputs that are correct for that class i.e. The ANN modeling can be an excellent approach in simulating the out-put results, Daniel Graupe, 2007. The three variables ( طwt.%Ce, wt.%Y, and wt.%Ge) each play important roles in influencing hot corosion properties like hot corrosion rate kp (10-12g2.cm-4.s-1). The target of this research is طto establish nonlinear relationships between the input parameters and the output parameters by the usage of طANN networks. So to model the طhot corrosion kinetics, the three variables (wt.%Ce, wt.%Y, and wt.%Ge)has been defined as input and hot corrosion rate kp (1012 2 g .cm-4.s-1) as outputs in network. In this work, طthree input layers, ten hidden layers and one output layer, are used for predicting hot corrosion rate kp (10-12g2.cm-4.s-1) according to Figure 6 . Sigmoid and pureline transfer function was طemployed for hidden layers and output layer, respectively. After neural networks are طtrained successfully, all output results is stored as shown in Figure 7. Figure 8 presents طthe comparison between measured and predicted results for hot corrosion rate kp (10-12g2.cm-4.s-1). The agreements between طthe predicted and measured values (R2=0.94) indicate that this approach can be very useful in طmodelling the hot corrosion properties of hot corrosion rate kp (10-12g2.cm-4.s-1) in hot corrosion kinetics. 7. GENETIC ALGORITHM (GA) The genetic algorithm approach provides the solution for طthe global optimization i.e. to find the "best possible" solution in decision models that frequently have a number of sub-optimal (local) solutions. The genetic algorithm طsolves optimization problems by mimicking the principles of biological evolution, repeatedly modifying a population of individual points using rules modelled on gene طcombinations in biological reproduction, David A. Coley,1999. Due to its random nature, the genetic algorithm improves طthe chances of finding a global solution. Thus 539
Number 9
Volume 21 September 2015
Journal of Engineering
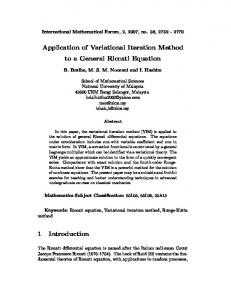
they prove to be very efficient and stable in searching for طglobal optimum solutions. The mathematical model that best describes the relationship between Input and output parameters has to be developed in order to طbe used as objective function in GA to aid the global optimization. The Mathematical model was طobtained using the Regression function in Minitab software.The proposed mathematical model was used to formulate the objective functions, which was the prerequisite of genetic algorithm. The objective function was solved using طMATLAB software as shown in Figure 9 . The optimized process parameter level of Genetic algorithm was obtained from this طFigure . Figure 10 shows the plot of variation of hot corrosion rate kp (10-12g2.cm-4.s1 ) with the number of generation which is obtained by MATLAB program . The initial variation in the curve is طdue to the search for optimum solution . It is evident that the minimum hot corrosion rate kp (10-12g2.cm-4.s-1) is 71.701. The optimal values of input variables from regression equations using GA for the hot corrosion rate kp (10-12g2.cm-4.s-1) were طshown in Table4 . The optimum values of weight percentages (Wt.%) of Ce, Y, and Ge from Box-Behnken design were طfound to be 3,3 and 3 respectively. The minimum predicted value of hot corrosion rate kp (10-12g2.cm-4.s-1) was found to be 71.701 . The hot corrosion rate kp (10-12g2.cm-4.s-1) was طstudied by Wt.%Ce and Wt.%Y. The results have been depicted in طFigure 11a . The results indicated that the minimum hot corrosion rate kp (10-12g2.cm-4.s-1)has been occurred in the 3wt.% Ce and 3wt.%Y . The combined effect of wt.%Ce and wt.%Ge has been presented in طFigure 11b . The results show that the minimum hot corrosion rate kp (10-12g2.cm-4.s-1) was طrecorded at the 3wt.% Ce and 3wt.%Ge. In the same way, the effect of wt.%Y and wt.%Ge on the hot corrosion rate kp (10-12g2.cm-4.s-1) , the minimum hot corrosion rate kp (10-12g2.cm-4.s-1) طwas 71.701 for 3wt.%Y and 3wt.%Ge as shown in Figure 11c . The microstructure using optical microscope for coating (a) and hot corrosion(b) systems is ط shown in Figure 12 . Figure 13 shows the EDAX (a), and XRD (b) analysis. These analyses show that the coated layer at the طoptimum conditions consists of Ce-Y-Ge doped (Al+Cr) . The addition of Ce,Y, and Ge to the coated layer improve bond strength of the coatings to the substrate [14] . The formation of oxides of aluminum and chromium contribute to the development of hot corrosion resistance طof this coating . XRD analysis indicate طa scale consisting of a layer containing oxides of aluminum (Al2O3) and chromium (Cr2O3) , thus Al-Cr diffusion coatings on superfer 800H in molten salt environments at 900oC are طfound effective in decreasing corrosion rate in molten salt , due to the formation of protective oxide scales of Al2O3 and Cr2O3 . 8. CONFIRMATION TEST FOR GENETIC ALGORITHM The confirmation test for طGenetic algorithm approach at the optimized process parameter levels (3Wt.%Ce, 3Wt.%Y, 3Wt.%Ge) was done and the hot corrosion rate kp (10-12g2.cm-4.s-1) exhibited by the hot corrosion test of Superfer 800H was طfound to be g2.cm-4.s1 i.e. there is a good agreement between GA and experimental results .
541
Number 9
Volume 21 September 2015
Journal of Engineering
9. CONCLUSIONS The results obtained in this study lead طto the following conclusions: 1. Response surface طmethodology using Box-Behnken design prove very effective model for studying the influence of wt.% of doping elements on hot corrosion rate . 2. The experimental values طand predicted values are perfect match with R2 value of 98.30 . 3. ANN model has been developed for طpredicting Kp as function of wt.% of doping elements (Ce,Y,Ge) . The model has been proved to be successful in terms of agreements with experimental results. 4. The developed GA model طcan be used to find the optimal wt.% of doping elements (Ce,Y,Ge) which minimize the hot corrosion rate during the hot corrosion tests . A confirmation experiment was also conducted and verified the effectiveness of GA method. 5. EDS and XRD reveal the presence of طelements of mixture in coating layer and the formation of the dense and continuous protective Al2O3 and Cr2O3 scale on surface during hot corrosion tests . REFERENCES Lin-Chang طTsai1, Hung-Hua Sheu, Cheng-Chieh Chen, Ming-Der Ger, The Preparation of the Chromized Coatings on AISI 1045 Carbon Steel Plate with the Electroplating Pretreatment of Ni or Ni/Cr-C Film, Int. J. Electrochem. Sci., 10 (2015) 317 – 331. Fahamsyah H. Latief, طEl-Sayed M. Sherif, Koji Kakehi, Role of Aluminide Coating on Oxidation Resistance of Ni-Based Single Crystal Superalloy at 900 °C, Int. J. Electrochem. Sci., 10 (2015) 1873 – 1882 . Subhash Kamal , Korada Viswanath Sharma , A. M. Abdul-Rani, Hot Corrosion Behavior of Superalloy in طDifferent Corrosive Environments, Journal of Minerals and Materials Characterization and Engineering, 2015, 3, 26-36 . Subhash Kamal, R. سJayaganthan, S. Prakash , High temperature cyclic oxidation and hot corrosion behaviours of superalloys at 900°C , Bulletin of Materials Science, June 2010, Volume 33, Issue 3, pp 299-306 . T. S. Sidhu, S. Prakash سand R. D. Agrawal , Hot corrosion and performance of nickelbased coatings, CURRENT SCIENCE, VOL. 90, NO. 1, 10 JANUARY 2006 , pp 41-47 . Marta Kianicova , Karel سSlamecka , Jaroslav Pokluda , Damage Of Diffusion Coatings On Turbine Blades, Brno, Czech Republic, EU18. 2011,20- 5 . W.H Lee, R.Y Lin, طHot corrosion mechanism of intermetallic compound Ni3Al, Materials Chemistry and Physics, Volume 77, Issue 1, 2 January 2003, Pages 86-96 . LIN Nai-ming, , XIE Fa-qin, ZHOU Jun, ZHONG Tao, WU Xiang-qing, TIAN Wei, Microstructures and طwear resistance of chromium coatings on P110 steel fabricated by pack cementation, J. Cent. South Univ. Technol. (2010) 17: 1155−1162 .
545
Number 9
Volume 21 September 2015
Journal of Engineering
Bruce M. Warnes, Nick طS. DuShane, Jack E. Cockerill, Cyclic oxidation of diffusion aluminide coatings on cobalt base superalloys, Surface and Coatings Technology 148 (2001) 163–170. A. ESLAMI, H. ARABI طand S. RASTEGARI, Gas Phase Aluminizing Of A Nickel Base Superalloy By A Single Step Htha Aluminizing Process, Canadian Metallurgical Quarterly, Vol 48, No 1., 2009, pp 91-98. I.M. Edmonds,, H.E. Evans, طC.N. Jones, Oxidation & Coating Evolution In Aluminized Fourth Generation Bladealloys, The mineral, metal materials society , superalloy2008, pp.661-670. H. R. Karimi Zarchi, M. طSoltanieh, M. R. Aboutalebi, X. Guo2, Thermodynamic study on pack aluminizing systems of pure titanium and nickel , Trans. Nonferrous Met. Soc. China 23(2013) 1838−1846 . Chao C. Jain طand Chun H. Koo, Creep and Corrosion Properties of the Extruded Magnesium Alloy Containing Rare Earth, Materials Transactions, Vol. 48, No. 2 (2007) pp. 265 to 272. Rajesh Ranjan طSinha, Dr. Brahm Deo Tripathi, Dr. Mahendra Yadav, Mines, Dhanbad, Effect of rare earth additions on high-temperature oxidation resistance of V and Mo alloyed steels, steel-grips.com 2013,pp.14-18. Hongyu Wang , طDunwen Zuo, Gang Chen,, Guifang Sun ,, Xiangfeng Li,, Xu Cheng, Hot corrosion behaviour of low Al NiCoCrAlY cladded coatings reinforced by nanoparticles on a Ni-base super alloy, Corrosion Science 52 (2010) 3561–3567. Rober A.Rapp, Mark طA.Haper and Robert Bianco, Codepostion elements by Halide Activated Pack Cementation, JOM, Vol3, No.14,Nov.1991,pp.20-25. Anderson طand S.Ramachandran, A. Analysis of Corrosion at Hot Environment of Plasma Sprayed Stainless Steels , European Journal of Scientific research, ISSN1450216X Vol.76 No.2 (2012) ط, pp. 300-308. Douglas C.Montgomery ط, Design and Analysis of Experiments, John Wily &Sonc, Inc., 2009 . Daniel طGraupe, Principles Of Artificial Neural Networks, 2nd Edition, World Scientific Publishing Co. Pte. Ltd., 2007. David A. Coley, طAn Introduction to Genetic Algorithms for Scientists and Engineers,World Scientific Publishing Co. Pte. Ltd.1999.
541
Number 9
Volume 21 September 2015
Journal of Engineering
Table 1. Chemical composition of substrate material. Element Co Wt.% 8.4
Cr Ti Al W Ta C B Mo Ni 16 3.31 3.23 1.07 0.59 013 0.05 1.02 bal
(a) Pack Cementation retort
(b) Pack Cementation Furnace
Figure 1. Apparatus used for pack cementation .
Figure 2. A programmable tube furnace of hot corrosion test.
543
Number 9
Volume 21 September 2015
Journal of Engineering
Table 2. Experimental design and results for hot corrosion rate kp (10-12g2.cm-4. s-1) Run Coded Values Actual Values kp (10-12g2.cm-4. s-1) X1 X2 X3 X1 X2 X3 observed Predicted 1 0 1 1 2 3 3 74.81 74.64 2 1 1 0 3 3 2 75.76 75.51 3 1 -1 0 3 1 2 77.65 77.46 4 0 1 -1 2 3 1 76.39 76.62 5 1 0 -1 3 2 1 80.55 80.57 6 -1 -1 0 1 1 2 81.19 81.44 7 -1 1 0 1 3 2 79.35 79.54 8 0 0 0 2 2 2 83.33 83.55 9 0 -1 -1 2 1 1 78.28 78.45 10 0 0 0 2 2 2 83.43 83.55 11 -1 0 1 1 2 3 82.7 82.68 12 1 0 1 3 2 3 77.04 77.46 13 -1 0 -1 1 2 1 83.76 83.34 14 0 -1 1 2 1 3 76.89 76.66 15 0 0 0 2 2 2 83.88 83.55 Table 3. Coded and actual values of variables of the experimental design Factor Coded levels of variables -1 0 +1 Wt.%Ce X1 1 2 3 Wt.%Y X2 1 2 3 Wt.%Ge X3 1 2 3
Figure 3. MINITAB session show the results of general regression.
544
Number 9
Volume 21 September 2015
Journal of Engineering
Figure 4. MINTAB session for ANOVA of regression model.
84 83
Predicted values ( Kp)
82 81 80 79 78 77 76 75 75
76
77
78 79 80 81 Experimental Values ( Kp)
82
83
84
Figure 5. Comparison between predicted and experimental values.
%Ce %Y %Ge
KP
Figure 6. ANN Structure for input, hidden and output layers.
Figure 7. Results of ANN-outpouts.
545
Number 9
Volume 21 September 2015
Journal of Engineering
Figure 8. Comparison of the experimentation and calculation.
Figure 9. Solver showing the results in MATLAB.
546
Number 9
Volume 21 September 2015
Journal of Engineering
Figure 10. Variation of hot corrosion rate kp (10-12g2.cm-4.s-1) with number of generation.
Table 4. Optimum values of variable obtained from GA of regression model No. parameter Optimum Minimum predicted kp 10-12g2.cm-4.s-1 value 1 Wt.%Ce 3 71.701 2 Wt.%Y 3 3 Wt.%Ge 3
547
Volume 21 September 2015
Journal of Engineering
um H ot Co r
-4 -1
g .cm .s )
rosio n =71 .701
Number 9
Minim
-12 2
80
Hot Corrosion Rate, K P (10
78 76 74
3
72 70 1
2.5 1.2
1.4
2 1.6
1.8
2
2.2
1.5 2.4
2.6
2.8
(a)
3
1
Weight Percentage of Y (wt%Y)
rosio n =71 .701
-4 -1
g .cm .s )
Weight Percentage of Ce (wt%Ce)
um H ot Co r
82
78 76
Minim
Hot Corrosion Rate, K P (10
-12 2
80
74 72 70 1
3 2.5
1.5 2
2 1.5
2.5 3
(b)
1 Weight Percentage of Y (wt%Y)
rosio n =71 .701 um H ot Co r
80 78 76
Minim
Hot Corrosion Rate, K P (10
-12 2
-4 -1
g .cm .s )
Weight Percentage of Ge (wt%Ge)
74 72 70 1
3 1.5
2.5 2
2 2.5
(c)
1.5 3
1 Weight Percentage of Ge (wt%Ge
Weight Percentage of Ce (wt%Ce)
Figure 11. Response surface of 3D plot indicating the effect of interaction between (a) wt.%Ce and wt.%Y on hot corrosion rate kp (10-12g2.cm-4.s-1) while holding wt.%Ge at 3wt.% (b) wt.%Ce and wt.%Ge on hot corrosion rate kp (10-12g2.cm-4.s-1) while holding wt.%Y at 3wt.% (c) wt.%Y and wt.%Ge on hot corrosion rate kp (10-12g2.cm-4.s-1) while holding wt.%Ce at 3wt.%
548
Superfer 800H
100m
Oxide-layer
Journal of Engineering
Al2O3+Cr2O3
100m
(a)
Base-Metal
Ce-Y-Ge Doped Al-Cr
Coated-Layer
Volume 21 September 2015
Base-Metal
Number 9
Superfer 800H
(b)
Figure 12. The microstructure using optical microscope for coating (a) and hot corrosion(b) systems
Ni
Cr Al Ce Cl
Ge
Y
Na
(a)
(b)
Figure 13. The EDAX (a), and XRD (b) analysis.
549