Apr 24, 2003 - for detection of adverse drug events (ADE) in pharmacovigilance. Methods ... small, of a short duration, do not detect late-onset or rare adverse ...
Blackwell Science, LtdOxford, UKBCPBritish Journal of Clinical Pharmacology0306-5251Blackwell Publishing 2003 ? 2003572127134Review ArticleData mining in pharmacovigilanceA. M. Wilson et al.
British Journal of Clinical Pharmacology
DOI:10.1046/j.1365-2125.2003.01968.x
Application of data mining techniques in pharmacovigilance Andrew M. Wilson,1,2 Lehana Thabane2,3 & Anne Holbrook1,2,3 Division of Clinical Pharmacology, Department of Medicine, 2Centre for Evaluation of Medicines and 3Department of Clinical Epidemiology and Biostatistics, McMaster University, 105 Main Street East, Level P1, Hamilton, ON L8N 1G6, Canada 1
Correspondence Dr Anne E Holbrook, Director, Centre for Evaluation of Medicine, 105 Main Street East, Level P1, Hamilton, Ontario L8N 1G6, Canada.
Keywords adverse drug events, data mining, knowledge discovery in databases, pharmacovigilance
Received 24 April 2003 Accepted 28 July 2003
Aims To discuss the potential use of data mining and knowledge discovery in databases for detection of adverse drug events (ADE) in pharmacovig ilance. Methods A literature search was conducted to identify articles, which contained details of data mining, signal generation or knowledge discovery in relation to adverse drug reactions or pharmacovigilance in medical databases. Results ADEs are common and result in significant mortality, and despite existing systems drugs have been withdrawn due to ADEs many years after licensing. Knowledge discovery in databases (KDD) is a technique which may be used to detect potential ADEs more efficiently. KDD involves the selection of data variables and databases, data preprocessing, data mining and data interpretation and utilization. Data mining encompasses a number of statistical techniques including cluster analysis, link analysis, deviation detection and disproportionality assessment which can be utilized to determine the presence of and to assess the strength of ADE signals. Currently the only data mining methods to be used in pharmacovigilance are those of disproportionality, such as the Proportional Reporting Ratio and Information Component, which have been used to analyse the UK Yellow Card Scheme spontaneous reporting database and the WHO Uppsala Monitoring Centre database. The association of pericarditis with practolol but not with other b-blockers, the association of captopril and other angiotensin-converting enzymes with cough, and the association of terfenadine with heart rate and rhythm disorders could be identified by mining the WHO database. Conclusion In view of the importance of ADEs and the development of massive data storage systems and powerful computer systems, the use of data mining techniques in knowledge discovery in medical databases is likely to be of increasing impor tance in the process of pharmacovigilance as they are likely to be able to detect signals earlier than using current methods.
Introduction
Adverse drug events (ADEs) constitute a major public health problem. They are estimated to account for up to 5% of hospital admissions [1], 28% of all emergency © 2003 Blackwell Publishing Ltd
department visits [2], and 5% of hospital deaths [3]. Many ADEs, such as prescription errors, are preventable [4], and methods have been suggested to reduce these errors [5, 6]. However other ADEs are unknown at the Br J Clin Pharmacol
57:2
127–134
127
A. M. Wilson et al.
time of marketing as premarketing studies are generally small, of a short duration, do not detect late-onset or rare adverse effects and, by excluding patients with comorbid disease, have limited generalizability. For example the interaction between terfenadine and cytochromal p450 enzyme inhibitors causing cardiac arrhythmias was only recognized 7 years after licensing [7]. Furthermore, clinical trials typically underplay harm in their reporting [8]. For example, increased risks of serious cardiac events with rofecoxib were suggested by a further analysis [9] of the VIGOR study [10], which occurred a year after the marketing of this therapy. In the current regulatory environment, where efficacious drugs are brought to market as soon as possible [11], post-marketing drug surveillance (PMS) has become increasingly important in order to characterize cost-effectiveness and harm in real practice. Recent examples of drug withdrawals, due to uncommon ADEs after millions of patients were exposed [12], have reinforced the inadequacy of current methods of PMS. Over recent years, with the development of large electronic health data storage systems, powerful computers and new statistical algorithms, there has been an increased interest in data mining or knowledge discovery initiatives from databases. These processes, which were mainly used in the marketing industry, have gained popularity in various fields such as web mining [13] and information science [14, 15] but very little information exists on their application in pharmacovigilance [16]. The purpose of this paper is to review the current use of data mining in pharmacovigilance and provide an overview of the data mining process. Methods
An electronic search of MEDLINE from 1966 to 2002 identified articles which contained the keywords ‘datamining, data mining, signal generation, exploratory methods, exploratory tools, neural network, disproportionality, signal detection, higher than expected combination, signal, data interrogation, database interrogation, Bayesian, cluster analysis, hypothesis generation, knowledge discovery, symmetrical analysis, prescription event monitoring’ and ‘adverse drug effect, adverse drug event, pharmacovigilance, drug side-effect, toxicology, electronic medical records, EMR, large administrative data, linked administrative data, Medicaid, MEMO, GPRD, Tayside, Saskatchewan, Unitedhealth Group, Harvard Pilgrim Health Care’. This search resulted in 340 citations, the title and abstract of which were reviewed. Sixty-four articles in the English language were identified, of which 39 manuscripts were considered relevant and reviewed. The relevant articles 128
57:2
Br J Clin Pharmacol
will be discussed within the context of the data mining process. What is data mining?
There is some confusion in the terminology of data mining. Some authors refer to data mining as the process of acquiring information, whereas others refer to data mining as utilization of statistical techniques within the knowledge discovery process. We will define knowledge discovery in databases (KDD) as the process of extracting previously unknown, valid and actionable information from large information sources or databases. The process requires a definition of the project goals, dataset acquisition, data cleaning and preprocessing, data mining, data interpretation and utilization [17]. We will define data mining as the application of statistical techniques, e.g. predictive modelling, clustering, link analysis, deviation detection and disproportionality measures, to databases. All of the above KDD steps are required when embarking on a project from the beginning. However, some researchers take a given database and perform statistical analysis in order to ‘mine it’ for additional unrecognized information and therefore call the process data mining. Many of the statistical techniques used in data mining are the same as conventional methods of examining data. However, their use within KDD differs in that there is no prior hypothesis or null hypothesis, and power calculations are not performed. For this reason, if no signal is produced at the end of the analysis it is not possible to tell whether this is because the signal does not exist or because insufficient data are being analysed. Essentially, once the aims have been defined and the database is prepared for data mining, the statistical techniques attempt to find patterns, or associations or dissimilarities between groups of data in order to generate a signal or detect new information. Steps of knowledge discovery in databases (Table 1) Identification of objectives/goals
Although there is no detailed a priori hypothesis in KDD, and one should keep an open mind when exploring for possible ADEs [18], it is important to have an aim, as KDD is costly in terms of data collection and management. Selection of variables
A clearly defined aim makes it easier to determine the type of variables and data mining technique to be used. For example, assessing drug-related birth defects would require a different data set than drug–drug interactions.
Data mining in pharmacovigilance
Table 1 The steps with rationale and examples, of the knowledge discovery in database (KDD) process Step of KDD process
Rationale
Example
Definition of the project goals Data set acquisition
To focus the project and determine the data set required Select the data set based on goals
To determine any ADE with a COX-2 inhibitors
Selection of data-base or databases Data cleaning and preprocessing Data mining Data interpretation and utilization
These will include patient demographics, past history, details of all prescribing and nonprescribed drugs, all diagnosis and symptoms (including gastrointestinal and cardiovascular). Many more variables will be required to exclude bias in the analysis and to search for other ADE. To ensure the database contains at The combination of a linked administrative database and electronic medical least the minimum required variables records To validate seemingly erroneous data Hysterectomy in males or to calculate socio-economic status from postal code entries and calculate additional fields Process the data Link analysis or measure of disproportionality To identify signal, perform further mining Determine a high association with cardiovascular disease and COX-2, report if required and to report the finding so this association via Dr Doctor letter and instigate a controlled observational that further studies can be performed
However, in order to maximize the chance of detecting a signal, the most inclusive collection of relevant variables should be used. The World Health Organization (WHO) Adverse Reaction Terminology and Medical Dictionary for Regulatory Activities (MedDRA) are examples of datasets used for pharmacovigilance [19], but their list of variables is limited to those determined by prior assessments of causation [20]. In terms of variable availability, electronic medical records (see below) hold potential in being the repository of the widest possible medical terminology. For example, new medical conditions, such as Severe Acute Respiratory Syndrome, will be used within electronic medical records before they are incorporated into adverse reaction terminology dictionaries.
study to prove the association
panies (i.e. to the UK Yellow Card Scheme, http:// medicines.mhra.gov.uk/) is an important procedure in PMS. However, as spontaneous reporting is a passive system, inconsistent reporting is a limitation with more frequent reporting for unusual reactions, reactions for new drugs and serious reactions [22]. Furthermore, the accuracy of the data contained within the reports is uncertain. However, spontaneous reporting databases do contain large amounts of data, for example the Food and Drug Administration (FDA) spontaneous reporting database contains over 2 million reports over a period of 35 years. These databases can therefore be mined to obtained details of ADEs. For example, a retrospective data mining of the FDA spontaneous reporting database was shown to identify ADEs many years prior to collecting reports alone [23], as is discussed further below.
Selection of data sources/databases
As data collection is expensive, data mining processes are often performed on existing databases, for the purposes of pharmacovigilance. The necessary size of the dataset required is difficult to determine but will depend on the data quality, the background frequency of the event and the strength of the association of the event with the drug. However, for even moderately rare events, large databases are required. The characteristics of the different large databases throughout the world are described elsewhere [21] and discussed below (Table 2). Spontaneous reporting databases The spontaneous reporting of a possible adverse drug reaction by healthcare providers to governmental agencies or drug com-
Prescription event monitoring databases Prescription event monitoring (PEM) is used to detect ADEs by collecting high-quality data from family doctors, on a select group of patients exposed to a specific (new) drug, for a limited period of time [24]. Heeley et al. [25] discuss the role of database exploration in order to detect ADE signals from a PEM database, which contains 1 million reports of events from 78 PEM studies. They point out that a limitation of PEM database mining is the lack of an adequate control group, as the database contains details of clusters of patients exposed to certain drugs. For example, tolterodine did not show evidence of hallucinations as an ADE because the control group contained patients prescribed other drugs known to Br J Clin Pharmacol
57:2
129
A. M. Wilson et al.
Table 2 Examples of databases used in knowledge discovery in databases for the purposes of pharmacovigilance Type of database
Example
Advantages
Disadvantages
Spontaneous reporting database
WHO Uppsala Monitoring Centre
Very large Relatively cheap
Requires association to be recognized and report to be submitted Not complete (under reporting) Not able to assess incidence rates No control group Reporting bias Only a few select drugs Control group may be inadequate
Assess the whole population
Prescription event monitoring database
Drug Safety Research Unit, Southampton, UK
Large linked administrative database
Medicaid, USA Canadian provincial linked
Electronic medical records
administrative utilization database COMPETE, Hamilton, Canada GPRD
Large Good quality data Identification of association not required Incidence rates can be calculated Very large Relatively cheap Capture data of routine clinical care More extensive data set
cause hallucinations. When the data from these patients were removed, an ADE signal for tolterodine was discovered [25]. Linked administrative databases Large linked health administrative databases, such as Medicaid in the USA and the Ontario provincial databases, contain data on millions of subjects and may also be used as a source for data mining. The data are available at relatively small additional costs and are not subject to recall or interviewer bias. However, the completeness of details, such as diagnoses, are questionable in many circumstances, and they tend to apply to elderly or low-income populations only, so may not be representative of the whole population. The Saskatchewan-linked administrative healthcare utilization database and the Tayside Medicines Monitoring (MEMO) are examples of linked medical health databases, and both have been utilized to identify risks of benzodiazepine therapy [26, 27].
Not representative of population Data set may not be accurate for all fields
Small Expensive
of the large number and detail of the variables, which can be combined to generate new diagnoses or adverse events, hypotheses, which are not restricted to existing diagnoses, can be explored. Although Honigman et al. [28] have investigated the use of EMR in detecting known ADEs, there have been no studies of data mining using EMR. Other databases Clinical trials databases and specialist databases such as overdose or toxicology databases may also contain valuable information. Data mining has been used to explore cardiovascular clinical trial databases [29], the US Vaccine Adverse Event Reporting System [30] and a large prescription database [31]. Signals for liver-related ADEs have been reported from analysis of a biochemistry laboratory database at a higher rate than that reported by physicians [32]. Poison information centres also record details of ADEs and may contribute to the pharmacovigilance process [33]. Data preprocessing
Electronic medical records Electronic medical records (EMRs) contain a large number of data fields, including details such as the use of tobacco products, smoking and nonprescription drugs, symptoms and signs, laboratory data and social circumstances, on a smaller number of patients and may also be used for data mining. Because 130
57:2
Br J Clin Pharmacol
Data preprocessing involves data sampling and data quality verification to ensure the data are clean and well described. Medical data can contain erroneous data such as ages of 120 years rather than 20 years, and a documentation of hysterectomy in males. New variables of interest to be used in the analysis can be generated from
Data mining in pharmacovigilance
the data. For example, it may be possible to estimate socio-economic status from the postal code. Data mining techniques
Predictive modelling Predictive modelling is a technique used to develop a model to relate a dependent variable with a set of independent variables in a manner similar to multiple regression analysis. There are two types of predictive modelling, namely classification, for categorical dependent variables, and value prediction, for continuous dependent variables. Classification is appropriate if the goal is to predict group membership of new records based on their characteristics (independent variables). Using classification, the most influential variable is identified and used to split the data into groups. This is then repeated with the next most influential variable until the data are fully characterized. For example, it may be possible to determine a classification criterion or rule that discriminates between different groups of patients with and without side-effects based on age, sex or socio-economic class. Value prediction uses both classification and regression to predict the future outcome of a patient based on, for example, their demographic or socio-economic characteristics. However, we need to use caution as, in any data analysis of continuous outcomes, the results of value prediction can be influenced by the presence of outliers in the data. Clustering or database segmentation Clustering uses an algorithm that segregates a database by evaluating the dissimilarity between records. Pairs of records are compared by the values of the individual fields within them, and clustering into groups provides fast and effective ordering in large datasets. Segmentation could be used to group patients with similar symptoms or diagnoses to determine whether there is a drug association. Thus, clustering is a technique of choice if the goal is to reduce a large sample of records to a smaller set of specific homogeneous subgroups (clusters) without losing much information about the whole sample. Because of the heterogeneity between clusters, this analysis can also be helpful in hypothesis development about the nature of the variation between subgroups. For example, if a database contained details of different cardiac pathologies (e.g. valvular heart disease) and medication (e.g. fenfluramine-phentermine), clustering analysis may have segregated patients according to heart disease and identified fenfluramine-phentermine as one of the main factors in this group. We could then explore the hypothesis of an association or causal link between cardiac valvular disease and fenfluramine-phentermine.
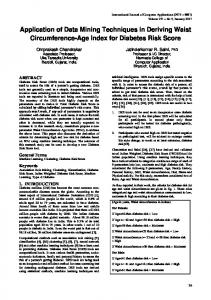
Link analysis Link analysis refers to methods that identify associations or links between records or sets of data [34]. It assesses associations by using an ‘if x then y’ type rule, by assessing patterns of behaviour or by identifying similar time sequences of events. In pharmacovigilance, link analysis could be used to identify associated factors such as the effect of renal impairment on the safety profile of diuretics. Deviation detection Deviation detection looks for outliers or values that deviate from the norm and can be seen either graphically or statistically. Visualization techniques are used to determine patterns hidden in data, e.g. scatter plots or histograms, multidimensional graphs for multivariate data, and time series plots. Statistics methods are then employed to measure significance of deviations once they have been detected. This process could be used to identify patients with idiosyncratic reactions or unusual symptoms, which could be related to medication and may constitute an ADE signal. Regression analysis and stratification can be used to assess the influence of age, sex and comorbidity on ADE signal generation. Measures of disproportionality (Figure 1) To our knowledge, measures of disproportionality are the only techniques which have been used to identify ADEs. They have been used by the Netherlands Pharmacovigilance Foundation [35], the UK Yellow Card database [36], WHO Uppsala Monitoring Centre [37] and PEM database [25]. Using the definition of a signal as a proportional reporting ratio (see Figure 1) >2, c2 >4 and three or more cases, Evans et al. [36] identified 487 signals from the Yellow Card database. Of those, 70% were recognized ADEs, 13% were due to the underlying disease and 17% were investigated further. Of the latter, 28% were reviewed in detail and in three cases the manufacturer was requested to change the product information. Using the Netherlands Pharmacovigilance Foundation it was possible to identify an association between delay of withdrawal bleeding during concomitant use of oral contraceptives and itraconazole, which had previously only been suggested by case reports [38]. The same authors also assessed the statistical interaction between the use of diuretics and nonsteroidal anti-inflammatory drugs (NSAID), and showed significantly higher use in combination, suggesting an effect of NSAID on diuretic use. In a retrospective study Lindquist et al. [39] defined an ADE subsequently reported in the medical literature as the gold standard, and reported that the Bayesian Confidence Propagation Neural Network (BCPNN) method at the WHO Uppsala Br J Clin Pharmacol
57:2
131
A. M. Wilson et al.
Suspected event
All other events
Suspected drug
A
B
All other drugs
C
D
Figure 1 Definitions of measures of disproportionality
Measure
Definition
Utilization
Reporting Odds Ratio (ROR)
A/C B/D
Netherlands Pharmacoviligance Foundation
Yules Q ratio
AD-BC AD+BC
Proportional reporting ratio (PRR)
A/(A+C) C/(C+D)
UK Yellow Card
Information component (IC)
log2 p(x,y) p(x)p(y)
WHO Uppsala Monitoring Centre
Where p(x) = probability that drug ‘x’ listed on case sheet p(y) = probability that ADE ‘y’ listed on case sheet p(y,x) = probability that drug-ADE combination ‘x’ and ‘y’ listed on case sheet
Monitoring Centre had a 46% positive predictive value and a 84% negative predictive value. More recently, Bate et al. [40] have demonstrated the use of the BCPNN Data Mining approach to detect signals of specific adverse drug reactions and also adverse events as a drug class effect. They demonstrated the association of pericarditis with practolol but not with other b-blockers, the association of captopril and other angiotensinconverting enzymes with cough, and the association with terfenadine and heart rate and rhythm disorders. Puijenbroek et al. [41] discuss the advantages and disadvantages of the different methods of disproportionality and show that although they were comparable, the Information Component (see Figure 1) was the most versatile but required knowledge of Bayesian statistics. The US Food and Drug Administration (FDA) uses a data mining algorithm called the Multi-item Gamma Poisson Shrinker (MGPS) to interrogate their spontaneous reporting database, as this has the ability to look at drug–drug interactions. The MGPS algorithm examines the ratio of an observed ADE to the total number of ADEs (over 56 million) in order to detect a signal using Bayesian statistical analysis. In a retrospective study the MPGS was shown to identify 20 out of 30 known ADEs 1–5 years prior to detection by standard methods [23]. The same authors also show that the number signal scores (the adjusted ratio of observed to expected counts) increased for rhabdomyolysis with cerivastatin from 1998 until 2001, when this drug was voluntarily withdrawn from the market [23]. 132
57:2
Br J Clin Pharmacol
Data interpretation and utilization It is likely that the KDD process will have to be repeated many times with redefinition of the goals and further analysis in light of the results of previous mining attempts. However, once a signal is identified then the degree of causation needs to be determined. Clearly the strength of the signal is important, but other criteria, suggested by BradfordHill, including the consistency and specificity of the finding, temporality, and plausibility, are required [42]. The Medicines Control Agency applies ‘SNIP’ criteria (the Strength of the signal, whether it is New, clinically Important or whether there is potential for Preventative measures), each criterion being independently associated with a signal generation [43]. Often causation is not confirmed and other methods such as case–control studies are required to examine the ADE [44, 45]. Once a potential ADE is identified and further investigation substantiates the adverse effect, this information needs to be quickly disseminated via reports to medical practitioners, e.g. the Dear Doctor letters, or articles in the medical literature [46]. In this way the medical community can be educated and steps can be put into place to reduce ADEs, making drug therapy less hazardous for patients. What KDD can and cannot do
It is currently not possible to link all available datasets together and run one of the data mining techniques to identify all possible adverse events. Data mining processes are not able to account for inaccurate or missing
Data mining in pharmacovigilance
data, and if a signal is not detected it is impossible to determine whether no ADE exists or the data are insufficient. Furthermore, KDD only generates a signal and, in the context of pharmacovigilance, further studies or investigations will be required to confirm a potential ADE. However, by being open minded, it is possible to search for many different ADEs at once. Also, information in many databases is under-utilized, and therefore KDD may be possible to generate new information from existing data sources at minimal extra cost. KDD will not replace traditional methods of pharmacovigilance, but if used in conjunction may reduce the time required for ADE identification [23]. It is impossible to predict the actual circumstances in which KDD will contribute to pharmacovigilance, but one would suspect that rare and atypical events, clusters of symptoms and signs not yet formulated in a diagnosis and common diagnoses not recognized as drug-related could all be flagged earlier and more reliably by employing systematic data mining techniques. Regular and repetitive analyses of accumulating data could maximize the opportunity to detect a signal of an ADE which is only evident after prolonged usage. In the future it may be possible to perform continuous data mining analysis, e.g. link analysis, on large electronic medical records to identify signals in a cost-effective manner. Conclusion
We have described the steps in KDD, the different statistical processes available during the data mining procedure, and discussed examples of where these techniques have been used in pharmacovigilance. When considering the frequency and significance of ADEs, as well as the inadequacy of premarketing ADE evaluation, it is clear that cost-effective methods of quickly identifying potential ADEs are required. Given the availability of larger datasets and faster computer processing speeds, we suggest that data mining techniques will have a greater role in pharmacovigilance in the future. A.H. is the recipient of a Career Investigator Award from the Canadian Institutes for Health Research.
References 1 Pirmohamed M, Breckenridge AM, Kitteringham NR, Park BK. Adverse drug reactions. Br Med J 1998; 316: 1295–8. 2 Patel P, Zed PJ. Drug-related visits to the emergency department: how big is the problem? Pharmacotherapy 2002; 22: 915–23. 3 Juntti-Patinen L, Neuvonen PJ. Drug-related deaths in a University central hospital. Eur J Clin Pharmacol 2002; 58: 479–82.
4 Bates DW, Cullen DJ, Laird N et al. Incidence of adverse drug events and potential adverse drug events. Implications for prevention. ADE Prevention Study Group. JAMA 1995; 274: 29– 34. 5 Leape LL, Cullen DJ, Clapp MD et al. Pharmacist participation on physician rounds and adverse drug events in the intensive care unit. JAMA 1999; 282: 267–70. 6 Bates DW, Leape LL, Cullen DJ et al. Effect of computerized physician order entry and a team intervention on prevention of serious medication errors. JAMA 1998; 280: 1311–16. 7 Honig PK, Woosley RL, Zamani K, Conner DP, Cantilena LR Jr. Changes in the pharmacokinetics and electrocardiographic pharmacodynamics of terfenadine with concomitant administration of erythromycin. Clin Pharmacol Ther 1992; 52: 231–8. 8 Ioannidis JP, Lau J. Completeness of safety reporting in randomized trials: an evaluation of 7 medical areas. JAMA 2001; 285: 437–43. 9 Mukherjee D, Nissen SE, Topol EJ. Risk of cardiovascular events associated with selective COX-2 inhibitors. JAMA 2001; 286: 954–9. 10 Bombardier C, Laine L, Reicin A et al. Comparison of upper gastrointestinal toxicity of rofecoxib and naproxen in patients with rheumatoid arthritis. VIGOR Study Group. N Engl J Med 2000; 343: 1520–8. 11 Edwards IR. The accelerating need for pharmacovigilance.J Roy Coll Physicians Lond 2000; 34: 48–51. 12 Friedman MA, Woodcock J, Lumpkin MM, Shuren JE, Hass AE, Thompson LJ. The safety of newly approved medicines: do recent market removals mean there is a problem? JAMA 1999; 281: 1728–34. 13 Chakrabarti S. Mining the web: Discovering knowledge from hypertext data. Morgan Kaufmann Publishers, San Francisco, CA, 2002. 14 Chowdhury GG. Template mining for information extraction from digital documents. Library Trends 1999; 48: 181–207. 15 Kwansnik BH. The role of classification in knowledge representation and discovery. Library Trends 1999; 48: 22–47. 16 Amery WK. Signal generation from spontaneous adverse event reports. Pharmacoepidemiol Drug Saf 1999; 8: 147–50. 17 Helma C, Gottmann E, Kramer S. Knowledge discovery and data mining in toxicology. Stat Meth Med Res 2000; 9: 329–58. 18 Coulter DM, Bate A, Meyboom RH, Lindquist M, Edwards IR. Antipsychotic drugs and heart muscle disorder in international pharmacovigilance: data mining study. extra. Details of methods: explanation of data mining methods. Br Med J 2001; 322: 1207– 9. 19 Brown EG. Effects of coding dictionary on signal generation: a consideration of use of MedDRA compared with WHO-ART. Drug Saf 2002; 25: 445–52. 20 Brown EG, Wood L, Wood S. The medical dictionary for regulatory activities (MedDRA). Drug Saf 1999; 20: 109–17. 21 Strom BL. How should one perform pharmacoepidemiology studies? Choosing among the available alternatives. In
Br J Clin Pharmacol
57:2
133
A. M. Wilson et al.
22
23
24 25 26
27
28
29
30
31
32
33
34
134
Pharmacoepidemiology, 3rd edn, ed Strom BL. Chichester: John Wiley & Sons Ltd, 2000; 401–13. Biriell C, Edwards R. Reasons for reporting adverse drug reactions – some thoughts based on an international review. Pharmacoepidemiol Drug Saf 1997; 6: 21–6. Szarfman A, Machado SG, O’Neill RT. Use of screening algorithms and computer systems to efficiently signal higher-than-expected combinations of drugs and events in the US FDA’s spontaneous reports database. Drug Saf 2002; 25: 381–92. Mann RD. Prescription-event monitoring–recent progress and future horizons. Br J Clin Pharmacol 1998; 46: 195–201. Heeley E, Wilton LV, Shakir SA. Automated signal generation in prescription-event monitoring. Drug Saf 2002; 25: 423–32. Rawson NS, Rawson MJ. Acute adverse event signalling scheme using the Saskatchewan Administrative health care utilization datafiles: results for two benzodiazepines. Can J Clin Pharmacol 1999; 6: 159–66. Barbone F, McMahon AD, Davey PG et al. Association of roadtraffic accidents with benzodiazepine use. Lancet 1998; 352: 1331–6. Honigman B, Lee J, Rothschild J et al. Using computerized data to identify adverse drug events in outpatients. J Am Med Inform Assoc 2001; 8: 254–66. Cerrito P. Application of data mining for examining polypharmacy and adverse effects in cardiology patients. Cardiovasc Toxicol 2001; 1: 177–9. Niu MT, Erwin DE, Braun MM. Data mining in the US Vaccine Adverse Event Reporting System (VAERS): early detection of intussusception and other events after rotavirus vaccination. Vaccine 2001; 19: 4627–34. Bytzer P, Hallas J. Drug-induced symptoms of functional dyspepsia and nausea. A symmetry analysis of one million prescriptions. Aliment Pharmacol Ther 2000; 14: 1479–84. Bagheri H, Michel F, Lapeyre-Mestre M et al. Detection and incidence of drug-induced liver injuries in hospital: a prospective analysis from laboratory signals. Br J Clin Pharmacol 2000; 50: 479–84. Mey C, Hentschel H, Hippius M, Balogh A. Documentation and evaluation of adverse drug reactions (ADR) – contribution from a poison information center. Int J Clin Pharmacol Ther 2002; 40: 102–7. Perner P, Petrou M. Machine learning and data mining in pattern recognition. Berlin: Springer Verlag, 1999.
57:2
Br J Clin Pharmacol
35 Egberts AC, Meyboom RH, van Puijenbroek EP. Use of measures of disproportionality in pharmacovigilance: three Dutch examples. Drug Saf 2002; 25: 453–8. 36 Evans SJ, Waller PC, Davis S. Use of proportional reporting ratios (PRRs) for signal generation from spontaneous adverse drug reaction reports. Pharmacoepidemiol Drug Saf 2001; 10: 483–6. 37 Bate A, Lindquist M, Edwards IR, Orre R. A data mining approach for signal detection and analysis. Drug Saf 2002; 25: 393–7. 38 van Puijenbroek EP, Egberts AC, Meyboom RH, Leufkens HG. Signalling possible drug–drug interactions in a spontaneous reporting system: delay of withdrawal bleeding during concomitant use of oral contraceptives and itraconazole. Br J Clin Pharmacol 1999; 47: 689–93. 39 Lindquist M, Stahl M, Bate A, Edwards IR, Meyboom RH. A retrospective evaluation of a data mining approach to aid finding new adverse drug reaction signals in the WHO international database. Drug Saf 2000; 23: 533–42. 40 Bate A, Lindquist M, Orre R, Edwards IR, Meyboom RH. Datamining analyses of pharmacovigilance signals in relation to relevant comparison drugs. Eur J Clin Pharmacol 2002; 58: 483– 90. 41 van Puijenbroek EP, Bate A, Leufkens HG, Lindquist M, Orre R, Egberts AC. A comparison of measures of disproportionality for signal detection in spontaneous reporting systems for adverse drug reactions. Pharmacoepidemiol Drug Saf 2002; 11: 3–10. 42 Shakir SA, Layton D. Causal association in pharmacovigilance and pharmacoepidemiology: thoughts on the application of the Austin Bradford-Hill criteria. Drug Saf 2002; 25: 467–71. 43 van Puijenbroek EP, van Grootheest K, Diemont WL, Leufkens HG, Egberts AC. Determinants of signal selection in a spontaneous reporting system for adverse drug reactions. Br J Clin Pharmacol 2001; 52: 579–86. 44 Dunn N, Freemantle S, Mann R. Nicorandil and diabetes: a nested case–control study to examine a signal generated by prescriptionevent monitoring. Eur J Clin Pharmacol 1999; 55: 159–62. 45 Kaufman DW, Rosenberg L, Mitchell AA. Signal generation and clarification: use of case–control data. Pharmacoepidemiol Drug Saf 2001; 10: 197–203. 46 Meyboom RH, Lindquist M, Egberts AC, Edwards IR. Signal selection and follow-up in pharmacovigilance. Drug Saf 2002; 25: 459–65.