Przegl¹d Geologiczny, vol. 53, nr 10/2, 2005
Application of digital elevation models to geological and geomorphological studies — some examples Janusz Badura*, Bogus³aw Przybylski* A b s t r a c t . Analysis of the Earth’s surface using three-dimensional models provides a wealth of new interpretation opportunities to geologists and geomorphologists. Linear elements, not visible on classical maps, become distinct features; it is also possible to interpret both small-scale glacial landforms and entire complexes of postglacial landscapes at the regional scale. Geomorphic features are frequently difficult to recognise in the field, either due to their scale or field obstacles. Three-dimensional visualization of the Earth’s surface and its examination at different angles and differently orientated source of light is extremely helpful in geological and geomorphological studies. This tool is, however, relatively seldom used due to either limited access to digital data bases or time-consuming procedures of individual construction of such bases from the existing cartographic data. For instance, analysis of small-scale glacial, fluvial J. Badura B. Przybylski or aeolian landforms in lowland areas requires cartographic data of resolution compatible with 1 : 10,000 scale. Nevertheless, less detailed digital elevation models, constructed at the scale of 1 : 50,000, are also extremely helpful, since they allow for regional interpretations of those morphostructures which are associated not only with neotectonics, but also with ice-flow directions, block disintegration of an ice-sheet, subglacial drainage, stages of fluvial erosion, or location of dune belts. A possibility of superposition of geological or geomorphological maps onto 3-D models is equally important, enhancing readability of the maps and providing clues to verification of the origin of landforms and proper cross-cutting relationships drawn on the map. Key words: digital elevation model, geological cartography, SW Poland
Rapid technological progress in electronics during the last years has resulted in increasingly more widespread application of digital elevation models (DEM) in geomorphological and geological research. Methods of obtaining aerial and satellite radar images have become more and more sophisticated, and significant progress in digital data processing is observed. Topographic data, whose processing required large data centers ten to twenty years ago, can now easily be transformed into DEMs and analysed on a regular PC. Digital elevation models more and more frequently replace traditional topographic maps in earth sciences. Shaded relief maps, portraying pseudo-3D image on a plane, were already introduced in the 17th century. At the end of the 18th century, a Saxon cartographer, Johann Lehmann, formulated mathematical rules necessary for the construction of maps showing relief shaded at a different angle. Shaded relief maps produced with the help of digital elevation models are based on more or less the same principles. Computer-stimulated progress consists first of all in shortening the time necessary for processing of such maps, from many months or even years to seconds or fractions of seconds. Suitable DEM software enables one to quickly generate shaded relief maps using differently orientated sources of light, as well as to construct different blockdiagrams. Further processing of a virtual 3D model makes it possible to generate images at such speed that they produce an impression of virtual reality. Such an effect is used, i.a. in computer games and flight simulators. As far as geological sciences are concerned, the studies of neotectonic structures are one of those disciplines which widely use digital elevation models (Badura, 1996, 1999; Przybylski, 1998; Grygar & Jelinek, 2003; Sherrod et al.,
*Polish Geological Institute, Lower Silesian Branch, Jaworowa 19, 53-122 Wroc³aw;
[email protected];
[email protected]
2004). Linear elements of the Earth’s surface of potentially tectonic origin, called topolineaments, used to be analysed by methods based on topographic maps and aerial and satellite images (Ostaficzuk, 1977; Graniczny, 1994; Badura & Przybylski, 1995; Migoñ, 1996). Application of DEMs enables for more detailed, in-depth and quick analysis of such structures. DEM images are more and more frequently used in an analysis of areas covered by Pleistocene ice-sheets (Clark, 1997; Munro & Shaw, 1997; Clark & Meehan, 2001; Fisher & Taylor, 2002; Munro-Stasiuk & Shaw, 2002; Sjorgen et al., 2002; Jorgensen & Piotrowski, 2003, Raunholm et al., 2003; Clark et al., 2004). Depending on DEM resolution, one can analyse either single landforms or regional distribution of assemblages of glacial landforms, like: eskers, subglacial channels, drumlins, terminal moraines, marginal streamways (“pradolinas”), or melt-out water valleys. These studies help to reconstruct the peculiarities of ice-sheet advances, dynamicity of ice streams, and glacier extent. We have used digital elevation models in neotectonic studies and analyses of glacial landforms of the Lower Silesia and Gniezno Pomerania regions. Selected examples of such studies are presented below. Methodology — elevation data bases and software Each digital evelation model requires a spatial data base wherein points on the Earth’s surface are assigned coordinates XY on the plane, and the vertical coordinate Z. In order to construct digital maps and blockdiagrams, it is necessary to transform XYZ data into the so-called grid, i.e. 3D network which is recognised by the computer as a model of the Earth’s surface. Such grid can be generated by different programs. One of popular tools of such type is the Surfer program, produced by Golden Software. Reliability of projection of a surface depends indirectly on grid density, but in fact it is limited by the available input of XYZ 977
Przegl¹d Geologiczny, vol. 53, nr 10/2, 2005
data. If points used for grid construction are widely-spaced, their artificial digital condensing does not influence projection quality. Some interpolation methods can lead to significant distortions of the genuine surface, instead of its generalization, particularly when the grid density is too high in respect to that of point distribution. In geological and geomorphological studies, the required density of spatial data and grids is dependent on scale and expected resolution. The higher resolution, the lower availability of data or grids of the required density. In regional analyses, one can use Internet elevation data bases. For instance, the GTOPO data base (http://edcdaac.usgs.gov/gtopo30/gtopo30.asp) provides elevation data for all continents in the DEM format at a density of 30", i.e., one point per 1 sq. km. These data enable continent-scale analyses. Another Internet-accessible data base, Digital Terrain Elevation Data (DTED level 0 and 1), acquired from the space shuttle Endeavour (SRTM — Shuttle Radar Topography Mission) mission, makes it possible to construct Earth’s surface models that are compatible with 1 : 250,000 maps, at grid density 90 m (ftp://e0mss21u.ecs.nasa.gov/srtm/; http://netgis.geo.uw.edu.pl). These data are perfectly suitable for, i.a,. analysis of mountain ranges of high elevation differences.
0
As far as lowland areas are concerned, however, their applicability is limited due to obscuring effects of vegetation cover. For instance, complexes of high trees obliterate visibility of most of glacial landforms, and limit image resolution of fluvial valleys. More detailed data are not easily accessible. The DTED level 2 data base of Poland is operated by the Management of Military Cartography. This base provides resolution of 30 m by 40 m, that of altitude being 2.5 m, i.e., like in 1 : 50,000 topographic maps. Still more detailed digital elevation models can be purchased from satellite data distributors. The available models of 20 m grid density are relatively expensive; data covering an area of a few thousand square kilometres may cost a few thousand euros. An allegedly cheaper method of acquiring DEM is contour digitalization from topographic maps. This technique is, however, extremely time-consuming. Average time of manual digitalization of a single sheet of 1 : 10,000 topographic map, system 65, is between 60 and 100 hours, depending on relief type and elevation differences. Semi-automatic digitalization cuts this interval into half; although semi-automatic data vectorization is slowed down by contours drawn by dashed lines. In every case, all
10 km
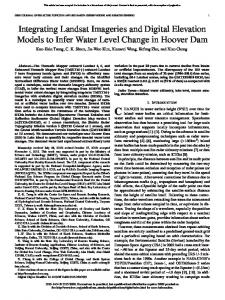
Fig. 1. An example of plastic visualization of a geological map. Geological map 1 : 200,000 (sheets K³odzko and Nachod) superposed upon a shaded relief map, constructed on the basis of a digital elevation model DTED level 2
978
Przegl¹d Geologiczny, vol. 53, nr 10/2, 2005
a geological map. Raster calibration is sometimes difficult to perform due to either the lack of coordinates or their intentional bias, a procedure frequently used in the former Warsaw Pact countries. In such cases, the map should be calibrated basing on characteristic points in the field. Building of individual digital elevation data bases and constructing 3D models, as well as superposition of geological maps on the former do not require sophisticated and expensive GIS programs. One can easily use a few simple programs, the total price of which is much more lower than that of elaborated, specialized software provided by MicroStation or ArcInfo. Depending on the required effects, it is recommended to use those programs which enable georeferencing and calibration of contours and elevation points digitized from raster maps, help in processing of elevation data into terrain models, georeferencing raster topographic
J
e
z
i
o
r
o
G
a
æ
contours need to be digitized and points situated within river valleys need to be condensed. Scarps and undermined slopes of large rivers require special care, and a great deal of cartographic and geomorphological experience. Digitized 1 : 10,000 maps provide detailed models for an analysis of small-scale glacial or fluvial landforms. Digital models can also be used in analysis and verification of the existing geological and geomorphological maps, provided that their scanned, raster images are available. Proper software enables such raster image to be calibrated according to the coordinates of a digital elevation model, and then be superposed on a 3D shaded relief map or blockdiagram (cf. Fig. 1). The obtained image can be verified regarding the strike of structures and map units confronted with the topography. This is an excellent method of verification of cross-cutting relationships shown on
0 100 m
1 km
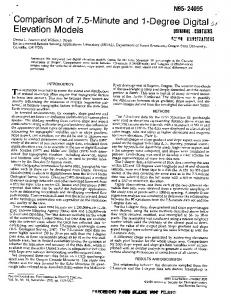
Fig. 2. Colour topographic map of a fragment of the Gniezno Pomerania region, based on a digital elevation model prepared from 1 : 10,000 topographic maps, system 65
979
Przegl¹d Geologiczny, vol. 53, nr 10/2, 2005
0
1
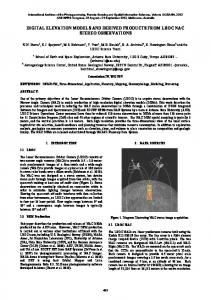
points during mapping. The map was also helpful in locating and planning access roads and field traverses (Fig. 2). Visualization of minor elevation differences, of the order of 1.5–3.0 m, made it possible to distinguish landscapes of melt-out topography developed upon tills. Other landforms included traces of subglacial channels and proglacial outflow. For the purposes of regional analysis, a colour shaded relief map was constructed (Fig. 3). The digital elevation model helped to depict areas characterized by melt-out morphology, subglacial channels, and numerous depressions left after dead ice blocks. Subglacial furrows in this area can be subdivided into two types: large and 20–40-m-deep landforms and hollow channels. The latter are of special interest, since they have not been recognised yet. These channels, up to 5 m deep and 100 m wide, are situated in forested areas, preventing close examination. Digital maps proved also useful in tracing recessional lobes
2 km
Fig. 3. Colour shaded relief map of the Strzelno region
and geological maps, as well as superposing the latter onto terrain models. Programs offered by Golden Software, Eagle Globe Software Company, or Able Software Corp., as well as typical office programs can be used for such purposes. Digital elevation models of areas covered by Pleistocene glaciations — examples
l
e
y
A digital elevation model based on 1 : 10,000 topographic maps, system 65, has been used to analyse postglacial morphology of the Strzelno region, Gniezno Pomerania (NW Poland). The model proved very helpful already during field mapping, providing special topographic maps. A 0 1 2 km contour map bearing specially assembled colour scale was constructed, visualizing small-scale, Fig. 4. Geomorphological sketch map of a fragment of the Ko¿uchowskie Wzgórza hills, not high landforms. This map superposed upon a shaded relief map based on 1 : 50,000 topographic maps, system became superposed by topography extracted from 1 : 10,000 topographic maps, so as to prel sent even minor landforms which a V are hardly recognisable in the r field. In an area of former dead-ib ó ce topography with poorly visible B outflow channels, such differences control location of traverses and the density of documentation
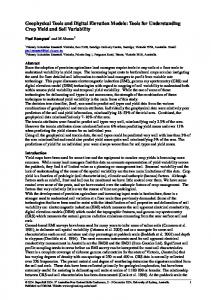
® Fig. 5. Pseudo-spatial visualization of the Earth’s surface of Wilkocin region near Przemków (Silesian Lowland). Arc-like morainic ridges form a barrier to a dune field
980
[m a.s.l.] 200 190
0
180 170 160
5k
m
150 140 130 120
Przegl¹d Geologiczny, vol. 53, nr 10/2, 2005
each other or en echelon. Orthogonal outline of intramontane depressions is well visible. Maps of shaded relief helped to recognise ring structures (Przybylski & Badura, 2004). Digital images suggest new interpretations of previous hypotheses like, for instance, those concerning the presence of faults surrounding the Jelenia Góra Depression, cuestas within the North-Sudetic Depression, as well as the NW and SE continuation of the Sudetic Marginal Fault (Fig. 6). The shaded relief map of the Sudetic Marginal Fault, in turn, portrays 0 25 50 km changeable strike of this fault which is accompanied by triangular and trapezoidal facets (Badura et al., 2004). These properties Fig. 6. Colour shaded relief map of the Sudetes based on a digital elevation model DTED level 2 point to tectonic movements that have affected this area after the last deglaciation. Digital elevanear Strzelno. Each lobe is marked by hills of frontal moraines and marginal escarpments of the outwash plain. The tion models were also helpful in verification of the origin of present-day SE escarpment of the outwash plain is hanging surfaces situated in front of the Sudetes, which used to be in respect to the lower-situated, till-covered surface, indi- interpreted as alluvial fans deposited at the turn of the cating that the outwash plain must have been in contact Vistulian and the beginning of the Holocene. Close examiwith a stable ice-sheet margin on the east. The outwash sur- nation of digital maps and blockdiagrams, aided by new drilling data, indicated that these surfaces are in fact pediface became hanging after the ice had melted. In Lower Silesia, digital elevation models have also ments overlain by Neogene colluvium. Superposition of geological maps upon DEMs calls for been used to analyse glacial landforms that originated during reinterpretation of previous interpretations in the Sudetes earlier glaciations. The DEM of the Silesian Rampart presents spatial distribution of ridges and minor landforms they and their foreland. A good example is provided by a fragcontain. We are inclined to link the latter with glaciotectonic ment of the Sudetic Marginal Fault near Che³miec (Fig. 7), slices. The changeable orientation of ridges helped to recon- where tectonically-controlled slope is covered by basalts. struct the extent of glacial lobes. The model of Wzgórza Two alternative interpretations can be proposed: either the Ko¿uchowskie hills was useful in verifying their geomor- lava flow moved along the slope, or the basalt plug was phological sketch, and the obtained blockdiagram clearly displaced by a fault. Such different interpretations are showed the topography of this area (Fig. 4), dominated by important for the dating of faulting, provided the age of the the Bóbr River valley with a few terraces. Glacial morpho- intrusion is well constrained (Badura et al., 2006). Images provided by digital models clearly show the logy of this region is of polygenetic character. Old, larinfluence of tectonics on the topography of the Sudetic ge-scale pushed moraines formed during the South-Polish foreland. For instance, the Opole region displays a com(Elsterian) glaciations are superimposed by a system of plicated pattern of young faults and landforms resulting smaller moraines, kames, and outwash plains originated during the Middle-Polish (Saalian) glaciations. Near Przemków, on the other hand, the DEM helped to recognise a belt basalt of recessional moraines which marked small-scale lobes of the Middle-Polish glacial advances. These moraines form now a barrier to a vast dune field (Fig. 5). Digital elevation models in morphostructural studies — examples Recently, digital elevation models have widely been used to study the influence of geological structures and neotectonic processes upon geomorphology of Lower Silesia (Badura, 1996, 1999; Przybylski, 1998; Badura & Przybylski, 2000; Badura et al., 2003a, b). A DEM of the Sudetes (DTED level 2) clearly shows topolineaments, most probably of tectonic origin, as indicated by their rectilinearity, considerable length, and repetition of similarly orientated structures that are arranged either parallel to
Fig. 7. Geological map superposed upon a digital elevation model of the Sudetic Marginal Fault near Che³miec
981
Przegl¹d Geologiczny, vol. 53, nr 10/2, 2005
r a O d
from fluvial erosion. Vertical crustal movements apparently modified the Odra River course even at the end of the Vistulian. The river cut two broad channels on the west and east of the upland built of Cretaceous and Neogene strata. The city of Opole itself is situated on a tectonic block which became transformed into an erosional remnant (Fig. 8). Digital elevation models make it also possible to analyse the influence of young tectonic movements on the topography of lowland areas, like, e.g., in the Trzebnickie Wzgórza hills. The latter are cut on the south by a tectonic escarpment (Badura & Przybylski, 2001). The pushed frontal moraine, lobate in shape, is cut on the south by a rectilinear fault which must have been reactivated after formation of the hills during the South-Polish (Elsterian) glaciations (Fig. 9). Final remarks
Digital elevation models have proved to be increasingly more important in geological and geomorphological studies. DEMs and their software can be used as a 0 1 2 km tool in a complex analysis of the Earth’s topography and legible data visualization. Quick conFig. 8. Colour shaded relief map of the Niemodlin Plain, Opole Plain, and Odra River valley, struction of colour contour maps based on a digital elevation model constructed from 1 : 10,000 topographic maps, system 65 or shaded relief maps represents only basic application of digital elevation data. Digital models are also helpful in fast construction of a number of derivative maps, like those of slope, gradient, aspect, extent of ice-sheet or marine transgressions, as well as former extent of dammed lakes. Application of DEMs can enhance drawing of geological cross-sections of any orientation. Apart from present-day topography, it is also possible to digitally analyse buried surfaces basing on well logs and geophysical data. Such models need, however, specially prepared well-log and geophysical data bases, and the density of subsurface data points is usually lower than that of surface models. At this moment, it deems 0 1 2 km necessary that geologists and geomorphologists become more Fig. 9. Colour shaded relief map of the Trzebnickie Wzgórza hills based on a digital elevation engaged in using DEM techniqumodel DTED level 2. Dashed line marks the inferred fault line
982
Przegl¹d Geologiczny, vol. 53, nr 10/2, 2005
es. The necessity of applying digital techniques has been underlined many times (cf. Zuchiewicz, 1995; Ostaficzuk, 2003). The most important difficulty nowadays is not the cost of necessary software, but the availability of digital data which are detailed sufficiently enough. The latter are in Poland hardly available and still expensive, both regarding the purchasing price and the workload required by self-digitizing of topographic maps. Recent tendencies to more open public access to satellite data, however, provide perspectives for the availability of detailed data in the nearest future. A good example of such tendencies is a new Internet browser provided by NASA, called WorldWind, which enables every PC user to inspect satellite images of resolution up to 15 m, from all over the world. One can chose from three colour options, and the satellite image is superimposed on a SRTM level 1 terrain model, providing 3D effects. For the time being, in the United States only, both aerial and satellite images of a resolution up to 1 m are available, being supplemented by relevant topographic maps, all of them provided by the United States Geological Survey (USGS). The WorldWind software, or a similar software, Google Earth are a signal of what may be expected in not so distant future, i.e., nearly common and instant access to the Earth’s images. Public availability of archival digital elevation data gathered in different times should also provide an opportunity of monitoring geodynamic processes. Translated by Witold Zuchiewicz
References BADURA J. 1996 — Morfotektonika Obni¿enia ¯ytawsko-Zgorzeleckiego. Prz. Geol., 46: 1239–1243. BADURA J. 1999 — The influence of Cainozoic tectonic movements on geomorphological development of the Niemcza-Strzelin Hills. Quaternary Studies in Poland, Specl. Iss.: 219–225. BADURA J., JAMROZ O. & ZUCHIEWICZ W. 2003a — Recent crustal mobility of the Upper Nysa K³odzka Graben, SW Poland. Acta Montana, IRSM AS CR (2003), Ser. A, 24, 131: 65–71. BADURA J., PÉCSKAY Z., KOSZOWSKA E., WOLSKA A., ZUCHIEWICZ W. & PRZYBYLSKI B. 2006 (in print) — Nowe dane o wieku i petrologii kenozoicznych bazaltoidów dolnoœl¹skich. Prz. Geol. BADURA J. & PRZYBYLSKI B. 1995 — Neotektoniczne aspekty rzeŸby przedpola Sudetów Wschodnich. Prz. Geol., 43: 762–766. BADURA J. & PRZYBYLSKI B. 1999 — Examples of young tectonic activity from the Sudetic Foreland, SW Poland — application of condensed contour map. Techn. Poszuk. Geol. Geosynopt. Geoter.: 38–45 BADURA J. & PRZYBYLSKI B. 2000 — Digital model of terrain as an identification method of potential fault scarps in mountain and fore-
land areas — examples from SW Poland. [In:] W. Stackebrandt, S. Lorenc (eds.) Tagungsband zur 9. Jahrestagung der Gesellschaft für Geowissenschaften e.V. Frankfurt/O S³ubice 20–25.09.2000. Exkursionsführer und Veröffentlichungen der Gesellschaft für Geowissenschaften e. V. Berlin, Bd. 209: 34. BADURA J., ZUCHIEWICZ W., GÓRECKI A., SROKA W., PRZYBYLSKI B. & ¯YSZKOWSKA M. 2003b — Morphotectonic properties of the Sudetic Marginal Fault, SW Poland. Acta Montana, IRSM AS CR (2003), Ser. A, 23, 131: 21–49. CLARK C. D. 1997 — Reconstructing the evolutionary dynamics of former ice sheets using multi-temporal evidence, remote sensing and GIS. Quater. Sc. Rev., 16: 1067–1092. CLARK C. D. & MEEHAN R. T. 2001 — Subglacial bedform geomorphology of the Irish Ice Sheet reveals major configuration changes during growth and decay. Jour. Quater. Sc., 16: 483–496. CLARK C. D., EVANS D. J. A., KHATWA A., BRADWELL T., JORDAN C. J., MARSH S. H., MITCHELL W., A., BATEMAN M. D. 2004 — Map and GIS of glacial landforms and features related to the last British Ice Sheet. Boreas, 33: 359–375. FISHER T. G. & TAYLOR L. D. 2002 — Sedimentary and stratigraphic evidence for subglacial flooding, south-central Michigan, USA. Quater. Inter., 90: 87–115. GRANICZNY M. 1994 — Strefy nieci¹g³oœci tektonicznych w œwietle korelacji wielotematycznych danych geologicznych na przyk³adzie okolic ¯arnowca i Ziemi K³odzkiej. Instrukcje i Metody Badañ Geol., 54: 1–82. GRYGAR R. & JELINEK J. 2003 — The Upper Morava an Nysa pull-apart grabens- the evidence of neotectonic dextral transtention on the Sudetic fault system. Acta Montana, IRSM AS CR (2003), Ser. A, 23, 131: 51–59. JORGENSEN F. & PIOTROWSKI J. A. 2003 — Signature of the Baltic Ice Stream on Funen Island, Denmark during the Weichselian glaciation. Boreas, 32: 242–255. MIGOÑ P. 1996 — Struktura morfotektoniczna centralnej czêœci Sudetów Zachodnich w œwietle mapy zagêszczonych poziomic. Czas. Geograf., 67: 233–244. MUNRO M. & SHAW J. 1997 — Erosional origin of hummocky terrain in south central Alberta, Canada. Geology, 25: 1027–1030. MUNRO-STASIUK M. J. & SHAW J. 2002 — The Blackspring Ridge Flute Field, South-central Alberta, Canada: evidence for subglacial sheetflow erosion. Quater. Intern., 90: 75–86. OSTAFICZUK S. 2003 — Znaczenie wysokoœciowego numerycznego modelu terenu w kartografii geologicznej. Techn. Poszuk. Geol. Geosynopt. i Geoter., 224: 53–58. PRZYBYLSKI B. 1998 — Glacial and neotectonic constraints on the Quaternary evolution of the Fore-Sudetic reach of the Nysa K³odzka River. Geol. Quarter., 42: 221–238. PRZYBYLSKI B. & BADURA J. 2004 — Czy struktury koliste w Sudetach mog¹ mieæ genezê uderzeniow¹? Prz. Geol., 52: 971–978. RAUNHOLM S., SEJRUP H. P. & LARSEN E. 2003 — Lateglacial landform associations at Jaren (SW Norway) and their glaci-dynamic implications. Boreas, 32: 462–475. SHERROD B. L., BROCHER T. M., WEAVER C. S., BUCKNAM R. C., BLAKELY R. J., KELSEY H. M., NELSON A. R. &HAUGERUD R. 2004 — Holocene fault scarps near Tacoma, Washington, USA. Geology, 32: 9–12. SJORGEN D. B., FISHER T. G., TAYLOR L. D., JOL H. M. & MUNRO-STASIUK M. J. 2002 — Incipient tunnel channels. Quater. Intern., 90: 41–56. ZUCHIEWICZ W. 1995 — Neotectonics of Poland: a state-of-the-art review. Folia Quater., 66: 7–37.
983