Application of Evolutionary Algorithms to Learning Evolved Bayesian Network Models of Rig Operations in the Gulf of Mexico François A. Fournier 1,2, Yanghui Wu 1, John McCall* 1, Andrei Petrovski 1, Peter J. Barclay 2, 1 School of Computing, Robert Gordon University, Aberdeen, AB10 1FR, Scotland ODS-Petrodata Ltd., The Exchange No. 1, Market Street, Aberdeen, AB11 5PJ, Scotland {f.a.j.fournier, y.wu3, j.mccall, a.petrovski}@rgu.ac.uk,
[email protected] * corresponding author
2
Abstract. The operation of drilling rigs is highly expensive. It is therefore important to be able to identify and analyse variables affecting rig operations. We investigate the use of Genetic Algorithms and Ant Colony Optimisation to induce a Bayesian Network model for the real world problem of Rig Operations Management and confirm the validity of our previous model. We explore the relative performances of different search and scoring heuristics and consider trade-offs between best network score and computation time from an industry standpoint. Finally, we analyse edge-discovery statistics over repeated runs to explain observed differences between the algorithms.
1
Introduction
The oil and gas sector is an active industry constantly seeking to research and apply new technologies. Drilling rigs are operated by contractors who hire out their services to oil companies for both exploration and exploitation. The operation of drilling rigs is highly expensive. Typically a rig operating offshore in the Gulf of Mexico can cost from $400K to $600K per day, at the time of writing.[1] With rig operations lasting weeks or even months at a time, variations in the efficiency with which rigs are operated can affect profitability by millions of dollars. It is therefore important to be able to identify and analyse variables affecting efficiency. In this paper, we apply new ACO-based algorithms to rig operations modelling and analyse results alongside those published in [2]. Here, we are interested in exploring the relative performances of different search and score heuristics and consider tradeoffs between best network score and computation time from an industry standpoint. We also analyse edge-discovery statistics over repeated runs to explain observed differences between the algorithms. In the following section, we provide an overview of drilling rig operations and the rig tendering process. In section 3, we summarise the Bayesian Network modelling approach and describe the GA- and ACO-based search and score heuristics [2] [3] used to build these networks from the data. In Section 4, we describe our experiments
2 François A. Fournier Andrei Petrovski 1, Peter J. Barclay 2,
1,2,
Yanghui
Wu
1,
John
McCall*
1,
with Rig and Wells data. The experimental results are analysed in Section 5. The final section contains conclusions and a brief outline of planned future work.
2
Rig Operations and The Gulf of Mexico
The offshore drilling market is dynamic, highly competitive, and regionallyspecific. Oil is located using surveys. Then a drilling rig is brought on site and starts drilling. Casings are installed along the way. The well is then secured and installed in order to let the oil flow in a controlled manner. The oil rig is then removed from the site and production equipment is set up to extract the oil from the well [4]. Regarding performance, Harris, in [5] explains that although no two wells perform exactly the same, consistently good results are a good indicator of a rig’s capability. He highlights three main criteria, currently used to select rigs: technical suitability, price, and availability. Other, more recent, evaluation criteria are exposed by Osmunsen in [6] and are starting to be used, mainly in Europe for the moment. Rig tendering is the process by which a company contracts a rig for a given operation. When selecting a rig for a drilling programme, an operator typically has three main criteria: technical suitability, price, and availability. Some technical parameters are absolute and determine the type of rig and equipment. Examples are water depth, pressure and temperature ratings, etc. However, alternatives can sometimes be suitable: under some conditions, semi-submersibles can operate in jackup water depth [5]. Many of the other technical requirements included in an invitation to tender are often preferences rather than necessities. In recent years, quality has been made more important in decision-making and contractors in Europe are often asked to provide percentage downtime and indicators of drilling efficiency for the past six wells including water depth, mooring time, loss of time and repair time [6]. However this information is not often available in most regions across the globe. Various regions have different regulations and do not require the same level of disclosure from drilling companies. For this paper, we are using the Gulf of Mexico Rigs and Wells Dataset as built by us in [2], using ODS-Petrodata ltd. [1] market intelligence databases.
3
Bayesian Networks
Using our exclusive dataset, we are creating a model of the data. Bayesian Networks are probabilistic models based on Bayesian Inference [7]. They are useful for representing knowledge under uncertainty. They can be depicted using a Directed Acyclic Graph (DAG) associated with a joint probability distribution [8]. Each node of the graph represents a random variable X i related to a problem domain. Conditional dependencies between variables are represented by directed ―parent-child‖ edges in the DAG. The probability distribution factorises according to these conditional dependencies. Formally, the joint probability distribution P(X) over the set of random variables X = X1,…,Xn, is determined as the product shown in (1). Here, Pa(X i) denotes the set of parents of node Xi .
Application of Evolutionary Algorithms to Learning Evolved Bayesian Network Models of Rig Operations in the Gulf of Mexico 3 n
P( X 1 , X 2 ,..., X n )
P( X i | Pa ( X i ))
(1) To make use of the power of Bayesian Networks in knowledge representation and inference, the network has to be constructed for the given domain. This construction is based on learning from the data collection. The underlying Directed Acyclic Graph structure representing the network has to be learned and then the conditional probabilities calculated. Learning the underlying structure is a hard problem [9] because the number of possible structures grows super-exponentially with the number of variables [10]. One widely used approach to this problem is search and score. A metaheuristic is used to search a space representing possible networks. Each solution is scored according to how well it reflects the observed distribution of the data. The rest of this section illustrates the structure of the algorithms used in the experiments for this publication. The code we developed for those algorithms are publicly available on request to the corresponding author. i 1
3.1
The K2 algorithm
The K2 algorithm was proposed by Cooper and Herskovitz [11]. K2 assumes that a priori all structures are equally likely and that cases in the data occur independently and are complete. Moreover, it assumes the presence of a node ordering and imposes a maximum number of parents for each node (inbound edges). When these conditions are satisfied, K2 starts with an empty ancestor set for each node and incrementally adds links that maximize the score of the resulting structure. The K2-CH score captures the probability of a candidate network structure B s given a set of data D. Formally the discrete probability P(Bs,D) is given by (2).
P ( Bs , D )
n
qi
i 1
j 1
P ( Bs )
(ri ( N ij
ri 1)! N ijk ! ri 1)! k 1
(2) Here qi denotes the number of possible different instances the parent of variable X i can take. ri is the number of values Xi has, Nijk denotes the number of cases in the dataset D in which Xi takes value k of its xi instance when its parent Pai has its jth value. Nij is the sum of all Nijk for all values xi can take. The algorithm stops when no more ancestor node additions improve the score. As in [8], we observe that although simple to implement and widely used, K2 is prone to local optima and may not find the globally best structure. Moreover, it relies on prior knowledge of the node ordering and, as a result, may return non-equivalent structures given different orderings. For the Gulf of Mexico dataset, several variables have large value sets, leading to significant computational cost. 3.2
K2GA and ChainGA
One search and score approach is to search the smaller space of variable node orderings using a metaheuristic and use a greedy algorithm to build solutions from each ordering. These solutions are then scored and the result passed back to the metaheuristic. This is more efficient than searching through the space of Bayesian
4 François A. Fournier Andrei Petrovski 1, Peter J. Barclay 2,
1,2,
Yanghui
Wu
1,
John
McCall*
1,
Network structures and it has the additional advantage of eliminating all cyclic structures and structures incompatible with the given ordering. An exhaustive search through all orderings for large problems would be intractable, of order O n! for a problem of size n [8]. Also, the greedy algorithms on selected orderings have nontrivial evaluation cost because of the computation involved in the K2-CH score. In [12], Larrañaga et al. propose a genetic algorithm to search the space of node orderings rather than the full space of structures. The fitness of each ordering is calculated by running the greedy search algorithm K2 on that ordering and returning the score of the network structure found. For the purpose of this paper, we denote Larrañaga’s algorithm by K2GA. Kabli et al. [8] propose an alternative way of reducing the computational cost related to this by using chain structures to evaluate orderings, replacing the K2 expensive evaluation in K2GA. ChainGA also searches the space of node orderings and assigns a value to each ordering based on the K2-CH score [21]. However, rather than using K2 to construct a network on each ordering, ChainGA evaluates a fixed chain structure. This low resolution evaluation phase terminates in a set of orderings that have the highest evaluated K2-CH scores found with this structure. ChainGA then enters a second phase where K2 is run on a percentage of the best orderings found to search for a good structure. 3.3
K2ACO and ChainACO
We use Ant Colony Optimisation [13] for Bayesian Networks structure learning based on two existing approaches - K2GA and ChainGA. In this paper, we name the new approaches as K2ACO and ChainACO respectively. The details are available from [3] and the code from the corresponding author. We use Ant Colony Optimisation to replace the GA search in K2GA. In K2ACO [3], the initial individuals in the population are randomly created node orderings which are then optimized by a colony of ants [13] in this space until a good ordering is found. During the Ant Colony Optimisation process, the fitness of each ordering is calculated by running the K2 search algorithm on it. Once the optimisation terminates, K2 is used to obtain the structure corresponding to best ordering found. The main idea of the ChainACO [3] approach comes from ChainGA. ChainACO also has two phases. In the first phase of ChainACO, we construct chains using ACO instead of GA. The second phase also applies K2 to the best orderings found and returns the best structure.
4
Data And Experiments
We base our experiment on previous work by Kabli et al. [9] and us [2], [3]. In addition to the number of variables, two other elements have a direct influence on the runtime length: the number of values in each variable and the size of the dataset. For this experiment, we used a subset of 2500 cases randomly selected from the dataset. Table 3 illustrates run times for 2500 cases. For 100 and 2500 cases, using K2GA, the run times were about 20 minutes and up to about 42 hours respectively.
Application of Evolutionary Algorithms to Learning Evolved Bayesian Network Models of Rig Operations in the Gulf of Mexico 5
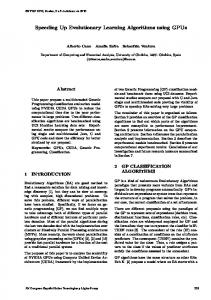
No preliminary run could be completed at present using all the 6670 cases available in the dataset. Using K2GA and ChainGA, we built our Bayesian network model that represents the dataset. We ran each algorithm 40 times over the Rig-Well dataset. The algorithms were run on 200 generations with a population size of 30 node orderings. Displacement Mutation and Cycle Crossover rates were 0.05 and 0.9 respectively. The selection used was a tournament selection of size 4. The best-scored resulting network was then chosen as the optimal model for the problem at hand. Similarly, we ran the K2ACO and ChainACO algorithms on our dataset. We used 8 ants and a maximum of 30 iterations. We compared the results using paired samples T-test to validate their significance. We recorded the optimal orderings found in each run, for each algorithm. We then counted the directed edges (relating to immediate node juxtapositions) appearing in the best ordering for each of the runs of each algorithm. We obtain a total of 160 orderings and hence 16 x 160 = 2560 edges. This enabled us to create greyscale representations of the edges occurrences. The vertical axis represents the first node; the horizontal axis represents the second node. The shade is darker proportional to the number of occurrences of a juxtaposition of nodes in the best orderings. This scale is absolute across all experiments.
5
Experimental Results
Figures 5 illustrates the Bayesian Network models learned from data using the algorithms. In this figure, as in [2] we can see some matching relationships formed in the models created by K2GA, ChainGA, K2ACO and ChainACO. We start by reviewing the performance of each of the algorithm, as measured by the K2-CH score. We assess the structure produced, looking at the variability between algorithms as they are assessed from an industry standpoint. We then review the edges frequency charts and explain observed differences between the algorithms. 5.1
Performance of the algorithms
The mean structure scores for each algorithm are presented in Table 1. We carried out significance tests on all pairs of means and the results are shown in Table 2. All differences are significant at or beyond a 99.95% confidence level. K2GA produces on average significantly better scoring structures than all of the other algorithms, on our dataset. The best-ever individual for K2GA scored -55534 compared to -60203 for ChainGA, -55781 for K2ACO and -55976 for ChainACO on our relative score scale (log of K2-CH score). Although significantly different, we can see that the results from K2ACO and ChainACO are much closer to K2GA than ChainGA, and they also benefit from a smaller standard deviation, showing their stability compared to ChainGA’s. This is consistent with observations in [2] and [8]. Table 2 confirms that K2GA, K2ACO and ChainACO are much closer to each other, in term of scoring, than ChainGA. The difference in the Mean Score of all pairs formed from those K2GA, K2ACO and ChainACO is less than 1000 when all pairs involving ChainGA
6 François A. Fournier Andrei Petrovski 1, Peter J. Barclay 2,
1,2,
Yanghui
Wu
1,
John
McCall*
1,
have a difference in Mean Score around 7000. It is to be noted that, as discussed in [2] and [8], the performance of ChainGA relating to K2GA appears to be highly problemdependent. We expect that the performance of K2ACO and ChainACO will also be problem-dependent. This is confirmed in our research published in [3]. Table 1: Means and Standard Deviations of best Individuals K2 scores K2GA ChainGA K2ACO K2GA
N 45 45 41 40
Mean Score -56197.44 -66434.34 -56265.43 -56556.41
Standard Deviation 205.2 1237.7 297.8 254.7
Table 2:Paired t-test of best Individuals K2 score across all runs Pair K2GA-ChainGA K2ACO-ChainACO K2GA-K2ACO ChainGA-ChainACO K2GA-ChainACO ChainGA-K2ACO
N 43 40 41 40 40 41
Paired Mean Score 7721.67929 308.39004 410.36738 -6885.66520 694.27588 -7220.71854
Paired Standard Deviation 954.36040 109.75538 298.73114 653.74622 234.91863 658.14672
P < 0.0005 < 0.0005 < 0.0005 < 0.0005 < 0.0005 < 0.0005
Mean runtimes for each algorithm are presented in Table 3. The ChainGA runtime is about a quarter of the K2GA runtime. K2ACO requires a significantly different but closer time to ChainGA. However, ChainACO completes with runtimes divided by a factor of 10 when compared to K2ACO or ChainGA and a by a factor of 40 when compared to K2GA. We therefore observe trade-offs between quality and computation time. Similar tradeoffs were observed in [2] on benchmark problems with known solutions. Table 3: Time Statistics per run over all runs K2GA ChainGA K2ACO ChainACO
Average 42h 28min 11h 1min 11h 50min 1h 39min
Standard Deviation 5h 9min 1h 11min 0h 41min 0h 5min
The score of ACO-based algorithms being much closer to K2GA than ChainGA, the loss of quality compared to the gain of time is statistically significant, but smaller than the loss of gain obtained by ChainGA. The long computation times required on this problem are in a large part due to the number of distinct values taken by many of the variables. Considering the vast amount of data available to us, K2GA might not be feasible in some cases for building larger models whereas ChainACO will allow us to build a model taking into account more of the data available. 5.2
Expert evaluation of the model
The best network structures produced by both K2GA and ChainGA have been presented to Rig and Wells data experts. We also compare the best network structure produced by K2ACO and ChainACO to the previous results [2]. All the algorithms discovered interactions between Rig Capabilities, Rig Types and Water Depth nodes. Experts highlighted that those are linked because specific rig types typically operate
Application of Evolutionary Algorithms to Learning Evolved Bayesian Network Models of Rig Operations in the Gulf of Mexico 7
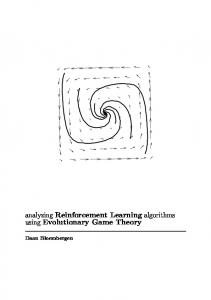
at a specific range of water depth. Another group of interactions is identifiable between Well Result, Well Status and Well Type. Only ChainACO omitted that link; however, as the search is non-deterministic, another run of ChainACO might find it. The Total Footage Drilled node also interacts with the node representing the Drilling Phase and the one representing the Footage Drilled per Day. Also, there is a correlation between the Water Depth and the Rig Type nodes. Those will be logically related because of the technical abilities of specific rigs to allow them to work at specified depth. The relationships between the Rig Type, the Rig Owner and the Rig Contractor are justified by the propensity of rig owner and contractors to work together repetitively and to be specialized in specific type of rigs built on the same plans. These specific interactions have consistently been identified by all of our algorithms. Our networks also identify a relationship between the Shore Base and the region where the drilling rig is operating. This is another logical geographical association showing the abilities of the algorithms to learn valid information and build Bayesian Networks from data. The partial separation between Well-related and Rig-related variables (With the exception of geographical and water depth variables) suggests a potential difficulty in using the model as a predictor for Rig variables using Well data or for Well variables using rig data. However, adding some key variables might solve that problem. Water depth, originating from the well database has emerged as a key variable that correlates with the rig capabilities and hence confirms its position as a significant variable in the choice of a rig. In the Gulf of Mexico, which typically has a uniform geological profile, this may be a reasonable assumption; however, this will have to be explored further and confirmed on worldwide data where a range of geological profiles and water depths will exist. Alternatively, there may be additional variables in the Wells and Rigs database that do correlate more closely. Also, we would expect geological and other variables to be relevant in more heterogeneous regions. ShoreBase WellResult
WellTotalDepthDays WellStatus
Region
K2GA ChainGA K2ACO ChainACO
WaterDepth RigType
WellDaysOnLocation WellFeetPerDay
WelLType WellTotalFootageDrilled
RigHarshEnvironmentCapable
RigOwner WellDeviated
WellPhase
RigContractor WellTotalVerticalDepth
Figure 1: superposition of networks
5.3
Analysis of the node juxtapositions
Figure 2 represents the occurrences of node juxtapositions as a greyscale grid. The vertical axis represents the first node; the horizontal axis represents the second node. The shade is darker proportionally to the number of occurrences of node juxtapositions within the best ordering of each run for all four algorithms. Precedence in an ordering means eligibility for membership of the parent set in a Bayesian Network structure. The Chain-based algorithms insert a directed edge between each ordered node and its immediate successor, i.e. from a node juxtaposition in the ordering. The K2-based algorithms, when considering a particular ordered node, will first try inserting an edge from its immediate predecessor and so have a bias in favour of such edges. Therefore consideration of which of these edges would result from the best orderings found in each run of each algorithm will give us statistics which describe the distribution of search outcomes for this problem.
Figure 2: Grayscale representation of node juxtapositions Figure 2 shows that K2GA explores the search space more broadly, without focusing on any specific link. This explains why it finds better solutions, but this is an expensive behaviour. ChainGA seems to focus the exploration on the most likely chains. However, its score is lower than that of other algorithms. K2ACO reduces even further the thoroughness of the search but performs better than ChainGA. ACObased algorithms, on this problem, seem to be more stable than ChainGA, and also
Application of Evolutionary Algorithms to Learning Evolved Bayesian Network Models of Rig Operations in the Gulf of Mexico 9
focus more quickly onto the most important part of the ordering, compared to GAbased algorithms. ChainACO clearly focuses on some important nodes, converging quickly and consistently towards a good solution. We are observing here the effects of two choices: K2/Chain and GA/ACO. Given an ordering, K2 is free to add any parent-child link in its process of constructing a full Bayesian Network for the purposes of evaluating the ordering. Chain on the other hand constructs precisely those parent-child links corresponding to nodes immediately juxtaposed in the ordering. Therefore for Chain the distribution of fitness (in phase 1) will be on those orderings that juxtapose strongly related variables, thus focusing the search on this restricted set of orderings. The K2 approach will distribute fitness across a wider set of orderings and so a wider set of variable juxtapositions will still allow variables to be related in the structures K2 builds. It is well-known that GA tends to be a noisier metaheuristic than ACO. Thus, we would expect that the GA algorithms would have a higher variance than the ACO ones and we would see a wider search distribution. This is indeed what we observe.
6
Conclusion
In this paper we explored and assessed methods for the discovery of Bayesian Network from rig operations data. We compared the use of K2GA, ChainGA, K2ACO and ChainACO — Genetic Algorithms and Ant Colony Optimisation algorithms based on node orderings with different approaches to evaluation. The algorithms found credible network structures, as assessed by industry experts. K2GA found significantly better structures than other algorithms tested on this dataset. Comparison of node juxtapositions in the best orderings showed that, for different reasons, the choice of Chain as a scoring mechanism or ACO as a metaheuristic, tended to focus the search on a narrower set of orderings. This proved beneficial for this problem but may not do so in general. However, the computational effort required for ChainACO is a fraction of the effort needed for K2GA. An additional potential improvement would be to use different scoring metrics such as Minimum Description Length (MDL) [14] [15] [16] as suggested by Kabli et al. [9] to score the node ordering before processing it with K2. Also, another way to increase performance while still saving on execution time would be to use a hybrid of the Chain and K2 approaches – use chain most of the time and occasionally spend on K2 to improve the quality of information driving the search. This research is an additional step toward a model that could be used to answer various queries relating to applications such as Drilling Rig Selection, Rig Performance forecasting and Rig Operation Scheduling [2]. The potential of Bayesian networks here is to support decision making in a more intuitive and objective way than current human processing methods. We plan to explore this by including more data in the model and to do a larger scale comparison across more variables. Covering larger geographical regions and ultimately worldwide data will in the future allow us to develop the model into a global application.
10 François A. Fournier Andrei Petrovski 1, Peter J. Barclay 2,
1,2,
Yanghui
Wu
1,
John
McCall*
1,
Acknowledgement The authors would like to thank Robert Steven for his help in providing expert evaluation of the models. This work was supported by ODS-Petrodata Ltd. (www.ods-petrodata.com) and the Technology Strategy Board under the KTP scheme (Award: KTP006922).
References [1] [2]
ODS-Petrodata Ltd., "http://rigpoint.ods-petrodata.com/," 2010. F.A. Fournier, J. Mccall, A. Petrovski, and P.J. Barclay, "Evolved Bayesian Network Models of Rig Operations in the Gulf of Mexico," Proceedings of the IEEE Congress on Evolutionary Computation (CEC 2010), 2010. [3] Y. Wu, J. Mccall, and D. Corne, "Two Novel Ant Colony Optimization Approaches for Bayesian Network Structure Learning," Proceedings of the IEEE Congress on Evolutionary Computation (CEC 2010), 2010. [4] C. Freudenrich, "How oil drilling works," howstuffworks.com, 2001, pp. 1-7. [5] J. Harris, "SELECTING AN OFFSHORE DRILLING RIG-THE COMPETITIVE TENDERING PROCESS," Offshore Europe, 1989. [6] P. Osmundsen, T. Sørenes, and A. Toft, "Drilling contracts and incentives," Energy Policy, vol. 36, 2008, p. 3128–3134. [7] D. Niedermayer, "An Introduction to Bayesian Networks and their Contemporary applications," 1998. [8] R. Kabli, F. Herrmann, and J. Mccall, "A Chain-Model Genetic Algorithm for Bayesian Network," Proceedings of the 9th annual conference on Genetic and evolutionary computation, ACM, 2007, pp. 1264-1271. [9] R. Kabli, J. McCall, F. Herrmann, and E. Ong, "Evolved bayesian networks as a versatile alternative to partin tables for prostate cancer management," Proceedings of the 10th annual conference on Genetic and evolutionary computation, ACM, 2008, p. 1547– 1554. [10] R.W. Robinson, "Counting unlabeled acyclic digraphs," Combinatorial mathematics V: proceedings of the Fifth Australian Conference, Melbourne: 1977, p. 28. [11] G.F. Cooper and E. Herskovits, "A Bayesian method for the induction of probabilistic networks from data," Machine Learning, vol. 9, 1992, pp. 309-347. [12] P. Larrañaga, C.M. Kuijpers, R.H. Murga, and Y. Yurramendi, "Learning Bayesian network structures by searching for the bestordering with genetic algorithms," IEEE Transactions on Systems, Man and Cybernetics, Part A, vol. 26, 1996, pp. 487-493. [13] M. Dorigo, M. Birattari, and T. Stutzle, "Ant colony optimization," IEEE Computational Intelligence Magazine, 2006, pp. 28-39. [14] M.L. Wong, S.Y. Lee, and K.S. Leung, "A Hybrid Data Mining Approach to Discover Bayesian Networks Using Evolutionary Programming," Proceedings of the Genetic and Evolutionary Computation Conference, 2002, pp. 214-222. [15] S. van Dijk, D. Thierens, and L. van Der Gaag, "Building a GA from Design Principles for Learning Bayesian Networks," Genetic and Evolutionary Computation — GECCO 2003, Berlin, Heidelberg: Springer Berlin Heidelberg, 2003, p. 198. [16] R.R. Bouckaert, "Probabilistic network construction using the minimum description length principle," Lecture notes in computer science, 1993.