IEEE - International Conference on Research and Development Prospects on Engineering and Technology (ICRDPET 2013) March 29,30 - 2013 Vol.4
Application of FURIA in the Classification of Cardiotocograph 1
S. Das 2K. Roy & 3C.K Saha Department of Computer Application Narula Institute of Technology , Kolkata – 700109, India 2 Department of Computer Science West Bengal State University Kolkata – 700126, India 3 Biraj Mohini Matrisadan &Hospital Barrackpore, Kolkata – 700122, India 1 Email:
[email protected],
[email protected] &
[email protected]
1
Abstract— Cardiotocograph or CTG stands for simultaneous and continuous recording of fetal heart rate (FHR) and uterine contraction(-toco). Since it is non-invasive and cost efficient, it is used extensively as a diagnostic tool for evaluating fetal condition. Its introduction to clinical practice reduced the occurrence of fetal morbidity such as cerebral palsy as well as fetal mortality. Doctors normally visually analyze and evaluate the CTG signal. This usually results in large inter and intra-observer variability in its interpretation. This has led to the development of various methodologies based on mathematical and computerized analysis program for interpretation and classification of CTG signal. However, the predictive capacities of these systems lack accuracy. In this paper we proposed a CTG data classification system using a supervised fuzzy classifier Fuzzy Unordered Rule Induction Algorithm (FURIA). Performance of the algorithm was evaluated using Precision, Recall and FScore as metric and obtained encouraging results.
Keywords— Cardiotocograph(CTG);Fetal Heart Rate (FHR); Uterine Contraction (UC); FURIA;
I. INTRODUCTION Interpretation of CTG data is a complicated task requiring high level of medical expertise [1]. In the manual interpretation of the CTG data, the doctor acts as an interface between data and the knowledge. This sometime give rise to inter and intra observer variability, inaccurate interpretation and hence wrong diagnosis, which may lead to unnecessary C-section, fetal compromise and even fetal demise. By using machine intelligence the doctor can be assisted in more accurate decision making. Medical data mining has great potential for discovering substantial implicit knowledge hidden in the CTG data which cannot be discovered with conventional methods of analysis straight away[16,9]. Classification is the most popular procedure for data mining. It is used to predict membership for the instances of data. Classification is the task of generalizing the identified structure to apply to new data. It involves discovering the rules that partition the data into disjoint groups[14]. The proposed method uses data mining techniques for evaluating and classifying CTG trace so that human error that arises due to manual interpretation can be minimized. We are aiming to develop a system that will provide an interpretation which can be of help to the physicians as well as to a non-medical person. This is
120
necessary in situation where a medical expert is not readily available. We have used Waikato Environment for Knowledge Analysis (WEKA), which is a popular suite of machine learning software. Rest of the paper is organized as follows. Sec II describes some of previous works and in Sec. III challenges in CTG interpretation is presented. Description of CTG data is given in Sec. IV. The methodology is described in Sec. V followed by results and discussion in Sec. VI. The final conclusion is provided in Sec. VII. A. Cardiotocograph The aim of fetal heart rate monitoring is to identify the earliest stages of fetal hypoxia, so that appropriate and timely intervention can be made to prevent fetal asphyxia, which can result from sustained and severe hypoxia. The machine used to perform CTG is called Cardiotocograph or Electronic Fetal Monitor (EFM). It is used to continuously record and monitor FHR and UC during ante-partum (3rd trimester of pregnancy) and intra-partum fetal surveillance. Changes in the fetal heart rate and their timing relative to the mother’s uterine contractions provide an indication of fetal distress and are used to identify those cases which require clinical interventions [12]. Key features of FHR are: Baseline, Variability, Acceleration, Deceleration and key feature of toco is Uterine Contraction. Of the four features of FHR the most fundamental is the baseline, as other features are determined by it. The baseline of FHR is the resting level of the fetal heart rate. Accelerations of FHR is a temporary increases of fetal heart rate at least 15 bpm above the baseline and lasting for 15 secs or longer. This occurs in response to fetal movements and is a sign of fetal central nervous system alertness and fetal well-being. The temporary decreases of FHR at least 15 bpm below the baseline and lasting for 15 secs or longer is called deceleration. It usually reflects such risky events as compression of the umbilical cord. The baseline of FHR is determined by approximating the mean FHR rounded to increments of 5 beats per minute (bpm) during a 10-minute window, excluding accelerations and decelerations and periods of marked FHR variability (> 25 bpm). There must be at least 2 minutes of identifiable baseline segments (not necessarily contiguous) in any 10-minute window, or the baseline for that period is indeterminate [5].
ISBN: 978-1-4673-4948-2 © 2013 IEEE
Application of FURIA in the Classification of Cardiotocograph
Abnormal baseline is termed bradycardia when the baseline FHR is ≤110 bpm; it is termed tachycardia when the baseline FHR is ≥160 bpm. Baseline FHR variability is determined in a 10minute window, excluding accelerations and decelerations. It is defined as fluctuations in the baseline FHR that are irregular in amplitude and frequency. The fluctuations are visually measured as the amplitude of the peak-to-trough in bpm [5]. Uterine contractions are quantified as the number of contractions present in a 10-minute window, averaged over 30 minutes [5]. The 3-tier classification of CTG trace are as follows: A CTG trace is said to be Normal if all the four features of FHR fall into reassuring category. A CTG trace is said to be Suspicious if one of the features of FHR fall into non-reassuring category, while the others fall into reassuring category. A CTG trace is said to be Pathological if two or more features fall into non-reassuring category or more than one feature fall into abnormal category. The description of 10-tier classification of CTG trace are : Marked changes occur to the neurological states of the fetus during the third trimester of the pregnancy. These are Calm Sleep, REM Sleep, Calm Vigilance and Active Vigilance. FHR in REM state is characterized by increased variability and frequent acceleration. During calm sleep fetal heart rate decreases and so does heart rate variability. Thus, calm sleep and calm vigilance display much smaller number of accelerations than REM sleep and active vigilance [8]. As the fetus develops the heart rate decreases in response to parasympathetic (Vagal Stimulation) nervous system maturation and variability becomes more prominent. Flat Sinusoidal Pattern is recognized by absent variability and absent acceleration and is usually a sign of severe fetal anemia, fetal cardiac anomalies, fetal hypoxia/asphyxia etc. Largely Decelerative Pattern usually indicates prolonged hypoxia, which is ominous. Stress Situation of the fetus is identified by recurrent late deceleration with at least 50% of contractions. Shift Patterns such as Bradycardia (FHR < 110 bpm) may indicate fetal distress and Tachycardia (FHR > 160 bpm) may indicate increased fetal activity but doesn’t indicate fetal jeopardy.
Marques de Sa et. al. estimated and classified the baseline using artificial neural network after elimination of FHR samples corresponding to fetal movement instants, uterine contraction periods and unstable regions and spikes [15]. Jacob et. al used data mining techniques to cluster CTG data set, detect outliers and finally classify them. They used Random Tree and Quinlan’s C4.5 algorithm [13]. Sundar et. al classified the CTG data using supervised Artificial Neural Network (ANN) which classified the CTG data based on the training data [3]. Chen et. al developed a LabVIEW based FHR & UC pattern analysis software that is good for home use. They used median filter and peak/valley detection method for processing the CTG signal [4]. Though many researches had been carried out in the last four decades toward the automation of the analysis of CTG signal and hence to ensure accurate diagnosis, none of them had been accepted worldwide for everyday use.
III.
CHALLENGES IN CTG INTERPRETATION
CTG interpretation suffers from high degree of inter and intra observer variability which can lead to misdiagnosis. Definition of the different features of CTG contain inherent imprecision and uncertainties, which when incorporated in a computerized model produces incorrect classification of CTG data. Thus, the need of the hour is an automation process that will deal with the twin problems of feature extraction and classification i.e. FHR pattern recognition and interpretation of pattern in order to get a final diagnosis. Thus dealing with uncertainties and imprecision is the biggest challenge in recognizing the patterns in CTG data. In the proposed work, we intended to provide a solution using fuzzy rule based technique that will provide a 3-tier classification of the CTG data based on fetal state: Normal (N), Suspicious (S) and Pathological (P). We have also provided a 10-tier classification of the CTG data based on morphological pattern. Fuzzy Unordered Rule Induction Algorithm (FURIA), which is a fuzzy-rule-based classifier, is used to obtain fuzzy rules. FURIA learns fuzzy rules instead of conventional rules and unordered rule sets instead of rule lists. Furthermore to deal with uncovered examples, it makes use of an efficient rule stretching scheme [7].
II. PREVIOUS WORKS Doctors usually visually interpret a CTG trace. This has given rise to inter and intra observer variation in evaluation of CTG trace. To overcome this problem in interpreting the CTG trace, many efforts had been made in last three decades towards the automation of the interpretation of the CTG signals [12]. These range from simple feature extraction using conventional programming techniques to complex systems capable of performing various diagnostic tasks [2].
IV.
DATA
A.
Data We made use of CTG dataset from UCI Irvine machine learning repository, which contains FHR and morphological pattern records for 2126 data with 21 attributes and 2 class attributes. The CTGs were classified by three expert obstetricians and a consensus classification label assigned to each of them. Classification was both with respect to a
ISBN: 978-1-4673-4948-2 © 2013 IEEE
121
IEEE - International Conference on Research and Development Prospects on Engineering and Technology (ICRDPET 2013) March 29,30 - 2013 Vol.4
morphologic pattern (A, B, C. ...) and to a fetal state (N, S, and P) [17]. TABLE I. CLASSIFICATION OF CTG DATA BASED ON FETAL STATE
Class Value N S P TABLE II.
Class Value A B C D SH AD DE LD FS SUSP
Class Description Normal Suspicious Pathological
CLASSIFICATION OF CTG DATA BASED ON MORPHOLOGY PATTERN
Class Description Calm Sleep Rapid Eye Movement (REM)Sleep Calm Vigilance Active Vigilance Shift Pattern (A or Suspect within shifts) Accelerative / Declarative Pattern (stress situation) Declarative Pattern (vagal stimulation) Largely Declarative Pattern Flat-sinusoidal Pattern (pathological state) Suspect Pattern
B. Attributes The attributes provided by UCI Irvine machine learning repository for CTG is as follows: 1) LB - FHR baseline (beats per minute) 2) AC - # of accelerations per second 3) FM - # of fetal movements per second 4) UC - # of uterine contractions per second 5) DL - # of light decelerations per second 6) DS - # of severe decelerations per second 7) DP - # of prolonged decelerations per second 8) ASTV - percentage of time with abnormal short term variability 9) MSTV - mean value of short term variability 10) ALTV - percentage of time with abnormal long term variability 11) MLTV - mean value of long term variability 12) Width - width of FHR histogram 13) Min - minimum of FHR histogram 14) Max - Maximum of FHR histogram 15) Nmax - # of histogram peaks 16) Nzeros - # of histogram zeros 17) Mode - histogram mode 18) Mean - histogram mean 19) Median - histogram median 20) Variance - histogram variance 21) Tendency - histogram tendency 22) CLASS - FHR pattern class code (1 to 10) 23) NSP - fetal state class code (Normal=1; Suspect=2; Pathologic=3) We have used these attribute as features after normalizing the same via WEKA. Preprocessing of the dataset had been performed by applying an attribute selection algorithm on it. Next, missing values record were identified and were deleted from the dataset 122
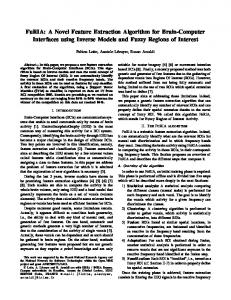
C. Data Space Visualization The image in Fig. 1 shows the projection of the CTG data in 3D data space. We used the three classifications of CTG data for the visualization. Red, Blue and Green dots represent Normal, Suspicious and Pathological CTG data respectively. It is obvious from the figure that the three classes of data are highly overlapped. This inherent closeness among the data has encouraged us to select fuzzy rule based classifier like FURIA, which is close to human interpretation system in evaluation of the CTG data.
• Normal • Suspicious • Pathologic Fig. 1.Projection of CTG Data in 3D Space
IV. METHODOLOGY A.
WEKA Waikato Environment for Knowledge Analysis (WEKA) is a collection of machine learning software written in Java and contains a set of visualization tools and algorithms for data analysis and predictive modeling along with GUI for easy access to these functionalities [10]. WEKA has some popular classifiers such as SVM, MLP, KNN etc. The algorithms can be called from one’s own Java code or using weka.jar file of the package. WEKA contains tools for data preprocessing, classification, clustering, attribute selection and data visualization. It is also well suited for developing new machine learning schemes. In our work we have used FURIA classifier for our work and Multilayer Perceptron of WEKA and compared our work with Sundar et al [3]. B. FURIA Dealing with uncertainties is a common problem in medical diagnosis and the use of fuzzy set theory has played a major role in formalizing uncertainties in medical diagnosis and prognosis. The vital problems in medical diagnosis and prognosis are: a) limited observation and subjectivity of the specialists.
ISBN: 978-1-4673-4948-2 © 2013 IEEE
Application of FURIA in the Classification of Cardiotocograph
b)
uncertainties and incompleteness in the medical knowledge. c) poor time effect in diagnosis [11]. In CTG analysis systems each feature is identified and then classified using rules derived from the guidelines given by NICE / FIGO. Crisp rule is not able to capture the inherent vagueness present in the interpretation of the CTG data. Also, slight changes in the CTG features can produce different classification, e.g. Baseline value of 90 – 109 bpm is termed ―slight bradycardia‖, whereas, 110 – 160 bpm is termed as ―normal‖. Such an abrupt change in classification doesn’t represent clinical reality [6]. We are thus proposing a computational intelligent model based on fuzzy logic techniques to capture the imprecise information and uncertainties present in the feature space and classification space of the CTG data and classify them into 3 different classes: Normal (no emergency clinical care is needed), Suspicious (consult physician and carry out further investigation) and Pathological (urgent medical attention is needed). The experience of medical experts can be represented as functional knowledge in terms of heuristic rules. At the feature level input data can be represented as an array of membership values denoting the degree of possession of certain attributes. At the classification level, fuzzy is able to represent category membership of objects. Thus, fuzzy classifiers such as FURIA (Fuzzy Unordered Rule Induction Algorithm) is well equipped in handling the uncertainties of CTG data and perform the classifications. FURIA is an extension of state-of-the-art rule learner RIPPER (Repeated Incremental Pruning to Produce Error Reduction). FURIA is capable of dealing with datasets with large number of features. A list of rules favors a default class, which may induce a bias. Hence, it learns fuzzy rules instead of conventional rules and rule set instead of rule lists [4]. A set of rules is generated for each class using one-vsrest strategy. Thus, each class is separated from all the other classes. As a result, there is no default rule and the order of the rule is not relevant. V.
RESULTS AND DISCUSSION
A. Metrics Used For Evaluation PRECISION In a classification task, the precision for a class is the number of true positives (tp) (i.e. the number of items correctly labeled as belonging to the positive class) divided by the total number of elements labeled as belonging to the positive class (i.e. the sum of true positives and false positives (fp), which are items incorrectly labeled as belonging to the class).
tp P re c is io n tp fp RECALL Recall is defined as the number of true positives divided by the total number of elements that actually belong to the positive class (i.e. the sum of true positives and false negatives (fn), which are items
which were not labeled as belonging to the positive class but should have been).
tp R ec a ll tpfn F-SCORE It is a measure that combines precision and recall is the harmonic mean of precision and recall.
p r e c i s i o n r e c a l l F S c o r e 2 p r e c i s i o n r e c a l l
B.
Results Using five fold cross validation with FURIA we have obtained an accuracy of 94.59% for the classification of the CTG data with respect to fetal state. Total number of rules generated was 39. We also obtained an accuracy of 87.67% for classification of the CTG data based on morphological pattern. Result of the classification of CTG data by FURIA with respect to fetal state is shown in Table III. The confusion matrix given in Table IV conveys information about the actual and predicted classification done by FURIA for FHR data. Values in Bold indicate the data that had been correctly classified. Table V gives the classification of CTG data based on Morphological pattern. TABLE III.
Metric
PERFORMANCE OF FURIA CLASSIFIER IN CLASSIFYING FHR DATA
Normal Suspicious Pathological Weighted Average
Precision 0.956
0.885
0.939
0.945
0.903
0.780
0.875
0.884
F-Score 0.929
0.829
0.906
0.913
Recall
TABLE IV. CONFUSION MATRIX FOR FHR DATA CLASSIFICATION USING FURIA
Classification Normal
Suspicious Pathological
Normal
1627
21
7
Suspicious
62
230
3
Pathological
13
9
154
VII.
CONCLUSION
From the result it can be seen that FURIA is capable classifying complex real world medical data like CTG data. This is because the uncertainty in the classification of CTG data arises from the inherent fuzziness in the definition of different attributes. Concept of fuzzy set is naturally capable of handling the uncertainties and incompleteness in the feature space and classification space of the CTG. This is evident in the comparison of our work with that of Sundar et al [3]. With ANN based classifier the weighted average of the precision obtained by Sundar et al [3] is 0.914 while weighted average of the precision with our algorithm is 0.945. We have obtained higher recognition accuracy for suspicious and pathological cases which are vital points of concern from clinical pint of view. Again when
ISBN: 978-1-4673-4948-2 © 2013 IEEE
123
IEEE - International Conference on Research and Development Prospects on Engineering and Technology (ICRDPET 2013) March 29,30 - 2013 Vol.4
compared from the point of computational time, it is found that FURIA took 2.26 Sec compared to 11.16 sec by Multilayer Perceptron ANN (when both of them are evaluated by WEKA on Intel Core 2 Duo CPU E7500, 2.93GHz with Ubuntu 12.04 OS with 5 fold cross validation). Though the Precision of Sundar et. al [3] is higher than the proposed approach the Precision for Suspicious data is quite high in our approach and hence the weighted average of the same. We can conclude that FURIA can be used as an effective tool for classification of complex data. Fuzzy classifier is capable of including the linguistic knowledge in a systematic manner, whereas, in ANN, the non-transparent network design prevents inclusion of linguistic knowledge. There are certain weaknesses in our system though. It can be seen from the confusion matrix that about 7.4% of the pathological cases had been identified as Normal, which is a great point of concern. We are investigating ways to minimize the same. We are also working on improving the time required by our system to classify the data.
ACKNOWLEDGMENT The authors would like to thank the management and stuff of Biraj Mohini Matrisadan and Hospital for their kind cooperation and letting us use their facility for our research purpose whenever the need arises. TABLE V. CLASSIFICATION OF CTG DATA BASED ON MORPHOLOGICAL PATTERN USING FURIA
Metric A B C D SH AD DE LD FS SUSP Weighted Average
Precision 0.870 0.948 0.623 0.679 0.417 0.889 0.944 0.925 0.768 0.883 0.875
Recall 0.827 0.899 0.660 0.932 0.750 0.931 0.875 0.908 0.930 0.841 0.874
F-Score 0.848 0.923 0.641 0.786 0.536 0.909 0.908 0.917 0.841 0.861 0.871
[6]
[7]
[8]
[9]
[10]
[11]
[12]
[13]
[14]
[15]
[16]
[17]
J. F Skinner, J. M Garibaldi and E. C Ifeachor, ― A Fuzzy System for Fetal Heart Rate Assessment‖, Proceedings of the 6th Fuzzy Days Conference, Vol. 1625, 1999, pp. 20 – 29. J. Hühn and E. Hüllermeier, ―An Analysis of the FURIA Algorithm For Fuzzy Rule Induction‖, Studies in Computational Intelligence 262, 2010, pp. 321 – 344. J.P.M de Sa, ―Characterization of Fetal Heart Rate Using Approximate Entropy‖, Computers in Cardiology, Vol. 32, 2005, pp. 671 – 673. J. Soni, U. Ansari, D. Sharma and S. Soni, ―Predictive Data Mining for Medical Diagnosis: An Overview of Heart Disease Prediction‖ International Journal of Computer Application, Vol. 17, 2011, pp. 43 – 48. R. R. Bouckaert, E. Frank, M. A. Hall, G. Holmes, B. Pfahringer, P. Reutemann and I. H. Witten, ―WEKA— Experiences with a Java Open-Source Project‖, Journal of Machine Learning Research, Vol. 11, 2010, pp. 2533-2541. S. Ara Begum, O. Mema Devi, ―Fuzzy Algorithm for Pattern Recognition in Medical Diagnosis‖, Assam University Journal of Science and Technology: Physical Sciences and Technology, Vol. 7, 2011, pp. 1 – 12. S. Das, K. Roy and C. K. Saha, ―A Novel Approach for Extraction and Analysis of Variability of Baseline‖, In proc. of International Conference on Recent Trends in Information Systems, 2011, pp. 336 – 339. S. Jacob and R.G Ramani, ―Evolving Efficient Classification Rules from Cardiotocography Data Through Data Mining Methods and Techniques‖, European Journal of Scientific Research, Vol. 78, 2012, pp. 468 – 470. S. Vijayarani, M. Divya, ―An Efficient Algorithm for Generating Classification Rules‖, International Journal of Computer Science and Technology, Vol. 2, 2011, pp. 512 – 515,. T. Kupka, J. Wrobel and J. Jezewski, ―Evaluation of Fetal Heart Rate Baseline Estimation Method Using Testing Signals Based on a Statistical Model‖, In Proc. of 28th IEEE EMBS Annual International Conference, 2006. W. Stühlinger, O. Hogl, H. Stoyan and M. Müller, ―Intelligent Data Mining for Medical Quality Management‖, In proc. Fifth Workshop Intelligent Data Analysis in Medicine and Pharmacology, 2000, pp. 56 – 57 . http://archive.ics.uci.edu/ml/datasets/Cardiotocography#
REFERENCES [1] [2]
[3]
[4]
[5]
124
―Guidelines for the Use of Fetal Monitoring‖, International Journal of Gynaecology and Obstetrics,Vol. 9, 1986, pp 1 – 9 .B. Krupa, A Mohd and A Zahedi, ―Computerized Fetal Heart Rate Baseline Estimation Number and Continuity of Occurrences‖, IFMBE Proc. 4th Kuala Lumpur Int. Conf Biomed Eng., Vol 21,2008, pp.162 – 165. C. Sundar, M. Chitradevi and G. Geetharamani, ―Classification of Cardiotogram Data Using Neural Network Based Machine Learning Technique‖, International Journla of Computer Application, Vol. 47, 2012, pp. 19 – 25. C. Y Chen, J. C Chen, C. Yu and C. W Lin, ―A Comparative Study of a New Cardiotocography Analysis Program‖, Conf Proc IEEE Eng Med Biol Soc, 2009, pp. 2567 – 2570. G. A. Macones, G. D. V. Hankins, C. Y. Spong, J. Hauth and T. Moore, ―The 2008 National Institute of Child Health and Human Development Workshop Report on Electronic Fetal Monitoring: Update on Definitions, Interpretation, and Research Guidelines‖, American College of Obstetricians & Gynecologists, Vol. 112, 2008, pp. 661 – 666.
ISBN: 978-1-4673-4948-2 © 2013 IEEE