Application of Genetic Algorithms in production line classification systems Cristina Cristalli
Chaitanya Adapa
Dariusz Grabowski
AEA srl Via Fiume 16 60030 Angeli di Rosola, Italy tel.+39 0731 8161 fax+39 0731 814700
[email protected]
Dept. of Electrical Engineering Indian Institute of Technology Hauzkhas New Delhi, 110016 India
[email protected]
Dept. of Electrical Engineering Silesian University of Technology ul. Akademicka 10 44-100 Gliwice Poland
[email protected]
Abstract— This work aims at simplifying 'optimal feature set selection' step in the design of quality control systems used in production line processes by means of genetic algorithms 1 the contribution of the 1st term increases and for the upper extreme value the fitness function is nothing but the percentage of correct classification achieved by the chromosome, the effect of the number of features is completely ignored. But such a setting is undesirable, as the algorithm will solely work towards acquiring maximum accuracy rather than working towards maximum accuracy with minimal number of features used. Similar analysis can be applied when a approaches towards its lower bound.
2.3 Assigning the fitness
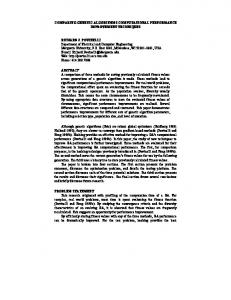
The graph reported in Fig.l shows the variation of the second term of Eq. 1 with A and F. It can be seen that as F increases, the value of the second term inevitably decreases, but the magnitude of this decrease can be controlled by changing X. Increasing the value of A will decrease the steepness of the fall. The value of X can be decreased to increase the severity of punishment a chromosome receives for using too many features.
The fitness has been assigned in such a way that chromosomes giving high classification accuracy while using few features are encouraged to multiply. Eq. 1 gives the exact mathematical function used to generate fitness: (1) where: c] - fraction of correctly classified samples in set 2 when trained by setl, C2 - fraction of correctly classified samples in set 1 when trained by set2, a, A - user control parameters, F - the number of features used by the chromosome, / - the calculated fitness of the chromosome.
The fitness function is an 'ex' weighted sum of two terms corresponding to the average classification accuracy and number of features used. Here, a allows the user to control the contribution of the two terms, while X gives control
Fig. 1: Variation of the second term in the fitness function with X and number of features used F.
84
2.4 Methods of crossover and mutation
chromosome has the freedom to suppress the use of one feature relative to the other. It can be achieved by fine tuning of the thresholds over a few generations. At each node of the decision tree, a feature to be used is selected on the basis of its entropy. The one with minimum entropy is chosen. Entropy depends upon the distribution of samples in the three regions, which in turn depends upon the positions of the thresholds. Fig. 2 and Fig. 3 further elucidate this point. They show the hypothetical sample distribution (a histogram) for a particular feature with two possible selections of thresholds. The thresholds shown in Fig. 2 decrease the entropy of this feature while those in Fig. 3 increase the entropy hence affecting the chances of this feature's being selected during the construction of the tree. Consequently in an intrinsic way this type of encoding selects feature subsets.
One of the normal methods of crossover (uniform, 1point, 2-point) [10], [11] has been used for binary encoded chromosomes. For the decision tree encoding, the real chromosomes (which carry the threshold levels of each feature) are encoded into binary and after that one of the above mentioned crossovers is performed. These crossover methods have been compared against another one, which weighs the two parent thresholds with their fitness to produce the corresponding threshold of the child (Eq. 2):
Jplfl+tplfl
''
(2)
fl+h
where: tQ - threshold of the child,
There also might be situations when division of the feature axis into two regions instead of three might be more beneficial. Even though two thresholds have been used the algorithm adjusts itself to identify the number of regions required for the best results and sets the thresholds to divide the feature axis into as many regions. How the algorithm manages to do this is explained in the next section.
tcl -threshold of parent 1, tc2 -threshold of parent 2, ft - fitness of parent 1, f2 -fitness of parent 2. This method of crossover ensures that the threshold of the fitter parent is more dominant during reproduction. This domination oriented crossover consistently gave better results than the boolean crossovers and also saved processing time involved in the boolean encoding. For mutation the method adopted has been the standard bit flip. Even the real chromosomes have been boolean encoded before mutation.
The decision tree classifier gave very satisfactory results not just in classification accuracy and choosing the number of features, but also in setting the thresholds. No. of samples
3 Decision Tree Classifier The decision tree uses entropy as an information measure during the construction of the network [1], [9]. A classifier best fits the data available when it uses the minimum number of features possible. The decision tree classifier succeeds in doing so to a certain extent by using the above approach. However it does not consider the non- linear interaction of given set of features. For example if feature set 'A' is derived from a master set 'Z', then it is possible that the decision tree constructed over 'A' might use lesser number of features than 'Z'. This fact encourages exploring methods that also consider the non-linear interactions of feature sets. One such method is proposed in [6]. However this method requires that the features pertaining to a!l the samples are discrete, whereas, in this application the features are spread over a continuous interval. To make a feature discrete two thresholds have been assigned which would effectively divide that feature into three regions.
Threshold
Threshold
Fig. 2: Distribution of samples for a feature - small entropy case-
No, of samples
For this application chromosomes have been encoded in such a way that they represent a feature subset. A chromosome has been constructed in order to carry thresholds of all the features. Note that even though all the thresholds of all the features are being carried, the
Threshold
Threshold
'
Featured
Fig. 3: Distribution of samples for a feature -high entropy case.
85
4 Performance test and result analysis
Progress of the algorithm J .".
The proposed system has been given the task of finding the optimum set of features to be extracted from vibration signals acquired from small electrical motors. The final aim is the automatic classification of the motors into two classes, 'Good' and 'Faulty' with respect to mechanical performances. In fact, a variety of manufacturing defects is normally shown by increased noise and vibration of the system under test, which is operated according to a predefined test cycle, therefore vibration signals can be used for quality control on production lines [2], [12]. In most cases, if 100% on-line quality control of electric motors is performed, an operator that listens to the motor and audibly detects the existence of any malfunctions carries it out. The operator works in an acoustic isolated cabin and the motor is driven during a specific test cycle. The capacity of the operator to discriminate the different types of defects cannot be easily surpassed, however, one of the disadvantages lies in the lack of reproducibility due to the subjective component of the listener whose attention can vary along the working period. This is the reason why an automatic system based on the measurement of vibrations • that guarantees the control of 100% of production is more and more required and fully meets the requirements of contemporary automated assembly lines.
> 88-
Ill
•
40t 3020 > r .10- !
.
i J
SB •
50-
'
K
-
JH
-
*
_ '
n200!
' •>
•
,
-
--
•
- r • " 6001 -
S001
- No. of Iterations"
• Classification accuracy of thebest chromosome ' Fercenta