ISPRS Int. J. Geo-Inf. 2015, 4, 1265-1289; doi:10.3390/ijgi4031265 OPENACCESS
ISPRS International Journal of
Geo-Information ISSN 2220-9964 www.mdpi.com/journal/ijgi/ Article
Application of Geo-Information Techniques in Land Use and Land Cover Change Analysis in a Peri-Urban District of Ghana Divine Odame Appiah 1,*, Dietrich Schröder 2, Eric Kwabena Forkuo 3 and John Tiah Bugri 4 1
2
3
4
Department of Geography and Rural Development, Kwame Nkrumah University of Science and Technology, Kumasi, Ghana Department of Photogrammetry and Geoinformatics, Stuttgart University of Applied Sciences, 70013 Stuttgart, Germany; E-Mail:
[email protected] Department of Geomatic Engineering, Kwame Nkrumah University of Science and Technology, Kumasi, Ghana; E-Mail:
[email protected] Department of Land Economy, Kwame Nkrumah University of Science and Technology, Kumasi, Ghana; E-Mail:
[email protected]
* Author to whom correspondence should be addressed; E-Mail:
[email protected]; Tel.: +233-267-979-012. Academic Editors: Maurizio Pollino, Giuseppe Borruso and Wolfgang Kainz Received: 16 December 2014 / Accepted: 20 July 2015 / Published: 28 July 2015
Abstract: Using Satellite Remote Sensing and Geographic Information System, this paper analyzes the land use and land cover change dynamics in the Bosomtwe District of Ghana, for 1986, 2010 thematic mapper and enhanced thematic Mapper+ (TM/ETM+) images, and 2014 Landsat 8 Operational Land Imager and Thermal Infrared Sensor (OLI/TIS) image. The three images were geo-referenced and processed for classification, using the maximum likelihood classifier algorithm. A Jeffries-Matusita’s separability check was used in confirming the degree of spectral separation acceptability of the bands used for each of the land use and land cover classes. The best Kappa hat statistic of classification accuracy was 83%. Land Use and Land Cover (LULC) transition analysis in Environmental Systems Research Institute ESRI’s ArcMap was performed. The results of the classification over the three periods showed that built up, bare land and concrete surfaces increased from 1201 in 1986 to 5454 ha in 2010. Dense forest decreased by 2253 ha over the same period and increased by 873 ha by the 2014. Low forest also decreased by 1043 ha in 2010; however, it increased by 13% in 2014. Our findings showed some of the important changes in the land use
ISPRS Int. J. Geo-Inf. 2015, 4
1266
and land cover patterns in the District. After the urbanization process, coupled with farmland abandonment, between 1986 and 2010, substantial increments in urban land and clear increments in farmland coverage between 1986 and 2014were found to be the reason for vegetation cover decreases. This suggests that major changes in the socio-ecological driving forces affecting landscape dynamics have occurred in the last few decades. Keywords: land use/land cover; change detection; accuracy assessment; separability; GIS; peri-urban; Bosomtwe; Ghana
1. Introduction The dynamics of human land use and land cover (LULC) changes have implications for land use and environmental management and planning in peri-urban areas [1–4]. In view of this, modelling the human land uses and land cover (LULC) change is essential for the assessment of consequent social and environmental impacts of human activities [5]. Globally, quite a substantial amount of research has been done on the use of remote sensing and GIS to model the land use and cover dynamics [6–9] and [10]. In peri-urban areas where demand for land meant for various applications persist, it is imperative to assess the degree of LULC changes. This is so, in order to identify the trends and to ascertain the extent of land use types trade-off among the different LULC applications [11]. Considering the fact that the peri-urban areas are the melting pots of diverse socio-economic undertakings [12], it is imperative to monitor the trends of land use and cover changes to ensure that these are in sync with the available land space and the rate of population growth over time. Theorizing the construction of land surface change dynamics, Prenzel [13], examined configuration of the earth surface, in terms of the spatial and structural landscape dynamics over time. In terms of the spatial and structural landscape dynamics, the landscape configuration dynamics should be seen as structural-temporal occurrence changing over time [7,13,14]. In order to categorically and quantitatively analyze these LULC dynamics, remote sensing applications are imperative. This is apparently because the quantitative changes are amenable to remote sensing and geo-information modelling. Furthermore, Nagarajan and Poongothai [15] have indicated that human interference and interactions with the land surface result in a variety of outcomes. These varieties of outcomes constitute the LULC change patterns from a complex system [16]. In this regard, considering the rapid changes in the land use and cover driven by population increases and expended demand for land. It is crucial that accurate and up-to-date land use and cover change information is produced for both human society as well as environmental planning purposes [17]. According to Addo [12], the use of remote sensing and GIS tools for the mapping of peri-LULC changes have revealed intriguing results and offered some critical policy recommendations for sustainable land management. In the same vein, Weerakoon [18] studying the suitability of urban agriculture, has also opined that it is extremely difficult to thoroughly appreciate the levels of land use and cover change decision making, from only descriptive perspectives, without quantification. This assertion is in partial support of the submission made by Rounsevell et al. [19] that many variables that
ISPRS Int. J. Geo-Inf. 2015, 4
1267
describe forest land use change, for instance, is qualitative in nature and are difficult or impossible to describe in quantitative form. However, sometimes the story told by the people from their perceptions requires scientific corroboration, using a “second opinion” from the air using quantitative methodologies. This is important especially in areas where human accessibility is restricted for a fair judgment of results perceived by human interpretations [6]. Assessing LULC changes from a quantitative point of view therefore, provides insights into a decision-making process and complementing those qualitative assessments based on expert opinion. In his work on the peri-urban land use, Dutta [20] indicated that human activities ranging from agriculture to residential land uses have had considerable impacts on the peri-urban environment. Land use and cover change analysis is therefore crucial in establishing the interactions among the drivers and effects of land use change. This is because these have long-term implications on environmental management [21]. In the Bosomtwe district, urban-peri urban migration from the main city centres in closer proximity to the district have led to the increase in infrastructure of built and bare land and concrete land sue surfaces in the north-western part of the district. Abbas et al.[10], in their study of the urbanization in Katsina, Nigeria, indicated that urban sprawl and its concomitant effects of soil and land degradation resulting from increasing built environments, continues to characterize the peri-urban landscape. Sreenivasulu and Bhaskar [22] have once again supported this assertion by explaining that changes in land use can be due to urban expansion and the loss of agriculture land, changes in river regimes, and the effects of shifting cultivation. The Bosomtwe district of the Ashanti region is one of such area, which from a cursory observation might suggest some considerable land use and land cover dynamics. Over the years, the district, though predominantly rural, its peri-urban presence leaves much for land use policy implications at least in the next decade. Although some research on LULC dynamics have been done in the district, specific LULC studies employing the tools of remote sensing and GIS, has not been done for the entire district. Modelling of LULC change dynamics require robust approaches, such as geo-information tools which helps in assessing to an appreciable extent, the rate of changes, be it increasing and/or decreasing trends, in general for the Bosomtwe District. The suitability of these techniques has been supported by Addo [12] who indicated that the use of geo-information techniques offer relative advantages of allowing access to areas being used as peri-urban farmlands to be rapidly established at relatively low cost. The effort for this work is to corroborate, or otherwise, the earlier results of perception of land use change dynamics by inhabitants of the district derived from a socio-economic survey. In view of this, the justification for the use of the Landsat TM imagery was warranted to explain the actual trends of land use and land cover changes in the district [1]. Accordingly, Manonmani and Suganya [23] have reiterated that GIS and remote sensing have the potential to support decisions by providing data and analytical tools for the study of urban environments. The objective of this paper is to analyze, using geo-information (remote sensing and Geographic Information System) to ascertain the LULC change dynamics in the district, for the past 21 years.
ISPRS Int. J. Geo-Inf. 2015, 4
1268
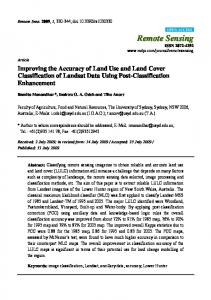
2. Results This section reports the result of the Jeffries-Matusita Distance spectra separability as well as the Kappa hat statistical accuracy assessment of the LULC classification before reportage of the actual change detection results for the various LULC, as well as the land use transitions among the LULC types. Nonetheless, for reducing uncertainty in land cover dynamics, only the most important changes were taken into account in order to clearly separate the true changes from possible misclassification. 2.1. Interpretation of the Spectral Plots The signature mean plots (Figure 1a) for the 1986 image yielded a Best Minimum Separability of the Jeffries-Matusita index of 1263.45. It shows that most of the land use classes were moderately separated in the bands, except the band 2, where almost all the classes coincided. This was expected to an extent, considering the level of reflectance characteristics of the images as per the surface configuration of the area at that time. Temporal degradation of the land during this time had exposed a greater percentage of the land to bare and open woodland and farm lands.
(a) Figure 1. Cont.
ISPRS Int. J. Geo-Inf. 2015, 4
1269
(b)
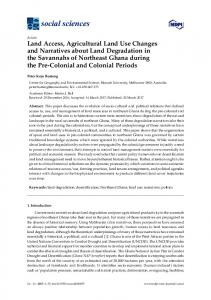
(c) Figure 1. Spectoral Separability Plots for LULC Classes for (a) 1986 LULC; (b) 2010 LULC; (c) 2014 LULC. Separability in the 2010 (Figure 1b) image indicated a Best Minimum Separability of Jeffries-Matusita of 1287.51; thus, almost all the land use classes were from fairly separated to moderately separated. Especially in band 5, all the land use classes, with the exception of low forest and other uses as line stripes, separated well; this was especially so with the water body. In the same light, band 4 was also
ISPRS Int. J. Geo-Inf. 2015, 4
1270
well separated. However, bands 1 and 2 did not show a better separability among the LULC types. This is an expected outcome since water reflects better in band 7. The signature plot (1c) for the 2014 image also shows that, with the exception of band 4, 5 and 6, which showed a moderate separability of the built up, low forest and water bodies, the rest of the land use classes were fairly separated by the remaining three bands. The Best Minimum Separability of Jeffries-Matusita index is 1072.25. 2.2. Classification Accuracy In this study, because of the absence of the former land use maps and aerial photographs for the area, which would have been used as reference for accuracy checks, field observations were made and GPS points measured and recorded. This was used to aid in the assessment of the overall Kappa and individual class accuracies for the producer and user accuracies. The Kappa statistic is generally accepted as a measure of classification accuracy for both the model as well as user of the model of classification [24]. Kappa values are characterized as