antimetabolite substances, i.e., fludarabine (FDB), cytarabine (CTB), gemcitabine (GTB), and fluorouracil (5 FU). For all infusion bags manufac- tured, up to 26 ...
1296 PERELLO ET AL.: JOURNAL OF AOAC INTERNATIONAL VOL. 84, NO. 4, 2001 SPECIAL GUEST EDITOR SECTION
Application of High-Performance, Thin-Layer Chromatography to Quality Control of Antimetabolite Analogue Infusion Bags LAURENT PERELLO, SYLVIE DEMIRDJIAN, ALEXANDRE DORY, and PHILIPPE BOURGET Gustave Roussy Institute, Department of Clinical Pharmacy, 39 Rue Camille Desmoulins, 94805 Villejuif Cedex, France
A global postproduction quality program was developed to secure chemotherapy infusion at the Gustave Roussy Institute. Despite rigorous procedures and computerized prescriptions, an analytical check was necessary to improve the quality of ready-to-use solutions of cytotoxic drugs in our Centralized Antineoplastics Reconstitution Unit. High-performance, thin-layer chromatography was selected as the analytical tool to assay 12 anticancer drugs. One of the analytical methods can separate 4 antimetabolite substances, i.e., fludarabine (FDB), cytarabine (CTB), gemcitabine (GTB), and fluorouracil (5 FU). For all infusion bags manufactured, up to 26 samples could be assayed per series using a double standard calibration (GTB and 5 FU).
nticancer chemotherapy infusion bags prescribed at the Gustave Roussy Institute, one of the most important European Centers for the treatment of cancer, represent at least 45 000 units/year. One drawback of this therapy is the very high potency of adverse effects associated with dosage mistakes (1–3). Some could be merely undesirable, like kidney failure, liver toxicity, bone marrow suppression, or cardiotoxicity, but others could be lethal (3–7). In fact, all anticancer drugs are dangerous in relation to a quite low therapeutic index (rate between toxic and curable dosage). Because the security of drug administration to patients is becoming the main priority for health authorities, a global quality program was applied to pharmaceutical processes in accordance with the regulations (8, 9). In this way, the department of pharmacy defends the Centralized Antineoplastics Reconstitution Unit (CARU) concept (10–12). All physician prescriptions are computerized, then a printed report is edited directly in the CARU to start infusion bag formulations, according to medical prescriptions and good pharmaceutical practices. Generally, the doses prescribed are injected into an infusion bag containing an adequate volume of dilution solvent, i.e., 5% dextrose or 0.9% sodium chloride sterile solution (13). At the present time, several drugs manufactured by pharmaceutical companies are tested by using high-performance, thin-layer chromatography (HPTLC) methods (14–16). Hence, we
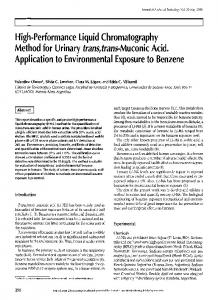
A
Guest edited as a special report on “Planar Chromatographic Procedures in Pharmaceutical Analysis” by Bernd Renger.
chose the development of this analytical tool for hospital pharmacy applications (control tests on the finished product; 15–17). Everyday, in accordance with our own production rate, we can assay morphine salt solutions for portable external pumps and some antineoplastic drugs into infusion bags (e.g., methotrexate, etoposide, all anthracycline analogues). This high number of samples tested daily has led us to the development of a new simultaneous method for quantitating antimetabolite analogues, i.e., fludarabine (FDB), cytarabine (CTB), gemcitabine (GTB), and fluorouracil (5 FU). Antimetabolite analogues are metabolized into active nucleotides by intracellular enzymatic systems. The presence of fluorine groups, a special carbohydrate, or a new chemical conformation interferes with a specific pathway of DNA synthesis such as enzyme inhibition (thymidylate synthase, DNA polymerase, ribonucleotide reductase) or the incorporation into DNA, causing termination strand breaks (3). Each of these effects may contribute to the antitumor effect and clinical toxicity, depending on the tissue, the schedule of drug exposure, and the mechanisms of resistance (3, 13). To summarize, the target of all potent drugs (DNA synthesis) involves an important chemical structural analogy as shown in Figure 1. Pyrimidine and purine analogues are aromatic heterocycles highly loaded with nitrogen; some of them have a carbohydrate component (difluororibose, arabinofuranose) increasing the polarity of the molecule. They are all highly soluble in water, sparingly soluble in alcohol, and quite insoluble in organic solvents (18). In addition, their absorption spectra present an intense maximum at 8 = 270 nm. Thanks to these interesting properties, chromatographic separation may be the method of choice for the analysis of pharmaceutical products. METHOD A clinically insignificant 0.5 mL volume sample is removed from the finished products. Each sample concentration is determined using an HPTLC technique modified from a TLC European Pharmacopoeia method for 5 FU (19). Controls and analyzed solutions are diluted in a methanol–water mixture (50 + 50, v/v) in order to incorporate them into the standard calibration range (100 to 1000 µg/mL). Standard calibration levels are made using pure manufactured substances. A 500 nL bandwise application sample is sprayed onto the stationary phase (silica gel plates) using an ATS Sampler III®
PERELLO ET AL.: JOURNAL OF AOAC INTERNATIONAL VOL. 84, NO. 4, 2001 1297
Figure 1. Structures of 4 antimetabolite agents.
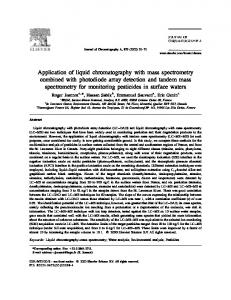
Figure 2. HPTLC analysis of 20 samples of antimetabolite analogues (3D superposition of densitograms).
1298 PERELLO ET AL.: JOURNAL OF AOAC INTERNATIONAL VOL. 84, NO. 4, 2001
Figure 3. TLC plate of antimetabolites: one run assay, 18 tracks of fluorouracil with gemcitabine (side A), and 26 tracks of fluorouracil alone (side B).
Figure 4. Gemcitabine stability assay: densitogram of a standard level 4; gemcitabine 300 ng (peak 1) and internal standard fluorouracil 100 ng (peak 2).
PERELLO ET AL.: JOURNAL OF AOAC INTERNATIONAL VOL. 84, NO. 4, 2001 1299 Table 1. Validation data: gemcitabine and fluorouracil in injectable solution Gemcitabinea
Fluorouracila
Repeatability (n = 6)b Mean c RSD , %
Accuracy, %
146.8
510.4
787.2
157.2
508.0
773.2
1.4
1.2
0.8
1.2
1.4
1.2
97.9
102.1
98.4
104.8
101.6
96.7
159.4
506.0
802.2
159.8
505.0
811.2
5.2
3.0
2.8
3.7
0.9
2.9
106.3
101.2
100.3
106.5
101.0
101.4
b
Reproducibility (n = 6) Mean RSDc, % Accuracy, % a b c
Three levels tested: 150, 500, and 800 µg/mL. Standard calibration range: 100 to 1000 µg/mL, 5-point calibration, Michaëlis Menten regression. RSD = relative standard deviation.
the deviation percentage between the target theoretical value and the analytical concentration measurement.
apparatus (Camag, Muttenz, Switzerland). The migration solvent is a mixture of ethyl acetate–methanol–water (HPLC grade; 50 + 10 + 10, v/v). A horizontal developing chamber (Camag) in sandwich configuration was chosen to economize mobile phase and time. In this way, it takes only 10 min and 5 mL migration solvent to develop an HPTLC plate. Immediately after development, the plate is dried at 50°C on a TLC plate heater. The appearance of the chromatogram is briefly observed under UV light at 254 nm to check the good migration of samples and the solvent front is marked to allow the calculation of the HRf (retention factor) values. Spots are evaluated via absorbance scanning at 270 nm using a TLC Scanner 3 and Cats 4 software (Camag). A nonlinear regression (Michaëlis Menten) is performed with a 5-point calibration to quantitate unknown samples via peak height evaluation (20, 21). Each substance, i.e., FDB, CTB, GTB, and 5 FU is recognized by its own HRf value. Each assay series is analytically validated by an internal quality control, with a 5% absolute deviation being tolerated for analytical results. Then, an internal software automatically calculates for each sample
Results All peaks are widely separated on the silica gel with a high efficiency (Figure 2). HRf values are 15 ± 5, 35 ± 3, 65 ± 5, and 80 ± 6 for FDB, CTB, GTB, and 5 FU, respectively (n = 20). Three resolution factors (Rs) can be calculated: Rs (FDB, CTB) = 2.10; Rs (CTB, GTB) = 2.40, and Rs (GDB, 5 FU) = 1.67 (22). These values, greater than 1.5, confirm the performance of HPTLC applied to antimetabolite agent separation. The substance elution order depends on the polarity of the compounds, thus the molecules which are better retained (lower HRf) are the carbohydrated structures (FDB, CTB, and GTB). They are more polar than 5 FU, which has more affinity for the mobile phase. HPTLC allows numerous analytical results using convergent horizontal migration, and a plate with samples can be stored at room temperature for a long time (Figure 3). Up to 26 tracks per side can be analyzed, i.e., 5 calibrates, 1 internal control, and 20 samples. Such a method allows synchronization with the variance of production flow. Standard calibration is complicated by adding more than 2
Table 2. Quantitative criteria for finished product acceptance Range of analytical measurementa (percentage of target concentration)
Resultsb
Decision guidelinesc
90–110%
Pass
Infusion bag ready-to-use
80–120%
Fail
Defect investigation
Rejection
Destruction of batch
120% a b c
Automatically calculated for each infusion bag tested. Pharmacist approval. No clinical incidence with 10% deviation.
1300 PERELLO ET AL.: JOURNAL OF AOAC INTERNATIONAL VOL. 84, NO. 4, 2001
substances for a daily quantitative assay. We have chosen a double GTB and 5 FU calibration for a quantitative report because they are major antimetabolite analogues in terms of clinical use, e.g., 5425 fluorouracil prescribed in 1998. Other analogues are qualitatively identified according to their HRf values. Such a technique allows very powerful checks in only one run. The validation data are obtained using 3 control levels in the same range as the samples checked, i.e., 150, 500, 800 µg/mL (6 replicates; Table 1). These results indicate an acceptable accuracy, suitable for the production quality check (17, 23). Relative standard deviations for repeatability (within-day assay) and reproducibility (between-day assay) are less than 5.2%, with 6.5% error at most (low level). After analysis, the report containing collected data is validated by a pharmacist. The comparison between theoretical values and analytical measures allows interpretation of production quality rate (Table 2). The acceptance for finished products is a 10% deviation from target values (including 5% for analytical tolerance). Major clinically significant errors occur when analytical results represent more than 20% absolute deviation. Furthermore, this concept has permitted the development of new manufacturing procedures that dissolve homogeneous anticancer agents into infusion solutions despite viscosity and the possible insolubility of molecules (17). To increase the precision of HPTLC assays for stability studies, e.g., gemcitabine conservation, an analytical method derived from the one described above was developed with fluorouracil as the internal standard (Figure 4). Using spectra comparison between chromatographic spots of a reference compound and an unknown substance, a HPTLC densitometer is able to give us an identity and purity report (24–26). This application is an interesting function for exploring stability or conformity of new pharmaceutical substances as generic drugs. Conclusions HPTLC instrumentation (especially densitometry) has now reached the same high level of technical maturity as other chromatographic methods (LC and GC; 15, 24, 25). Since 1998, HPTLC use in our Department of Pharmacy has become the main tool for analytical reporting, including financial, technical, and time considerations. In terms of quality assurance, this process contributes to the increase of safety and traceability of hospital anticancer infusion treatments on a daily basis. All possible uses are well applied to pharmaceutical products, and we are going to enhance development for new analytical application, e.g., drug stability, compound conformity, or chemical compatibility. Acknowledgments We thank Bernd Renger (BYK Gulden Pharmaceuticals, Konstanz, Germany) and Pierre Bernard-Savary (Merck S.A.,
Nogent-sur-Marne, France) for their help in preparing the manuscript. References (1) Loadman, P., & Bibby, M. (1994) Clin. Pharmacokinet. 26, 486–500 (2) Liliemark, J., & Peterson, C. (1991) Clin. Pharmacokinet. 21, 213–231 (3) Schilsky, R.L., Milano, G.A., & Ratain, M.J. (1996) Principles of Antineoplastic Drug Development and Pharmacology, Marcel Dekker, Inc., New York, NY, 75–122 (4) Dodwell, D.J. (1993) Lancet. 341, 614–616 (5) Galpin, A., & Evans, W. (1993) Clin. Chem. 39, 2419–2430 (6) Kobayashi, K., Jodrell, D., & Ratain, M. (1993) Cancer. Surv. 17, 51–78 (7) Vogelzang, N.J. (1984) J. Clin. Oncol. 2, 1289–1299 (8) French Public Health Code (1999) 13th Ed., L.511–L.665, Ed Dalloz, Paris, France (9) Gray, J.L., Evans, G., Diener, T., & Tiemann, M. (1984) J. Hosp. Pharm. 41, 630 (10) Sauer, K.A., Nowak, M.M., Coons, S.J., Parr, M.D., & McIntyre, W.J. (1989) Am. J. Hosp. Pharm. 46, 1389–1392 (11) Christensen, C.J., Lemasters, G.K., & Wakeman, M.J. (1990) J. Occup. Med. 32, 508–512 (12) Yokaiden, R.E., & Benett, D. (1986) Am. J. Hosp. Pharm. 43, 1193–1204 (13) Mitchell, R.B., Ratain, M.J., & Vogelzang, N.J. (1991) in Principles of Infusion Chemotherapy, M. Rotman & C.J. Rosenthal (Eds), Springer-Verlag, New York, NY (14) Renger, B. (1993) J. AOAC Int. 76, 7–13 (15) Renger, B. (1998) J. AOAC Int. 81, 333–339 (16) Sethi, P.D. (1996) HPTLC Quantitative Analysis of Pharmaceutical Formulations, CBS Publishers and Distributors, New Dehli, India (17) Beaupin, C., & Darmanaden, R. (1996) J. Onc. Pharm. Practice 2, 35–41 (18) Budavari, S., O’Neil, M., Smith, A., Heckelman, P., & Kinneary, J. (1996) The Merck Index Twelfth Edition on CD-ROM, Chapman & Hall, London, UK (19) European Pharmacopoeia (1997) 3rd Ed., Editions du Conseil de l’Europe, Strasbourg, France (20) Pollak, V.A. (1991) Chromatogr. Sci. 55, 249–281 (21) Xiang, Y., & Wang, B. (1993) Chinese J. Univ. Chem. 8, 34–38 (22) Lough, W.J., & Wainer, I.W. (1996) 1st Ed., in High-Performance Liquid Chromatography, Blackie Academic & Professional, Glasgow, UK, pp 15–35 (23) Prichard, E.F. (1995) in Quality in the Analytical Chemistry Laboratory, John Wiley & Sons, New York, NY (24) Jork, H., Funk, W., Fisher, W., & Wimmer, H. (1990) Thin-Layer Chromatography, Vol. 1a, Reagents and Detection Methods, VCH Publishers, Inc., New York, NY (25) Treiber, L.R. (1986) J. Chromatogr. Sci. 24, 200–224 (26) Poole, C.F., & Poole, S.K. (1994) Anal. Chem. 66, 27A–37A