2012 International Conference on Biomedical Engineering (ICoBE),27-28 February 2012,Penang
Application of imaging techniques for monitoring flocs in activated sludge Humaira Nisar, Lee Xue Yong, Yeap Kim Ho, Yap Vooi Voon, Soh Chit Siang Department of Electronic Engineering, Faculty of Engineering and Green Technology Universiti Tunku Abdul Rahman, Kampar, Malaysia
[email protected],
[email protected],
[email protected],
[email protected],
[email protected]
Abstract— Activated sludge process is commonly used for purification of waste water.. In this paper imaging techniques are used to monitor activated sludge flocs in waste water treatment plants (WWTPs). Monitoring the flocs includes study of floc morphology and quantification of flocs. This information can help in the prediction of abnormal events in WWTPs and may help in avoiding plant malfunction.
Keywords; digital image analysis;image processing; activated sludge; flocs and filaments; WWTPs
I.
INTRODUCTION
Waste water is purified through the activated sludge process; that is the most frequently used process employed wordwide. The flocs that are basically microbial aggregates are one of the major components of the waste water purification system. In settling phase, filamentous bulking and deflocculation may occur; these are the most common problems worldwide that occur when the ratio of filamentous bacteria to floc forming bacteria is too large causing decrease in settling ability and effluent quality deterioration. To avoid this problem, frequent observation of activated sludge is required and the conditions in the tank must be controlled accordingly [1, 2]. Traditionally sludge volume index (SVI) measurements provide macroscopic characteristics of the activated sludge, however this information gathering occurs with a delay, hence little or no time for precautionary measure is left once sedimentation problems take place [3]. Microscopic observations of waste water systems provide detailed information but is time consuming and subjective depending on the expertise of the analyst. Therefore an automated image analysis procedure for quick and objective analysis of sludge floc properties would be a major accomplishment in the fight against bulking problems to keep the plant in operation. Morphological characterization of flocs, play an important role in assessing the state of the activated sludge. Malformed flocs that are bulky and loosely packed prevent proper sedimentation of sludge. The carryover solids not only degrade
the quality of the treated affluent but may also clog the filters later. A laser particle analyzer is commonly used to measure the distribution of size of particles in water related process. This method is generally conducted in a laboratory by the help of a batch type method. In addition a analyzing particles using lasers is an expensive procedure, that is difficult to maintain and cannot be used to measure the flocs morphology which is helpful in determining the state of activated sludge [8]. The image analysis techniques used for automated sludge analysis involve capturing microscopic images via a precise and accurate microscopy system that automatically stores the images for on-site or off-site processing [4, 5]. These images are analyzed using state of the art image processing and pattern recognition algorithms. Hence faster, accurate and reliable results can be expected. However success of the overall process lies in precise and accurate recognition and quantification of activated sludge flocs and filaments. In this study image analysis is used to investigate the size and shape of activated sludge flocs and to quantify them. The application of automated methods makes the procedure more objective and reproducible as compared to the traditional analysis via microscope that is a subjective process. II.
MATERIALS AND METHOD
In this work image analysis has been used to monitor activated sludge flocs. The overall method can be divided into two major steps: Image acquisition and Image analysis. Image acquisition involves 1) sample and slide preparation, and 2) image capture. Image analysis involves 1) image processing and 2) image analyses. A. Image Acquisition 1) Sample and slide preparation The samples of activated sludge were collected from the aerations basins of a waste water treatment plant located in a residential area that deals with the household effluents, and then brought to the laboratory for testing.
This work is supported by UTAR Research Fund (UTARRF) grant funded by Universiti Tunku Abdul Rahman (No. IPSR/RMC/UTARRF/C111/H03)
978-1-4577-1991-2/12/$26.00 ©2011 IEEE
6
The slides were first sterilized to remove dust particles and moisture that may have gathered on them. A drop of sample is collected from the bottom of the container and is carefully placed on the glass slide using a dropper. A small glass cover sheet is placed over the slide. Care should be taken so that air bubbles are not trapped inside. The slide is now ready to be mounted on the microscope’s stage for image acquisition.
AR= length/breadth
(2)
Flocs can be divided into three groups based on their size as already discussed in [10]:
2) Image capture
• small flocs (with diameter less than 100 μm)
The images of activated sludge were captured using Olympus BX 41 laboratory microscope. The microscope is equipped with an imaging system that consists of a CCD camera that helps in storing images and video of the sample instantly on a computer system connected to the microscope. The magnification of the microscope was adjusted to 40 times. The digital images were stored in JPEG format (1288 x 966 pixels). It has been observed that low magnification method of the order of 50 -100 times is sufficient for activated sludge observations that involve flocs and filaments [9].
• medium flocs (with diameter between 100 and 500 μm) • large flocs (with diameter more than 500 μm). Another commonly used parameter is Field Area that describes the size and concentration of flocs. This is the ratio of the area occupied by the flocs detected in an image to the total image area [10]. 2) Floc Shape
B. Image Processing and Analysis Image processing involves the transformation of the images so that the objects of interest can be measured. It involves many steps depending on the objective. Image processing reduces or removes noise hence the overall quality of the image is improved, image enhancement techniques improve the interpretability or perception of information, hence results in enhancing the desired objects. The image is then segmented using edge detection techniques and a binary image is obtained. The objects of interest can be detected and separated from each other based on their morphological characteristics. The objects of interest can finally be quantified, if required. In our particular case image analysis is used for morphological characterization of activated sludge flocs and their quantification. The morphological parameters of activated sludge flocs can be divided into two main groups. The first group involves parameters related to the size of flocs and the second group deals with the shape of the flocs. 1) Floc Size Floc size can be defined in terms of mean projected area, equivalent circle diameter diameter, perimeter, aspect ratio and field area. Mean projected area (A) is an image analysis parameter and can be calculated by simply counting the pixels and multiplying with a scaling factor. The other parameters related to size are the derivatives of mean projected area. The equivalent circle diameter (De) [9], is defined as: De = 2 √ (Area/π)
Aspect ratio (AR) can be calculated as a ratio of length or major axis length and breadth or minor axis length of an object.
(1)
Shape of flocs comes under the second group of morphological parameters. Shape can be described in terms of circularity and regularity. Hence roundness (RD) or circularity index (Cx) are the most commonly used parameters. They indicate the extent the measured floc is similar to the true circle. Roundness varies from 0 to 1 and a circle has a RD of one. The circularity index is also equal to one when the object is a circle, however it increases when the object becomes less circular. Roundness is calculated from the projected area: RD=(4.area)/(pi.length)
(3)
Circularity index (Cx) can be obtained by taking the ratio of the observed perimeter (P) to the perimeter of a circle of the same area as the measured one: Cx = Perimeter/(2√π.area)
(4)
Another important shape factor is the fractal dimension. It is a measure of the irregularity of the perimeter. The ‘‘mosaic amalgamation’’ algorithm is used to determine fractal dimension [11]. Several commercial image analysis software’s, are available with imaging systems. There are also some image analysis programs that are available as public domain e.g. DAIME [7] (Digital Image Analysis in Microbial Ecology), that is developed in the university of Vienna, in the Department of Microbial. It is a novel computer program that integrates digital image analysis and three dimensional visualization functions. It has the capability to analyze digital images related
7
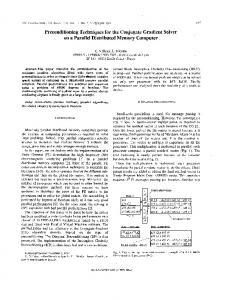
In this paper the digital images were analyzed using MATLAB Image Processing Toolbox. The software was run on a personal computer with a Pentium (R) dual core 3.0 GHz CPU. No. of flocs
80 70 60 50 40 30 20
98
92
86
80
74
68
62
56
50
44
38
32
26
10 0 2
The first step is the separation of foreground and background. The foreground consists of objects that are required for analysis. This objective is achieved by the process of segmentation that results in the formation of binary image (black and white). Figure 1 shows, activated sludge sample collected from the WWTP and Figure 2 shows flocs in the binary image.
100 90
20
RESULTS AND DISCUSSION
8
III.
The total no. of flocs obtained using image analysis is 1532 whereas DAIME reports this no. to be 1526, that’s a fairly good comparison. Hence we can safely assume that the image analysis method can be used for monitoring activated sludge flocs in waste water treatment plants and related information can be used to control plant operations.
14
to microorganisms (www.microbialecology.net/daime/). We will use this program for verifying the results obtained using image analysis.
Area of flocs
219 μm
Figure 3 Floc area distribution using image analysis
164.2 μm
Figure 1 Activated sludge sample
No. of flocs
100 90 80 70 60 50 40 30 20
Area of flocs
Figure 4 Floc area distribution using DAIME
Figure 2 Flocs in binary image Figure 3 shows the frequency distribution of area of activated sludge flocs calculated using the image analysis process. Figure 4 shows the the area frequency distribution obtained from DAIME. The particle size distribution by both methods has almost the same profile. This means that the proposed method can be used for calculating the size of flocs. In waste water treatment particle size distribution of sludge flocs plays an important role in the sedimentation process. The equivalent diameter of flocs is calculated using Eq. 1. Figure 5 shows flocs equivalent diameter distribution.
8
98
92
86
80
74
68
62
56
50
44
38
32
26
20
14
8
2
10 0
Figure 5 Floc equivalent diameter distribution IV.
CONCLUSION
In this paper imaging techniques are used for morphological characterization and quantification of activated sludge flocs, using floc size parameters under normal operating conditions. The results of the study shows that image analysis can be used for analyzing plant conditions. In the future this work can be extended to investigate floc characteristics under varying operating conditions of WWTPs. This will help to identify floc morphology under abnormal/varying plant conditions that will help in the development of an automated method to overcome plant failure beforehand using image processing and analysis. REFERENCES [1] [2]
[3]
Mesquita, D. P.Dias, Amaral, A. L. Ferreira, E. C., “Disturbances detection in activated sludge systems,” Semana de Engenharia 2010. Mesquita, D. P.Dias, O. Dias, A. M. A. Amaral, A. L. Ferreira, E. C., “Correlation between sludge settleability and image analysis information using Partial Least Squares,”– Proceedings of International Conference on Chemometrics in Analytical Chemistry (CAC2008), Montpellier, 2008. G. Gins , I. V. Smets, R. Jenne, J. F. Van Impe, “Activated Sludge Image Analysis Data Classification: An LS-SVM Approach,” 16th IFAC World Congress, Prague 2005.
[4]
D. P. Mesquita, O. Dias, A. L. Amaral and E. C. Ferreira, “Monitoring of activated sludge settling ability through image analysis: validation on full-scale wastewater treatment plants “Bioprocess and Biosystems Engineering, Volume 32, Number 3, 361-367, 2009 DOI: 10.1007/s00449-008-0255-z. [5] E. M. Contreras, Leda Giannuzzi, N. E. Zaritzky, “Use of image analysis in the study of competition between filamentous and non filamentous bacteria,” Water Research, 2621-2630, 2004. [6] W. Heine, I. Sekoulov, H. Burkhardt, L. Begen, J. Behrendt. “Early warning system for operation failures in biological stages of WWTPs by online image analysis,” IWA Conference, Berlin, 15-19 Oct., 2001. [7] Daims, H., Lucker, S., and Wagner, M. daime, a novel image analysis program for microbial ecology and biofilm research. Environ. Microbiol. 8:200-213 (2006). [8] Ruey-Fang Yu & Ho-Wen Chen &Wen-Po Cheng & Mei-Ling Chu, “Simultaneously monitoring the particle size distribution, morphology and suspended solids concentration in wastewater applying digital image analysis (DIA),” Environ Monit Assess (2009) 148:19–26, DOI 10.1007/s10661-007-0135-z. [9] Ewa Liwarska-Bizukojc, “Application of image analysis techniques in activated sludge wastewater treatment processes,” Biotechnology Letters (2005) 27: 1427–1433,Springer 2005, DOI 10.1007/s10529-005-1303-2. [10] Eikelboom DH, van Buijsen HJJ (1992) Handbuch fu¨r die mikrobiologische Schlammuntersuchung, 3rd edn.Munich: FHirthammer Verlag GmbH. [11] Russ JC (1990) Computer Assisted Microscopy: The Measurementand Analysis of Images, New York: Plenum Press.
9