E3S Web of Conferences 35, 04001 (2018) https://doi.org/10.1051/e3sconf/20183504001 POL-VIET 2017
Application of Laser Scanning for Creating Geological Documentation Michał Buczek1, *, Martyna Paszek1, and Anna Szafarczyk1 1
AGH University of Science and Technology, Faculty of Mining Surveying and Environmental Engineering, A. Mickiewicza Av. 30, 30-059 Krakow, Poland Abstract. A geological documentation is based on the analyses obtained from boreholes, geological exposures, and geophysical methods. It consists of text and graphic documents, containing drilling sections, vertical crosssections through the deposit and various types of maps. The surveying methods (such as LIDAR) can be applied in measurements of exposed rock layers, presented in appendices to the geological documentation. The laser scanning allows obtaining a complete profile of exposed surfaces in a short time and with a millimeter accuracy. The possibility of verifying the existing geological cross-section with laser scanning was tested on the example of the AGH experimental mine. The test field is built of different lithological rocks. Scans were taken from a single station, under favorable measuring conditions. The analysis of the signal intensity allowed to divide point cloud into separate geological layers. The results were compared with the geological profiles of the measured object. The same approach was applied to the data from the Vietnamese hard coal open pit mine Coc Sau. The thickness of exposed coal bed deposits and gangue layers were determined from the obtained data (point cloud) in combination with the photographs. The results were compared with the geological cross-section. Key words – intensity, terrestrial laser scanning, geological cross-section, geological profile.
1 Introduction The graphical presentation of the current state of the geological structures is usually required for the creation of a geological documentation, its supplements, and carrying out a register and a resources balance. The geological mapping of the excavation at the present moment includes making maps, cross-sections, profiles and other diagrams. The geological cross-section method is one of the basic methods to estimate the resources. Nowadays, there is plenty of software facilitating geologist’s work. The meticulous fieldwork is still the base for the whole procedure of creating cross-sections and maps which may be used for subsequent calculations. The field-based geological mapping methods of exposed rock formations are still mainly the conventional techniques using a measuring tape, a piece of paper and a pencil. No less important is geologist’s experience and reliability. Recently, researchers postulate application of
*
Corresponding author:
[email protected]
© The Authors, published by EDP Sciences. This is an open access article distributed under the terms of the Creative Commons Attribution License 4.0 (http://creativecommons.org/licenses/by/4.0/).
E3S Web of Conferences 35, 04001 (2018) https://doi.org/10.1051/e3sconf/20183504001 POL-VIET 2017
new remote sensing techniques like point cloud from a stereoscopic pair of photographs [1], or a model from standard color slides [2]. The cross-section accuracy depends on many factors such as type and formation of the deposit, documentation purpose etc. The results accuracy can reach the centimeter level, but lower accuracy is sufficient for the business and industry conditions [3]. Recently, in surveying measurements, the Light Detection and Ranging (LIDAR) is becoming more and more popular, commonly called 3D laser scanning. It is a surveying method to measure a terrain surface. It measures the distance to a target from a device (laser scanner) mounted inside an airship, a land vehicle, or on a station (eg. tripod). The device sends pulsed laser light and measures the reflected pulses with a sensor, simultaneously computing the measured point’s coordinates (X, Y, Z) and the direction of the laser beam [4]. The accuracy and the speed of the terrestrial LiDAR allow to apply it in many different tasks: structures’ health monitoring [5], rivers [6] and forest measurements [7], and creating geological documentation [8]. As a result, the point cloud data is obtained. Despite the geometrical information (coordinates) it may contain extra information such as intensity of the reflected beam (intensity), RGB information about a color of the scanned point, or normal vectors of each point etc. The laser signal intensity depends mostly on the scanned surface material [9]. Except that, range, incidence angle, meteorological and atmospheric conditions, albedo and many others influence the intensity measurement [10, 11]. The paper presents an approach to create the cross-section of the deposit with a terrestrial laser scanner (TLS). The approach to determine the type of rocks based on the laser beam intensity is presented. The results are compared with the results from conventional methods. The application of LIDAR technology allows one to enhance the quantitative elements of the geological documentation.
2 Test site measurements The LIDAR technology has been already applied successfully in many geological tasks like digital and schematic models, digital elevation models (DEM), volume computation, and many others [8, 12]. The research focused on the creation of a geological cross-section of a mine wall from a point cloud obtained from LIDAR measurements. The assumption was made that higher accuracy of LIDAR data can improve the resource evaluation from the model. Acquiring the raw point cloud is faster than conventional methods. In some conditions, like landslides, the remote sensing technology is also more safe, because one does not have to enter the endangered area [13]. The study was based on the two test sites: AGH experimental mine scanned with Leica C10, and Coc Sau open pit mine scanned with GeoMax ZOOM300. Depending on the laser scanner’s construction and software, the intensity is recorded in a different format. The parameters of the laser scanners are presented in Table 1. Table 1. The parameters of the used terrestrial laser scanners Type Accuracy of length measurement Range Carrier wavelength Beam divergence Intensity (range of values)
Leica C10
GeoMax Zoom300
pulse-based 4 mm (up to 50 m) up to 350 m 532 nm 0.24 mrad 0–1
Time-of-Flight 6 mm/50 m 300 m 905 nm 0.37 mrad 0–255
2
E3S Web of Conferences 35, 04001 (2018) https://doi.org/10.1051/e3sconf/20183504001 POL-VIET 2017
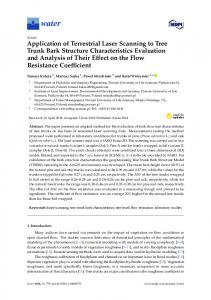
2.1 The Used data The first point cloud depicts a part of the longwall in AGH experimental mine (Fig. 1a). The scan was taken from one station under favorable measuring conditions: uniform lighting, close distance to the object, clear and dry air, and constant temperature. The point cloud containing around 2.3 million points was smoothed with the Gaussian filter to compute the mean value of intensity. The chosen part of the wall contains 3 surface types (called Rock A, Rock B, and Rock C) of different color and lithology. For each material 5 samples from the point cloud were chosen (Fig. 1b). Figure 1c depicts the field-based geological drawing of the measured test site.
Fig. 1. AGH test site: a) point cloud (presentation type: intensity), b) photograph with marked rock samples (red – Rock A, yellow – Rock B, green – Rock C), c) field geological profile
2.2 Methodology The intensity value histograms with 64 intervals were made for each selected rock sample. The obtained datasets were characterized by the normal distribution. The normal distribution was assumed on the base of the central limit theorem of Lindenberg-Levy and Lapunow, due to a large number of observation in the samples. The basic attribute of the normal distribution is that the 68% of the observations are within one standard deviation (1σ), and 95% of the observations are within two standard deviations of the mean (2σ). Based on that attribute the ranges (1σ and 2σ) were computed. The averaged ranges (obtained from 5 samples) were computed for each rock type. The final values were used to divide the point cloud into separate groups, depending on the intensity of each point. The Gauss filter, applied previously, reduces the noise and number of outliers. The generated groups contain points with intensities assigned to different materials. The ranges may intersect with each other, depending on the characteristics of the materials. For those ranges, the rock type is disambiguated. The level of certainty depends on lithology of measured materials, each rock may have different characteristics. One cannot simply assume apriori the level of certainty used to separate materials from the point cloud. For different pairs of rocks, the boundary may be more or less vague. Thus, the new point clouds for each material were compared with the photographs and geological drawing to check its correctness.
3
E3S Web of Conferences 35, 04001 (2018) https://doi.org/10.1051/e3sconf/20183504001 POL-VIET 2017
2.3 Results Leica C10 laser scanner stores intensity values within the range 0 to 1. The intensity ranges of each type of lithology and theirs averaged values were presented in Table 2. Table 2. The sample characteristics and the intensity ranges
Rock type
Number of points in sample
A1
4333
0.141
0.171
0.124
0.188
A2
2893
0.144
0.174
0.129
0.189
A3
2665
0.149
0.171
0.140
0.186
A4
2405
0.155
0.173
0.140
0.187
A5
2405
0.148
0.168
0.135
0.180
B1
584
0.187
0.201
0.186
0.217
B2
1096
0.182
0.203
0.173
0.212
B3
1845
0.194
0.212
0.186
0.220
B4
629
0.188
0.201
0.183
0.206
B5
886
0.198
0.220
0.188
0.230
C1
1343
0.128
0.145
0.121
0.152
C2
1685
0.133
0.149
0.125
0.158
C3
3161
0.133
0.149
0.125
0.157
C4
2381
0.137
0.151
0.129
0.160
C5
2484
0.138
0.155
0.130
0.161
Intensity histogram
Intensity range (1σ)
4
Average intensity range (1σ)
0.147
0.190
0.134
0.171
0.207
0.150
Intensity range (2σ)
Average intensity range (2σ)
0.134
0.186
0.183
0.217
0.126
0.158
E3S Web of Conferences 35, 04001 (2018) https://doi.org/10.1051/e3sconf/20183504001 POL-VIET 2017
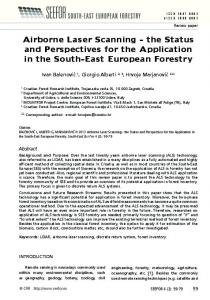
For the standard deviation 2σ, there were intersections for pairs Rock A – Rock B (0.183–0.186) and Rock A – Rock C (0.134–0.158). For the standard deviation 1σ, there was only one, narrow intersection for the pair Rock A – Rock C (0.147-0.150). Therefore the standard deviation 1σ was used in analyses. For each point cloud, the mesh network was generated. It may be used as a 3D model for further analyses, the basis for the creation of intersection (Fig. 2).
Fig. 2. The 1σ point cloud profile of the AGH experimental mine (blue – Rock A, green – Rock B, red – Rock C)
The 3D model may be used for quantitative analyses like volume computation. The mesh networks were created from the original point cloud and from point clouds for each rock type. The surface area of the whole dataset was 6.27 m2. The area of Rock A, Rock B and Rock C was 1.92 m2 (30.6%), 2.08 m2 (33.1%) and 1.32 m2 (21.1%), respectively. The areas’ sum cannot be equal to the whole area due to the unclassified points. To compare the results, the percentage of the area was calculated with the manual method from the calibrated photograph. The area of Rock A equals to 25.5%, and Rock C to 19.5%. The rest of the photograph may be assumed as the Rock B. Differences in values between two counted methods may be caused by the accuracy of picking areas to computation. In the conventional method, small patches of rock may be hard to distinguish. Also important is the accuracy of drawing boundary of the patches. The point cloud method is fully automated and uninfluenced by the geologist skills and precision.
3 Case study 3.1 The Used data The second point cloud was generated from the data obtained in Coc Sau open pit mine (Fig. 3). The Coc Sau open pit mine is placed next to Cam Pha city, in the Quang Ninh province of Vietnam. Presently, the mine’s depth is up to 200 m above the sea level. The measures were conducted with laser scanner GeoMax Zoom300 storing intensity values within the range from 0 to 255. The pointset depicts the slope outside the excavation zone. Additionally, the data was modified and transformed to local coordinate system. The point cloud was noisy and its density was low. 5
E3S Web of Conferences 35, 04001 (2018) https://doi.org/10.1051/e3sconf/20183504001 POL-VIET 2017
Fig. 3. The point cloud of the highwall slope in Coc Sau open pit mine
3.2 Results The corresponding method to the method presented in chapter 2 was applied. The analysis of the photographs and colors of the point cloud (Fig. 3) allowed to identify three different type of rocks (materials). The names of the materials were respectively: Rock D (yellow color), Rock E (dark gray color), and Rock F (light gray color). Due to the low quality of the input data, the intensity ranges were computed only for standard deviation 1σ. The average intensity range for 1σ is between 198.75 and 222.37 for the Rock D, 160.125 to 180.25 for the Rock E, and 174.69 to 196.36 for the Rock F. There were only the ranges for the Rock E and the Rock F intersected each other (174.69 to 180.25) and for these separate range was created.
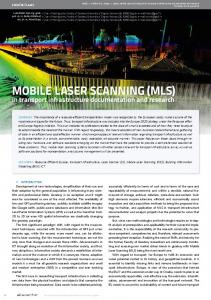
Fig. 4. Geological profile (source: geological department of Coc Sau) with profile generated from point cloud
The geological profile was generated, based on the computed intensity ranges. The result was compared with the geological intersection profile for the same place (Fig. 4) in the same scale. The LIDAR measures points only on the visible surfaces. Therefore point clouds may 6
E3S Web of Conferences 35, 04001 (2018) https://doi.org/10.1051/e3sconf/20183504001 POL-VIET 2017
contain gaps and the products from post-processing may be incomplete. The red curve is separated in the bottom part due to the lack of data in this place. The point cloud depicts the real shape of the surface. Thus, this method is more accurate than any conventional method in geology to create cross-sections. Also, matching points with types of rocks based on the intensity allows identifying lithological layers with centimeter accuracy. The geological profile presents only one type of rock for the measured place.
4 Conclusions The hand-drawn geological profile depicts the lithological changes visible with the bare eye, but it isn’t cartometric. Photographs of the observed object may be used as a source for the geological documentation. To do so, the photogrammetric and geometric conditions have to be preserved like camera calibration, lack of picture deformations, station in front of the photographed object etc. The application of modern remote sensing techniques like LIDAR in earth sciences is labor-saving and faster than the conventional approaches. The collected data are cartometric and preserves the geometrical features of the observed object regardless the localization of the station. The point cloud data allows creating object’s digital model. Thus, the TLS results can improve the quality of the results from the conventional methods. The data processing procedure was tested on the AGH test site with the laser scanner Leica C-10. The intensity’s ranges for each material with the 1 and 2 sigma probability level were computed. The ambiguous ranges may be assumed as the transition zone between two different rocks. The intensity values depend on the type of the material, laser scanner, and the weather conditions during the measurements. Therefore, to get extract information about rock types, the previous calibration is necessary. The calibration field should contain samples taken from the investigated object. To fulfill the demand of the similar conditions, the calibration should be made in-the-field, during the object’s measurements. The obtained values allowed to create the profiles of the measured objects and conducting some quantitative analyses such as area computation. The comparison of the obtained results with the conventional methods reveals that the accuracy of the second one depends on the geologist’s skills and precision, the complexity of the presented object and the accessibility of it. The application of remote sensing methods, like LIDAR, provides higher accuracy, uninfluenced by the human. The possibilities of processing the point cloud into a drawing of the object’s visible surface and object’s intersections were presented. The results are always cartometric, thus they may be used in the geological documentation. Other documents, like intersections and photographs, may help to interpret the point cloud. Authors propose the application of the TLS technology to create intersections and profiles due to the full cartometric, higher accuracy, and field works time-saving. Additionally, remote sensing technologies allow depicting inaccessible places. The digital models allow one for conducting the quantitative analyses. One of the benefits is the ease of creation of the 3D model, which can be used to compute the excavation progress. Acknowledgment Authors would like to thank HUMG’s Mine Surveying Department for helping in contacting with Coc Sau mine and providing data. Authors also would like to thank AGH for providing access to the AGH experimental mine.
7
E3S Web of Conferences 35, 04001 (2018) https://doi.org/10.1051/e3sconf/20183504001 POL-VIET 2017
References 1. S. Martín, H. Uzkeda, J. Poblet, M. Bulnes, R. Rubio, COMPUT GEOSCI, 51, 90–100 (2013) 2. K.S. Dueholm, A.A. Garde, A.K. Pedersen, J STRUCT GEOL, 15, 933–937 (1993) 3. D.M. Ragan, Structural geology: an introduction to geometrical techniques (Cambridge University Press, 2009) 4. Rozporządzenie Ministra Spraw Wewnętrznych i Administracji z dnia 9 listopada 2011 r. w sprawie standardów technicznych wykonywania geodezyjnych pomiarów sytuacyjnych i wysokościowych oraz opracowywania i przekazywania wyników tych pomiarów do państwowego zasobu geodezyjnego i kartograficznego, (MSWiA, 2011) 5. H. Park, H. Lee, H. Adeli, I. Lee, COMPUT-AIDED CIV INF, 22, 19–30 (2007) 6. R. Williams, J. Brasington, D. Vericat, D. Hicks, EARTH SURF PROC LAND, 39, 167–183 (2014) 7. M. Simonse, T. Aschoff, H. Spiecker, M. Thies, Proceedings of the scandlaser scientific workshop on airborne laser scanning of forests, 2003, 252–258 (2003) 8. S.J. Buckley, J. Howell, H. Enge, T. Kurz, J GEOL SOC LONDON, 165, 625–638 (2008) 9. D. Costantino, M. G. Angelini, INT ARCH PHOTOGRAMM, 1, 207–212 (2013) 10. J. Zaczek-Peplinska, K. Osińska-Skotak, K. Gergont, Inżynieryjne zastosowania geodezji (Wydawnictwo Politechniki Poznańskiej, Poznań, 2012) 11. K. Tan, X. Cheng, REMOTE SENS-BASEL, 8, 251 (2016) 12. I. Piech, B. Kwoczyńska, D. Słowik, INF EKO TER WIEJ, 323–334 (2016) 13. J. Maciaszek, R. Gawałkiewicz, A. Szafarczyk, Geodezyjne metody badania osuwisk (Wydawnictwo AGH, Kraków, 2015)
8