PRAMANA — journal of
c Indian Academy of Sciences °
physics
Vol. 66, No. 6 June 2006 pp. 1057–1065
Application of maximum entropy method for the study of electron density distribution in SrS, BaS and PuS using powder X-ray data R SARAVANAN Department of Physics, The Madura College, Madurai 625 011, India E-mail:
[email protected] MS received 6 November 2004; revised 23 January 2006; accepted 15 March 2006 Abstract. A study of the electronic structure of the three sulphides, SrS, BaS and PuS has been carried out in this work, using the powder X-ray intensity data from JCPDS powder diffraction data base. The statistical approach, MEM (maximum entropy method) is used for the analysis of the data for the electron density distribution in these materials and an attempt has been made to understand the bonding between the metal atom and the sulphur atom. The mid-bond electron density is found to be maximum for PuS among these three sulphides, being 0.584 e/˚ A3 at 2.397 ˚ A. SrS is found to have the lowest electron 3 ˚ density at the mid-bond (0.003 e/A ) at 2.118 ˚ A from the origin leaving it more ionic than the other two sulphides studied in this work. The two-dimensional electron density maps on (1 0 0) and (1 1 0) planes and the one-dimensional profiles along the bonding direction [1 1 1] are used for these analyses. The overall and individual Debye–Waller factors of atoms in these systems have also been studied and analyzed. The refinements of the observed X-ray data were carried out using standard softwares and also a routine written by the author. Keywords. X-ray; electron density; sulphides; maximum entropy method; thermal parameters. PACS Nos 61.10.Nz; 61.43.Gt; 61.66.Fn; 71.15.-m
1. Introduction The study of electronic structure of materials and the bonding is an important part in materials characterization. The bonding studies can give information of the atomic level properties that can be used for the preparation and growth of materials suitable for specific needs. Many researchers have studied the electron density distribution of several important materials using different techniques: for example, Hansen and Coppens [1] have studied aspherical electron density distributions using multipole analysis. Poulson et al [2] have used synchrotron radiation for the charge density studies using multipole analysis. Marabello et al [3] studied KClO4 and KMnO4 both theoretically and experimentally using multipole analysis. A variety of techniques and models are available as reported in literature for electron density 1057
R Saravanan studies. The maximum entropy method (MEM) is the recent probing tool for the analysis of the electron densities that are strictly positive since this method is based on probabilistic approaches. It gives less biased information, but it has a limitation in terms of the computing power of the machine on which it runs. Since the electron density is being refined cyclically in each pixel (in the present work the unit cell of the sulphide has been divided into 64 × 64 × 64 pixels), a supercomputing system is needed in most cases involving lower crystallographic systems. The present author and collaborators have studied many materials in terms of the bonding and charge transfer between atoms [4–11] using the maximum entropy method. For example, the covalent bonding in GaAs [4], InP [5] and ZnTe [6], the ionic bonding in LiF and NaF [7] and CaF2 [8], charge transfer in CdTe [9], metallic nature in MnHg [10], the bonding in oxides [11] has been studied. Different bonding types have been investigated using X-ray data in these [4–11] studies. Other works on the electron density distribution have also been made on different materials [12–16] using MEM. These studies give a very good understanding of the bonding in materials and the MEM methodology has been proved to be far more superior to any other method of electron density analysis. Most of these studies are based on measurements on single crystal data to which appropriate corrections were applied and utilized for bonding studies. One of the primary corrections to be applied to single crystal data sets is the extinction correction. In the previous studies by the author [4–11] proper extinction corrections were applied using appropriate models. However, it was felt worthwhile to study some systems and check the MEM methodology and the results using sets of powder X-ray data in which extinction is expected to be minimum. Hence, a study using powder X-ray data has been undertaken to determine the bonding and radii of atoms/ions in some sulphides, viz., SrS, BaS and PuS. The powder X-ray data sets used for the present analysis on sulphides have been taken from the JCPDS powder diffraction files. These systems have been analyzed in terms of the structural refinement using FULLPROF [17], thermal vibration of individual atoms, the one-dimensional and two-dimensional MEM electron density distributions, the nature of bonding and inter-bond electronic densities. The MEM computations were carried out as indicated in our earlier papers [4– 11] to determine electron densities and the resulting three-dimensional electron densities were utilized for the determination of the bonding nature and the radii of atoms. To assist in the determination of the quality of data used in this work and to determine the thermal vibration parameters, refinements were carried out by a standard software FULLPROF [17] and also a refinement routine written by the author (named in this paper as RS refinements). The present work aims to demonstrate that the integrated powder data can be used for the analysis of electron density distribution using MEM and the bonding features can be understood in a better manner. However, the limitations lie in the quality of powder data sets used for the analysis. 2. Data treatment The powder data of SrS, BaS and PuS were corrected for Lorentz polarization and multiplicity effects and converted into corresponding structure factors. Then these
1058
Pramana – J. Phys., Vol. 66, No. 6, June 2006
Electron density distribution in sulphides Table 1. The Debye–Waller factors of individual atoms and the reliability indices of three sulphides. Debye–Waller factor B (˚ A2 ) Reliability index (%) Refinement type
System BMetal
BS
RS refinement
SrS BaS PuS
1.78(13) 0.56(82) 0.32(01)
1.91(26) 1.43(52) 0.51(05)
FULLPROF refinement [14]
SrS BaS PuS
1.61(08) 0.94(36) 0.32(01)
2.43(23) 1.95(100) 0.43(05)
RRS RF
R(F 2 )
3.63 1.98 0.29 2.27 2.65 0.31
2.57 4.99 0.56
observed structure factors were refined using FULLPROF [17] which has features to refine the data of integrated intensities from powder samples. The refined Debye– Waller factors of individual atoms of the three sulphides are presented in table 1 together with the reliability index values R(F ) and R(F 2 ). In order to verify the results and to reconfirm, these powder data were refined (called RS refinements) using a code by the author in which the individual thermal parameters were refined together with the scale factor. The standard least squares procedure by the full matrix method wasPadopted for refining the physical parameters. The quantity minimized was D = hkl whkl (|Fo | − k|Fc |)2 where Whkl is the weight to be assigned on an observation. Fo and Fc are the observed and calculated structure factors. The reliability indices of these refinements (RRS ) together with the Debye–Waller factors have been given in table 1. The refined structure factors of the three sulphides systems have been given in table 2, which have been utilized for the elucidation of the electron density distribution and bonding in sulphides using the methodology adopted earlier [1–8]. The MEM computations are based on the formalism by Collins [18]. The unit cells of the respective sulphides were divided into 64 × 64 × 64 pixels. The convergence P criterion C = 1/N (|Fc (k) − Fo (k)|2 /σ 2 (Fo (k))) = 1 was achieved after large numbers of refinement cycles except in the case of SrS, as given in table 3. The other relevant parameters of MEM analysis have been given in table 3. The MEM electron density distribution on the (1 0 0) plane of the three sulphides have been shown in figures 1a, 1b and 1c respectively for SrS, BaS and PuS and the corresponding densities on the (1¯10) plane have been shown in figures 2a, 2b and 2c respectively. The one-dimensional profiles along the bonding direction, viz., [1 1 1], have been shown in figure 3 for these three sulphides. The electron densities and the bonding in these three sulphides have been studied and analyzed based on the two-dimensional MEM maps on the (1 0 0) and (1¯10) planes and the one-dimensional density profiles along [1 1 1]. 3. Results and discussion The preliminary analysis of the powder data of the sulphides, SrS, BaS and PuS, yielded reasonable individual Debye–Waller factors as indicated in table 1. The Pramana – J. Phys., Vol. 66, No. 6, June 2006
1059
R Saravanan Table 2. The refined structure factors of the three sulphide systems. System
h k l
Fobs
Fcal
SrS
1 2 3 3 4 5 6 5 6 5
1 0 1 3 4 3 2 3 2 5
1 0 1 1 0 1 0 3 2 1
75.171 164.570 55.211 50.539 73.685 37.161 62.855 24.845 59.882 21.022
73.009 165.320 58.538 47.044 74.593 32.569 63.268 27.716 58.417 23.767
BaS
1 2 2 3 2 4 5 4 6 5 6 5 6
1 0 2 1 2 2 1 4 2 3 2 5 4
1 0 0 1 2 2 1 0 0 3 2 1 0
139.293 224.347 208.939 126.041 182.128 142.991 107.859 126.966 120.494 92.451 106.010 85.055 96.457
141.343 230.489 201.484 125.570 181.253 143.771 105.362 127.569 114.769 92.000 109.263 86.427 99.625
PuS
1 2 2 3 2 4 3 4 4 4 5 6 5 6 4
1 0 2 1 2 0 3 2 2 4 3 2 3 2 4
1 0 0 1 2 0 1 0 2 0 1 0 3 2 4
263.281 350.763 313.929 223.099 288.396 268.723 194.636 251.143 238.167 218.076 161.987 203.007 149.849 191.706 185.009
263.206 351.127 313.891 222.040 287.919 268.231 195.149 252.454 239.253 217.738 161.825 200.339 150.125 192.706 185.638
thermal parameter of sulphur is found to be larger than that of the metal atoms in all the cases as seen from table 1. In PuS, both the Debye–Waller factors are very low and BPu has the lowest value, 0.32(1) ˚ A2 . The largest Debye–Waller factors among the three sulphides exist for SrS, for which both these factors are high, BS
1060
Pramana – J. Phys., Vol. 66, No. 6, June 2006
Electron density distribution in sulphides Table 3. Parameters of MEM analysis. Parameter Number of reflections, N Prior density, τ (ri ) (e/˚ A3 ) Lagrange parameter, λ Number of iterations R (%) wR (%) Resolution (˚ A/pixel)
SrS
BaS
PuS
10 1.01 0.005 1251 3.35 1.14 0.094
13 0.90 0.0015 14931 1.40 0.54 0.099
15 0.39 0.0003 17998 0.37 0.09 0.087
being the largest (3.26(45) ˚ A2 ). These values are reasonable considering the atomic weights and the electrostatic attraction between the ions. The ESDs (estimated standard deviations) given in parenthesis are also reasonable considering the fact that only limited number of reflections are available for the present study. Despite, no ESD has exceeded the parameter value. The refined structure factors given in table 2 show good agreement between the observed and calculated values. This fact justifies the use of these data sets for the analysis of the electron density using MEM. The MEM refinements were carried out as mentioned in our earlier works [4–11]. The MEM refinements were completed with the smallest possible number of cycles of refinements as tabulated in table 3. This was done by selecting appropriate Lagrange parameter, λ. The spatial resolution of the MEM maps is as low as 0.087 e/˚ A, enough for the elucidation of the bonding electrons. With such a precision, reliable MEM maps and profiles can be constructed and analyzed. The reliability indices R and wR of the MEM refinements have been given in table 3 together with other relevant parameters. Except SrS, all the other refinements required a large number of refinement cycles. The MEM calculations needed a PC with a versatile Pentium processor and with a large RAM memory. Since all the present systems are cubic – a higher symmetry system – the above requirements were enough for the MEM refinements. For more complicated and lower symmetry systems, PCs are not enough and a vector computer will be required. The MEM maps on the (1 0 0) plane of SrS show (figure 1a) very nice ionic nature of the bonding in SrS. The electrostatic attraction of unlike charges and repulsion of like charges can be seen through the shapes of the contour lines at the outer regions of the atoms. The voids at regions other than the atomic positions also indicate the ionic nature of charges. Figure 1b shows MEM map on the (1 0 0) plane of BaS. Here also, pure ionic nature is visible. No bonding or residual charges are seen at any other regions other than the atomic positions. The size of the electron cloud indicates the size of the ion/atom involved. Figure 1c shows the MEM EDD on the (1 0 0) plane of PuS. The pulling/attraction of outer charges towards the core of Pu atom is clearly visible indicating the strength of the bonding forces in PuS. Despite this core attraction, unlike charges of Pu and S tend to attract each other. The bonding is predominantly ionic in PuS also. The MEM EDD of SrS on the (1 ¯1 0) plane is represented in figure 2a. Features characteristic of a pure ionic bonding are visible in this plane. Strong electrostatic
Pramana – J. Phys., Vol. 66, No. 6, June 2006
1061
R Saravanan
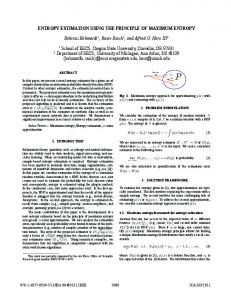
Figure 1. (a) MEM electron density distribution of SrS on the (1 0 0) plane (contour range: 0.0 to 9.0 e/˚ A3 , contour interval: 0.45 e/˚ A3 ). (b) MEM electron density distribution of BaS on the (1 0 0) plane (contour range: 0.3 to 5.0 e/˚ A3 , contour interval: 0.235 e/˚ A3 ). (c) MEM electron density distribution of PuS on the (1 0 0) plane (contour range: 0.0 to 8.0 e/˚ A3 , contour interval: 3 0.4 e/˚ A ).
attraction of Sr and S ions is seen. On the other hand, like atoms show no electron clouds between them and thus the region between unlike charges continues to be a long chain of voids. A similar characteristic is seen in figure 2b also wherein the MEM EDD of BaS has been shown on the (1 ¯1 0) plane. Figure 2c shows the core attraction of charges in Pu ion. Due to this core attraction, the electrostatic attraction between the Pu and S ions is slightly declined as seen from the middle part of S ion. The one-dimensional profiles of electron densities along [1 1 1] of each sulphide unit cells have been constructed using the MEM electron densities and presented in figures 3a, 3b and 3c, which show the high- and low-density distribution of charges along the [1 1 1] direction of the three unit cells. Figure 3a indicates the metal 1062
Pramana – J. Phys., Vol. 66, No. 6, June 2006
Electron density distribution in sulphides
Figure 2. (a) MEM electron density distribution of SrS on the (1 ¯ 1 0) plane (contour range: 0.0 to 8.0 e/˚ A3 , contour interval: 0.4 e/˚ A3 ). (b) MEM electron density distribution of BaS on the (1 ¯ 1 0) plane (contour range: 0.3 to 4.0 e/˚ A3 , contour interval: 0.93 e/˚ A3 ). (c) MEM electron density distribution of PuS on the (1 ¯ 1 0) plane (contour range: 1.0 to 15.0 e/˚ A3 , contour interval: 3 ˚ 0.7 e/A ).
peaks of Sr, Ba and Pu and the sulphur peaks. The bonding electron distribution is also visible, but the fine details of the bonding can be seen in figure 3b. This figure shows that SrS has a very flat distribution along the mid-bond region and the density value is also very near to zero. BaS shows slightly enhanced shallower midbond density distribution. PuS shows relatively higher mid-bond density value and a small hump, which might be due to the covalent nature of the bonding. Figure 3c shows a magnified view of the mid-bond regions where the magnitude of the density values can be understood. These electron densities along [1 1 1] direction indicate that PuS has more mid-bond electron density indicating less ionicity compared to the other two sulphides studied in this work and SrS is found to be highly ionic. The mid-bond electron densities at the saddle points have been given in table 4 from which one can see that the PuS has highest density at a distance of 2.39 ˚ A, whereas BaS and SrS have saddle densities at 2.24 ˚ A and 2.12 ˚ A respectively. The metallic radii of Sr and Ba are reported to be [19] 2.243 ˚ A and 2.151 ˚ A respectively. Our values are in excellent agreement with the reported radii, justifying the current electron density distributions and the proposed bonding nature.
Pramana – J. Phys., Vol. 66, No. 6, June 2006
1063
R Saravanan
Figure 3. (a) One-dimensional high electron density distribution of SrS, BaS and PuS along the [1 1 1] direction. (b) One-dimensional low electron density distribution of SrS, BaS and PuS along the [1 1 1] direction. (c) One-dimensional high electron density distribution of SrS, BaS and PuS along the [1 1 1] direction showing mid-bond densities. Table 4. Mid-bond electron densities of the three sulphides SrS, BaS and PuS. System SrS BaS PuS
Position (˚ A)
Electron density (e/˚ A3 )
2.12 2.24 2.39
0.0033 0.0607 0.5844
4. Conclusion In this work, a precise study on the electron density distribution and bonding in the three sulphides SrS, BaS and PuS has been carried out using powder X-ray data. The results of the present work are comparable to the results obtainable using precise single crystal data sets. A better understanding of the bonding through the mid-bond electron densities has been obtained in this work, limited to the data quality. The radii of the metal atoms obtained in this work are highly comparable to the corresponding reported values. The applicability of the MEM method to powder data sets has been validated through the present results. It is worthwhile
1064
Pramana – J. Phys., Vol. 66, No. 6, June 2006
Electron density distribution in sulphides to study more crystalline systems for electron density distribution using powder data sets. Acknowledgements The author acknowledges the CSIR (Council of Scientific and Industrial Research) for the financial assistance provided through the research project scheme number 03(0949)/02/EMR-II. References [1] N K Hansen and P Coppens, Acta Crystallogr. A34, 909 (1978) [2] R D Poulsen, A Bentien, T Graber and B B Iversen, Acta Crystallogr. A60, 382 (2004) [3] D Marabello, R Bianchi, G Gervasio and F Cargnoni, Acta Crystallogr. A60, 494 (2004) [4] R Saravanan, Y Ono, M Isshiki, K Ohno and T Kajitani, J. Phys. Chem. Solids 64, 51 (2003) [5] S Israel, R Saravanan and R K Rajaram, Physica B349, 390 (2004) [6] S Israel, R Saravanan, N Srinivasan and R K Rajaram, J. Phys. Chem. Solids 64, 879 (2003) [7] S Israel, R Saravanan, N Srinivasan and R K Rajaram, J. Phys. Chem. Solids 64, 43 (2003) [8] R Saravanan, S Israel, S Swaminathan, R Kalidoss and M Muruganantham, Cryst. Res. Technol. 37, 1310 (2002) [9] R Saravanan, S K Mohanlal and K S Chandrasekaran, Acta Crystallogr. A48, 4 (1992) [10] K Balamurugan, R Saravanan, K Asharamani, P Manimaran, S Mariyappan, N Srinivasan, Y Ono, M Isshiki and T Kajitani, J. Crystal Growth 250, 382 (2003) [11] T Kajitani, R Saravanan, Y Ono, K Ohno and M Isshiki, J. Crystal Growth 229, 130 (2001) [12] M Sakata and M Sato, Acta Crystallogr. A46, 263 (1990) [13] T Saka and N Kato, Acta Crystallogr. A42, 469 (1986) [14] S Yamamura, M Takata, M Sakata and Y Suguwara, J. Phys. Soc. Jpn. 67, 4124 (1998) [15] T Ikeda, M Takata, M Sakata, J Waliszewski, L Dobrzynski, S Porowski and J Jun, J. Phys. Soc. Jpn. 67, 4104 (1998) [16] K Yamamoto, Y Takahashi, K Ohshima, F P Okamura and K Yukino, Acta Crystallogr. A52, 606 (1996) [17] FULLPROF, Rietveld, profile matching and integrated intensities refinement of Xray and/or neutron data (powder and/or single-crystal), Version 3.5d, Oct98-LLBJRC, JuanRodriguez-Carvajal, Laboratoire Leon Brillouin (CEA-CNRS) – Originally developed from the program by D B Wiles and R A Young, J. Appl. Cryst. 14, 149 (1981), (DBW3.2S, Versions 8711 and 8804) [18] D M Collins, Nature (London) 298, 49 (1982) [19] E Teatum, K Gschneidner and J Waber, Compilation of calculated data useful in predicting metallurgical behaviour of the elements in binary alloy systems, LA-2345 (Los Alamos Scientific Laboratory, 1960)
Pramana – J. Phys., Vol. 66, No. 6, June 2006
1065