Proceedings of the 4th Ulcos seminar, 1-2 October 2008
SP13 - New Electricity-based Steel Production / n°5-8
Application of Modeling to the Development of an Electrochemical Pilot Cell Antoine Allanore1, Wen Xuan2 and Hervé Lavelaine1 ArcelorMittal R&D, 1 Industrial Operations & 2 Packaging, Maizières-lès-Metz, France
[email protected] The hydrodynamics in an electrolysis pilot-cell has been modelled with the aim of upscaling the direct iron production process based on the alkaline electrolysis of an iron oxide suspension. Two dispersed phase flow involved in this three-phase process have been evaluated: the solid and the gas phase hydrodynamics. The suspension flow characteristics are evaluated from existing litterature, and available correlations are applied to the case under study. The minimum velocity required for transportation of finely ground iron oxide along the cathode surface is fairly low, in the laminar regime, corresponding to minimum pressure drop. The behaviour of the oxygen phase produced on the anode is evaluated in at two scales. First, the trajectory of a single bubble sliding on the anode is depicted, predicting possible rising or dragging of the bubbles as a function of its diameter. The gas-phase pattern is then studied from litterature results for gas-liquid flow in pipes. A separation of the gas phase from the liquid is predicted, the lightest phase being in contact with the upper part of the cell. Obtained results confirm the potential of the selected design for transportation of particles and gas recovery with low energy consumption.
of energy transferred in an electrochemical cell is electricity, a configuration with coplanar electrodes has been selected [ 2 ]. From existing technologies and practical aspects, parallel electrodes surfaces has been preferred to concentric cylinder configuration.
Introduction In the track for low Greenhouse Effect Gases processes for steelmaking, electrolysis is considered as a possible solution as electricity is an energy form that can reduce iron ore to metal through processing routes similar to those already applied in other industries such as aluminium. Production rate for steel requires the development of new electrolysis technology, and more specifically innovation in terms of electrolysis cell to handle large flow of current, reactants and products.
A cell for suspension electrolysis? The use of a suspension for electrolysis has not reached a high degree of technological development, and looking at classical textbooks, one cannot gather any knowledge on such process. However, suspension handling is commonly encountered in industries, and a large amount of literature is available on this subject [ 3 , 4 ]. For iron oxide electrolysis, the hematite starting phase is an insulator and its accumulation on the cathode induces ohmic overvoltage, lower faradaic efficiency and inhomogeneous deposit growth [5]. Ideally, the specific flow-rate of particles toward the cathode should be equal to their rate of electrochemical consumption. For first modeling of phenomena, the experimental optimum operational parameters previously determined on rotating-disk electrode have been chosen as starting conditions:
Promising laboratory-scale results have been obtained thanks to a low temperature aqueousbased process (50wt% NaOH-H2O at 100°C) [1]. The alkaline process under consideration for iron has two specificities: the electrolyte contains solid particles reacting on the cathode; and oxygen is evolved at high production rate on the anode. With the aim of developing a pilot-cell representative of industrial conditions, these two aspects have been taken into consideration in the cell design. by modeling of the key physical phenomena that govern these dispersed phase behavior in liquid flow. Though the obtained equations are often too complicated for simple “on the desk” numerical calculations, simplification and correlations based on experimental results are helpful to evaluate the most important parameters and depict phenomena.
-
Gas
10 µm particles 13 vol. % of particles 50 wt% NaOH electrolyte at 110°C
behavior in electrolysis cell. In the aluminium electro-smelting the cell configuration is horizontal and the anode is above the cathode. The carbon dioxide evolving from the anode moves, owing to gravity, upward in the electrolyte and is recovered by a hooding system. A small underpressure is maintained by suction, the flow is about 5000 m3.h-1 of fumes per cell.
Background Broad design of the electrolysis cell. To conduct a reaction in optimized energetic conditions, uniform transfer of involved physical quantities must be realized (heat, electricity, flow etc…). As the main form
1
In the chlorine-alkali, the tightness of the cell is obtained thanks to a plastic film, this relatively simple mean being possible by the below pressure functioning of the cell. The process operates at slight depressurisation, -15 to -100mmH2O. Alternative processes, such as membrane or diaphragm operate at over pressure, this creates smaller bubbles which save energy, but it relies on the availability of high quality gaskets.
W=0.15m L=0.66m
FLOW
Anode
Cathode
The anode is composed of parallel stalks which cross section has evolved with time, initially it was mesh then rod, in the 70-80’s the runner type was used, and now it is the SLM:
α=45°
h=0.02m
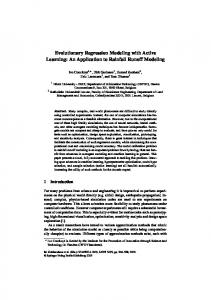
Figure 1. The electrolysis cell considered as a rectangular duct mesh
rod
runner
The available cross-section (S) for liquid and gas flow in the cell is:
SLM
The anode is designed in order to create a gas lift by bubbles coalescence, for this purpose a chimney effect is produced by a proper position of plates over the parallel stalks.
S=h.W=3x10⁻³ m² The equivalent hydraulic diameter (dh) is: dh =
In metal electrowinning, the developed technique is a physical separator between electrodes such as a membrane or a diaphragm. This introduces additional equipment in the cell and complexifies the operation of the cell. The gas lift is not used to improve the agitation of the electrolyte. Chlorine is evolved with a faradic efficiency as high as 99% with competing oxygen evolution and enclosed in a diaphragm maintained at slight vacuum -70 to -80 mmH2O. The anolyte, electrolyte in contact with the anode, undergoes degassing to remove soluble chlorine. Large vessels in titanium are dedicated to this operation; they are based on gas blowing.
a- A gravity induced flow Gravity is beneficial for the alkaline suspension electrolysis process, either to obtain the particles transfer to the cathode or the oxygen bubbles removal from the gap. But gravity can also be effectively used in a process to induce flow of a fluid, specially solids and liquids. Considering a tilted channel as depicted in Figure 1, the hydrostatic pressure is given by: ⎛ ΔP ⎞ = − ρ ⋅ g ⋅ sin α ⎜ ⎟ ⎝ l ⎠ hydrostatic
Results
and the pressure drop
From the selected broad design, a “first-approach” type of modeling has been conducted to evaluate the range of fluid velocity needed to obtain the desired flow of particles on the cathode. A second point of study is dedicated to the modeling of the gas-liquid flow in the selected configuration, to evaluate the possible immediate gas recovery from the anode.
[6]
:
4ρ ⋅ u 2 ⎛ ΔP ⎞ = Cf ⋅ L L ⎜ ⎟ dh ⎝ l ⎠dynamic
with ⎡⎛ 8 ⎞12 ⎤ 1 Cf = ⎢⎜ ⎟ + 3 ⎥ ⎢⎣⎝ Re ⎠ (A + B ) 2 ⎥⎦
A cell with well-defined solid-liquid flow
1 12
16
⎡⎛ 7 ⎞0.9 Ru ⎤ A = −2.457 ⋅ ln ⎢⎜ ⎟ + 0.27 ⎥ d h ⎦⎥ ⎣⎢⎝ Re ⎠
The electrolysis cell operation must be realized in steady-state and guarantee no accumulation of particles on the cathode, this being obtained with minimum energy expenses. The basic monophasic hydrodynamic feature of the cell under development is first evaluated. Then, available literature results on suspension flow are presented, the application of which is proposed in the last section. In this part, the cell is considered as a closed rectangular duct, and correlations and results obtained for pipes are applied using the concept of equivalent hydraulic diameter. The electrolysis cell considered has the dimensions given in Figure 1.
A. Allanore, W. Xuan and H. Lavelaine.
4 ⋅ Section 2 ( W ⋅ h) = = 3 .5 ⋅ 10 − 2 m Perimeter ( W + h)
⎛ 37530 ⎞ B=⎜ ⎟ ⎝ Re ⎠
16
The maximum velocity of the fluid, reached when those pressures balance each other, is evaluted by: uL =
ρ ⋅ g ⋅ sin α ⋅
dh 1 4 ρ L Cf
The corresponding variation of the fluid velocity with the angle (α), for a 150 mm width and 20 mm height duct, is presented in Figure 2.
2
SP13 – ULCOS-4, October 2008
axis of the pipe. Under specific circumstances, the concentration profile tends to approach the clear fluid velocity profile. In this regime, no particle remains on the bottom of the pipe. - Asymmetric suspension. When the mixture velocity is decreased, a distortion of the concentration profile is observed, especially for the largest particles, being more concentrated in the lower half of the pipe. This flow pattern persists as the velocity is lowered, until some of the particles remain on the bottom of the pipe. - Moving bed pattern. Below the velocity at which all particles that strike the wall bounce back into the flow stream, particles tend to accumulate on the bottom of the pipe. They first accumulate in the form of separated “dunes” and then as a continuous moving bed. The dunes or the bed move along the pipe more slowly than the liquid. - Stationary bed pattern. As the mixture velocity is further reduced, the lowermost particles of the bed become nearly stationary, the bed thickens and its motion occurs because of the uppermost particles tumbling over one another (saltation). As a result, the cross section is reduced. Eventually, pressure gradient to maintain the flow increases very rapidly and blockage of the pipe may occur.
3
-1
Fluid velocity (m.s )
2.5 2 1.5 1 0.5 0 0
20
40 60 80 Inclination angle (deg)
100
Figure 2. Variation of the velocity of a sodium hydroxide – water electrolyte, flowing under gravity in a channel (0.001 relative rugosity) as a function of the angle
One notices that large velocity can be obtained, e.g. higher than 0.5 m.s-1 for an angle as little as 2°. This consideration means that an electrolysis cell can be a gravity induced-flow cell with a large range of operating electrolyte velocities.
Transition Velocities [7]
b- Evaluation of the minimum velocity and the pressure-drop needed for suspension transport
The transition takes place from one flow pattern to another as the average mixture velocities (VMi) reaches the following values:
The flow behaviour of a fluid-solid system in a horizontal pipe depends on the basic physical properties of the solid and the fluid, relative amounts of the solid and the fluid, size and shape of the solid particles and also the velocity of the mixture.
Target domain Pipe
Definitions [7]
0
Four flow patterns for suspension flow are typically observed, presented in Figure 3 in a sequence of decreasing mixture velocity.
Stationary Moving bed VM4
VM3
Asymmetric
VM2
VM1
Symmetric suspension
Flow
The concept of these four transition velocities is rigorously applicable to suspensions close to monodispersion in particles size. For the suspension electrolysis cell VM2 is the target velocity to avoid the formation of bed on the bottom of the pipe. The purpose is that most of the particles could be transported through the cell and there is, ideally, permanently only one layer of hematite particles on the cathode. The necessary velocity to attain this condition is quite close to VM2 although it is not exactly equivalent. Six correlations have been gathered in literature to evaluate the second transition velocity.
Symmetric
Asymmetric
Moving bed
1) Durand (1953) [8]. On basis of experiments with pipe diameters in the range D=1~70cm, concentration of solid Cs=50~600g/L, and particle diameter d=20~100000μm, Durand obtained the following correlation:
Stationnary bed
VM 2 = FL [2 gD (s − 1 )]
0 .5
Figure 3. Flow patterns for suspension flow in pipes
- Symmetric suspension. For high mixture velocities,
where s is the density ratio between the solid and the liquid. In this correlation, FL can be determined from a graphic if Cs and d are known.
fine or medium-sized solid particles are fully suspended and symmetrically, although not necessarily uniformly, distributed on both sides of the horizontal
A. Allanore, W. Xuan and H. Lavelaine.
3
SP13 – ULCOS-4, October 2008
2) Shook (1969) [ 9 ]. Shook and Daniel remarked
ous suspension. With results of gravel (5-13mm), manganese dioxide (3mm) and coal (3-5mm), they proposed:
that it could be erroneous to use Durand’s correlation because the dimensionless factor FL is only established for sand-water system. Furthermore, it is not applicable if the volume fraction of solid is high (above 0.15). The F factor is also hardly determined for very small particles (less than 10 μm). In order to predict the Durand’s factor FL quantitatively, Durand and Condolios ran experiments for D=0.025~0.35 m and d=25~38 μm, leading to
i − iw gD = 66(s − 1) 2 C s iw V It appears that this equation applies both to sliding bed flow and to flow by saltation. They also studied the pressure drop of a flow by saltation or with a moving bed. With results of perspex (0.5-3.2mm), sand (0.5mm) and coal (1.6mm) they obtained:
FL = 2.43C1s / 3 C D−0.25
i − iw gD V = 1100(s − 1) 2 0 C siw V V
where CD is drag coefficient of a single particle[7]
CD =
24 μ when dV0 ρ < 1 dV0 ρ
⎛ dV ρ ⎞ C D = 30⎜⎜ 0 ⎟⎟ ⎝ μ ⎠
This equation is applicable to all materials travelling as heterogeneous suspensions. Thus, the second transition velocity must correspond to the intersection of both the above two equations:
−0.625
when 1 < dV0 ρ < 1000
VM2=17V0
C D = 0.44 when dV0 ρ > 1000
5) Sinclair (1962) [12]. This correlation was set from
experiments of suspensions in D=13-25mm pipes with particles of d=30~2000μm. Sinclair claimed that VM2 is dependent upon concentration and that a maximum value of VM2 occurs at intermediate concentrations in the range of 0.05 to 0.20. The maximum value of VM2 can be obtained by:
Here, V0 is the terminal settling velocity of a single particle, which describes the velocity that particles attain when the drag force is counter balanced by gravitational force in quiescent liquid.
V0 =
g( ρ P − ρ )d2 for dV0 ρ < 1 (Laminar) 18 μ
[
( VM2 ) max = 650gd85 (s − 1) 0.8
0.72
⎡ (ρ − ρ ) ⎤ d1.18 for V0 = 0.20 ⎢g P ⎥ ρ ( μ / ρ ) 0.45 ⎣ ⎦ 1 < dV0 ρ < 1000 (Transition) ⎡ (ρ − ρ )⎤ V0 = 1.74 ⎢g P ρ ⎥⎦ ⎣
6) Spells (1955) [13]. This correlation was set up from a synthesis of the results of earlier literature:
d0.50 for
2 M2
V
dV0 ρ > 1000 (Turbulent) 1/2
ΔP − ΔPF L L = i − iF ΔPF iF L
VM2 CD C sDg(s − 1)
According to Zandi & Govatos, saltation occurs when N1≤40. At N1=40, VM is then is equivalent to VM2:
VM2
with i the pressure gradient of the suspension and iF the pressure gradient of the carrier fluid. The pressure gradient in the cell can then only be evaluated from the pressure gradient of a carrier fluid in a pipeline, which has been presented in previous paragraph. Various correlations are available to evaluate the extra pressure drop for suspension in horizontal flow [7].
1/2
4) Newitt et al. (1955) [11]. Newitt and coauthors studied the pressure drop of a flow as a heterogene-
A. Allanore, W. Xuan and H. Lavelaine.
gd(s − 1)
Most of the correlations are in form of an excess pressure drop between suspension and carrier fluid:
tos re-examined Durand and Condolios’s data, plus data from other workers, and proposed an index N1 which indicates the flow patterns:
⎡ 40C s Dg(s − 1) ⎤ =⎢ ⎥ C D0.5 ⎣ ⎦
0.775
Evaluation of the pressure drop for suspensions flow in pipes
3) Zandi and Govatos (1967) [10]. Zandi and Gova-
N1 =
⎡ DV ρ ⎤ = 0.0251⎢ M2 M ⎥ ⎣ μ ⎦
Spells also studied the « standard velocity », which identifies the transition when the pressure gradient approaches the equivalent true fluid value and eventually becoming identical with it.
Shook and Daniel then obtained:
VM2
0.5
where d85 is particle diameter such that 85 percent by weight of particles are of d0.05.
i − iw = 6.3(C sN1 ) −0.354 , C sN1 > 10 iw i − iw = 280(C sN1 ) −1.93 , C sN1 < 10 iw N1 =
2 M
V
CD
C SDg(s − 1)
Table 1. Transitions velocities for the reference suspension
4) Hayden & Stelson (1968) [15]. Their correlation is
It seems difficult to determine the first transition velocity because of large discrepancies between authors. However, a fair agreement is obtained for the 2nd transition velocity, which can be evaluated between 0.08 and 0.10 m.s-1, considering correlations obtained for the closest experimental conditions (pipe diameters around 3 times larger and a factor 2 density difference for Spells, particle diameter of millimetre range for Newitt).
used for asymmetric suspension of fine and coarse sand and fine gravel in a pipe of D=25-51mm. It was deduced from Durand’s equation. It is applicable when VM>0.05.
⎡ gD(s − 1) V0 ⎤ i − iw = 100 ⎢ 2 ⎥ C siw ⎣⎢ VM gd(s − 1) ⎦⎥
1.3
The influence of the particles diameter on VM2 is presented in Figure 5, for a volume fraction of solid set at 12.2%.
A. Allanore, W. Xuan and H. Lavelaine.
5
SP13 – ULCOS-4, October 2008
4
10
10
Durand Zandi & Govatos Newitt Sinclair Spells
-1
Pressure drop (Pa.m )
-1
(m.s )
1
V
M2
0.1
0.01
moving bed/ stationary bed/ blockage
homogeneous suspension
transition
1000
100 Monophasic Durand & Condolios
10
Zandi & Govatos Hayden & Stelson Newitt
0.001
1 -6
10
10
-5
-4
10
10
-3
0
0.1
solid on VM2 is presented in Figure 5, for a particle diameter set at 10 μm.
1
0.1 1
(m.s- )
Durand Zandi & Govatos Newitt Sinclair Spells
M2
V
0.6
0.7
The pressure gradient of the pure carrier fluid (without particles) increases with the average velocity. Besides, it is logically always smaller than the pressure gradient for suspension flow. As for the clean fluid, the pressure gradient has two regimes. At a transition velocity of about 0.16 m.s-1, the pressure gradient attains its minimum. When the average velocity is higher than the transition velocity, the pressure gradient tends to a limiting value, which is the pressure gradient of the fluid. If the flow is high enough, the influence of solid on energy needs for particle transport is negligible. When the average velocity is lower than the transition velocity, the pressure gradient increases significantly with the decrease of the average velocity. This phenomenon is due to the deposition of particles on the pipeline.
Influence of volumic fraction of solid on the second transition velocity. The role of the concentration in
0.001
The influence of particles diameter and volume fraction on the pressure gradient. The variation
0.0001 0.2 0.3 0.4 Solid Volumic Fraction
0.5
Figure 6. Pressure drop for hematite suspension flow.
In fair agreement with the common understanding of the fundamental role of gravity forces, the second transition velocity increases significantly with the increase of the particle size. For particles larger than 100µm, the influence of the particle diameter is becoming less important.
0.1
0.4
Average Mixture Velocity (m.s )
Figure 4. Influence of particles size on VM2
0
0.3
-1
Particles Diameter (m)
0.01
0.2
0.5
of the pressure gradient with particles diameter is presented in Figure 7 for an average velocity of 0.3 m.s-1 and 12.2% volumic fraction of solid.
Figure 5. Influence of the particles volumic fraction on VM2
According to Zandi & Govatos and Durand, VM2 slightly increases with the rise of the volume fraction of solid. However, according to Newitt, Sinclair, Spells and Shook, there is no influence of volume fraction of solid on VM2. These results suggest that the key phenomenon governing the critical velocity is not viscosity-related, at least for the material used to build the correlation: viscosity of colloidal suspensions usually increases as an exponential function of the volumic fraction.
5
10
4
10
-1
-1
dP at 0.3 m.s (Pa.m )
Durand & Condolios Hayden &Stelson Zandi & Govatos Newitt
Variation of the pressure gradient with the average velocity [7]. The calculated pressure gradient at dif-
3
10
2
10
ferent velocities is presented in Figure 6, for 10µm particles diameter a 12.2% volume fraction of solid.
-6
10
10
-5
10
-4
-3
10
Particles diameter (m)
Figure 7. Influence of particle diameter on pressure (VM=0.3 m.s-1)
A. Allanore, W. Xuan and H. Lavelaine.
6
SP13 – ULCOS-4, October 2008
The pressure gradient of a suspension increases significantly with the rise of the particle diameter.
c- Single oxygen bubble trajectory on the anode.
The influence of volume fraction of solid on pressure gradient is presented in Figure 8 for 10 μm particles diameter.
In this section, the cell configuration is simplified and considered as made of plane anode facing a plane cathode (Figure 10), in which a Poiseuille flow at average liquid velocity uL is established between the electrodes.
75 Durand & Condolios Hayden & Stelson Newitt
65
anode
60
laminar flow profile at uL
-1
-1
dP at 0.3 m.s (Pa.m )
70
55 50 45
cathode
40 35
gap 2cm 0
0.1
0.2
0.3
0.4
0.5
Figure 10. Model of the electrolysis cell considered as a closed 2D- duct
Solid volumic fraction
Figure 8. Influence of volume fraction of solid on pressure gradient at Vm=0.3 m.s-1.
As described below:
The pressure gradient of the suspension is only slightly modified by an increase of solid volume fraction, in fair agreement with the influence of this operational parameter on critical velocity for suspension flow.
Influence of cell-inclination on the pressure gradient.
Figure 9 summarizes the role of inclination of the cell according to the most recent selected correlation. 1000 Durand & Condolios
ρ D VD
Hayden & Stelson
100
Symbol
Name
Equation
FE
Virtual mass
FE = CE ρC VP
T
Drag
T = Cx
0°
dP -dP
45°
(Pa)
Zandi & Govatos Newitt
du C duD = ρ C VD + FE + T + FV + FA dt dt
10
1 0
0.1
0.2
0.3
0.4
0.5
duCD dt
πd2 ρC uCD uCD 4
FV
Gravity
FV = G =
FA
Buoyancy
FA =
πd3 6
2
πd3 6
gρD
gρC
-1
Mixture Velocity (m.s )
Figure 11. Simplified forces balance on oxygen bubble in Poiseuille flow
Figure 9. Variation of the pressure drop with pipe inclination according to Wilson, from 0 to -45°
One can calculate single bubble trajectory, originally located on the anode surface, from a simple force balance depicted in Figure 11, as a function of two parameters: its diameter and the liquid flow rate. This model does not take into account the surface tension phenomena because experimental parameters are too scarce to support a useful modeling. The lift force was also discarded from this model.
If the average velocity of the flow is low, the pressure drop can decrease significantly if the pipe slope is 45°. However, if the average velocity of the flow is high, the diminution of the pressure drop is not important. The velocity corresponding to the lowest pressure gradient of a horizontal pipeline is nearly not changed when the pipeline is inclined.
A. Allanore, W. Xuan and H. Lavelaine.
7
SP13 – ULCOS-4, October 2008
The complete set of equations is described in Appendix 2, and only the results of the calculations are presented hereafter. The set of equations obtained is projected on each axes and can be solved thanks to a Runge Kutta 4th order method. The results obtained thanks to this model is that a critical diameter exists above which, thanks to the buoyancy force, the bubble is rising against the liquid flow, as depicted in Figure 12.
Ufluid= 0.1 m.s-1
DRAG
Ux (m.s-1) RISE
-1
Average liquid velocity (m.s )
1
0.1
time (s) ANODE
0.01
0.001
0.0001 -6 10
Y (m) -5
-4
10 10 Bubble diameter (m)
-3
10
Figure 12. Liquid critical average velocity corresponding to single bubble's direction change in Poiseuille flow
X (m)
The role of the bubble growth due to its contact with the anode under the electrochemical reaction can be taken into account in the model by considering that whatever the bubble diameter, it sticks to the anode: as a matter of fact, the dragging by the pure laminar flow does not give a normal flow-component to the bubble (cf. force labeled T in Figure 11) and the rising of the same bubble due to gravity maintain its trajectory along the anode. The modeling then does not consider the y-component of the bubble movement equation.
Figure 13. Single oxygen bubble trajectory at the upper surface of a duct with Poiseuille flow at 0.1 m.s-1 average velocity
The bubble is first dragged-down by the fluid, being too small to generate buoyancy force that counterbalances the drag-force. While growing in diameter due to electrolysis, it reaches the critical diameter for which buoyancy is governing its trajectory. t=0 First 1.5 seconds
Under such assumptions, the bubble grows at the rate predicted by the faraday law:
t=1.5 s ΔX= 300µm
plain anode
d=120µm
After 1.5 seconds
d=
t=0
RTj ⋅ t = 8.13 × 10− 8 ⋅ j ⋅ t 4FP
t=1.5 s
The corresponding bubble trajectory is presented in Figure 13. Figure 14. Single bubble story on the anode at 0.1 m.s-1 average liquid velocity
Under such model, and for a liquid average velocity of 0.1 m.s-1, each oxygen bubble will grow and slides down the anode for 1.5 sec, until it reaches a 120µm
A. Allanore, W. Xuan and H. Lavelaine.
8
SP13 – ULCOS-4, October 2008
diameter for which it will slide in the opposite direction, still growing on the anode. The bubble will then have moved down for 300 µm before changing direction.
1 Gas to liquid flow rate ratio
j=500 A.m-2
d- Two phase flow: the interelectrode space as a rectangular duct. The electrolysis cell is then considered as a closed duct, as in the case of the suspension flow modeling. Evaluation of the gas fraction in the interelectrode space.
j=1000 A.m-2 j=3000 A.m-2 j=5000 A.m-2
0.1
0.01
0.001
Definitions and order of magnitude of flowrates. The superficial gas velocity is the volumic gas
0
u G (x ) =
0.2
0.3
Q Gx A
As the liquid flow rate is always at least four times more important than the gas flow-rate, the assumption that the liquid velocity is not affected by such low gas flow rate in the cell is made.
The electrolysis cell case: a model.
Q Gx
αxA αx
j O2 S RT 4F P
what corresponds to the gas-flow rate and equivalent gas layer growth rate (assuming accumulation in the interelectrode space) presented in Table 2.
Parameters
Current
Gas flow rate
Gas layer
density
in the cell
growth rate
-2
P: 101325 Pa
0.5
Figure 15. Variation of the ratio between the gas and the liquid flow-rate with current density
In the cell configuration, the gas-flow rate in the interelectrode space is evaluated thanks to: QG =
0.4
Inlet liquid velocity (m.s )
The real gas velocity is the volumic gas flow-rate divided by the cross section occupied by the gas phase (αxA) where α is the volume void fraction of gas.
u G (x) =
0.1
-1
flow-rate divided by the pipe cross-section (A):
3
-1
(A.m )
(m .s )
(µm.s -1)
500
4x10⁻⁶
40
-6
80
T: 383.15 K
1000
8x10
R=8.314 usi
3000
2x10⁻⁵
240
F=96485 C
5000
4x10⁻⁵
400
x x+dx Figure 16. Elementary volume for balance on the gas phase
At each x position, the oxygen gas produced in the elementary volume is written as follows, assuming ideal gas law can be applied: 1 RT j ⋅ W dx 4 P F
By introducing local void fraction, αx, and gas phase velocity uG, the gas balance on the control volume leads to the following equation: h ⋅ W ⋅ u G (α x + dα x ) − h ⋅ W ⋅ u Gα x =
Table 2. Influence of current density on the gas flow-rate
The liquid flow rate is evaluated as the product of the liquid inlet velocity by the cell cross-section:
what gives, assuming dx is small enough to have uG constant on the elementary volume:
QL = uL ⋅ h ⋅ W
eq. 1
The corresponding variation of the gas to liquid flow rate ratio with the current density is presented in Figure 15:
A. Allanore, W. Xuan and H. Lavelaine.
1 RT j ⋅ Wdx 4 FP
9
u G dα x =
1 RT j ⋅ dx 4 FP ⋅ h
SP13 – ULCOS-4, October 2008
Evaluation of the void fraction. In fact, uG
RTj x
uG =
depends on αx along the cell:
1 uL = e 4FPh uL uL = e 1 − αx
0 ≤ x ≤ 1m
αx QG = QL 1 − αx uG =
eq. 3
uG =
0.01 ≤ uL ≤ 3m / s 0≤
QG α uL = A 1−α
QG 1 = u αxA 1 − αx L
uL
0
dα x = x
uL ≈ uL
Superficial gas velocity. The superficial gas velocity is evaluated from eq. 3, calculated here for 1000 A.m-2:
x
1 RT j dx 4 FPh ∫0
−
RTj x
αx 1 − e 4FPh u uG = uL = uL = (e RTj x − 1 − αx 4 FPh u L
e
Therefore:
4.1×10 −3 x uL
− 1)uL
L
Using Taylor Series:
αx = 1− e
eq.4
RTj x − 4FPh uL
= 1− e
4.1×10 −6 jx − uL
∞
f (a) = ∑ n= 0
The void fraction of gas depends on the position x and the velocity of liquid uL. The corresponding calculation for 1000 A.m-2 current density with a 2cm gap is presented in Figure 17.
x
e
4.1×10 − 3 x uL
u G = (e uL=0.05 m.s-1 uL=0.1 m.s-1 uL=0.3 m.s-1 uL=0.5 m.s-1
0.8
x2 x3 + + ... 2! 3! 2
= 1+
4.1×10 − 3 x uL
3
4.1 × 10 −3 x 1 ⎛ 4.1 × 10 −3 x ⎞ 1 ⎛ 4.1 × 10 −3 x ⎞ ⎟ + ⎜ ⎟ + ... + ⎜⎜ ⎟ ⎟ uL uL ! ⎜⎝ uL 2! ⎝ 3 ⎠ ⎠ − 1)uL ≈
4.1 × 10 −3 x uL uL
∴ u G ≈ 4.1× 10 −3 x
The superficial gas velocity is therefore independent of the liquid velocity and proportional to the position in the cell.
0.6
Conclusion. The gas fraction in the pilot cell considered is very low due to the low current density of the process. This conclusion could be different for longer cells or higher current density, the key parameter being undoubtedly the last parameter. The bulk liquid and gas phase have little interaction in the cell under evaluation, and the behavior of the gas bubbles should not lead to their dispersion in the overall cell due to the liquid flow. This can be evaluated thanks to the gas-liquid flow study in internal flow at very low gas fraction. One notices that for the 1000 A.m-2 current density, seen today as nominal current density for the iron electrowinning process, a plane cell of 10 meters length will contain 30% of gas accumulated, for 0.1 m.s-1 velocity (value chosen as minimum velocity for suspension transport in the cell in previous section).
0.4 0.2
1
f (n) (a) ( x − a) n n!
e = 1+ x +
1
Void fraction
≤ 1.0009
4.1×10 − 4 x uL
The real gas velocity is therefore equal to the liquid velocity and the slip ratio is null.
1 RT x − ln(1 − α x ) = j 4 FPh uL
0
4.1×10 − 4 x uL
uG = e
uL 1 RT dα x = jdx 1 − αx 4 FPh
∫1−α
4.1 × 10 − 4 x ≤ 9 × 10 − 4 uL
1≤e
Applying this equation in the volume balance eq. 1:
αx
uL
For a maximum liquid velocity of 3m.s-1, in the cell of 0.66 m length:
QG αx = Q G + QL
eq. 2
4.1×10 −3 x uL
10
100
Cell length (m)
Figure 17. Variation of the gas fraction in the cell considered as a closed duct. In legend, the liquid velocity in m.s-1
The resulting gas fractions confirm that the volume of gas in the pilot electrolysis-cell under consideration (0.66 m length) is small compared to the volume of liquid. Therefore the hypothesis that the liquid velocity does not change in different positions of the pipe due to the gas presence is reasonable.
Flow-pattern prediction
In this simplified configuration, the issue of oxygen gas phase behavior is reduced to the case of a two-phase flow study. Though this assumption is a clear simplification of the real electrolysis cell con-
Real gas velocity. The real gas velocity is evaluated from the liquid velocity, from eq. 2 and, eq. 4, exemplified here for 1000 A.m-2:
A. Allanore, W. Xuan and H. Lavelaine.
10
SP13 – ULCOS-4, October 2008
figuration, prediction of the exact behavior of the gas phase in such case is not that obvious, especially because the gas fraction involved in the cell is very small, at least for reasonable current densities.
One therefore concludes that for the range of liquid velocity potentially used in the electrolysis cell (0.005 to 0.5m.s-1), the liquid flow direction will not be changed due to the gas phase.
Literature results. As many chemical industries handle gas-liquid internal flow, such configuration has frequently been experimentally studied. The experiments are conducted with accurate measurements of each phase input flow-rate; and observations (transparent walls) or measurements (e.g. thanks to conductivity probes) of the resulting gas hold-up, phase distribution and interface aspects.
The only flow direction considered hereafter for the liquid is then downward. ii)
The gravity force acting on the dense liquid phase induces a downward flow of the liquid. But the issue of a possible entrainment of the gas phase, called dragging, by the liquid has to be evaluated.
Most results presented in this paper are those representatives of the electrolysis cell configuration, i.e. in 45° inclined pipes with the liquid flowing down the cell. This configuration corresponds to the one used for example in chemical extraction or some gas-liquid reactors. The first question arising when studying gas-liquid flow is the one related to the direction of both phases flow: are they in co-current or in counter-current? Then, once both phases directions are known, existing observations can be applied to predict the flow-pattern. i)
The field of boiling water on heated surfaces in internal flow (Thorncroft [ 18 ]) provides interesting pictures of what could be the flow direction of bubbles which nucleates, growths and finally slides on the heated wall. As clearly exemplified in their picture, there is a critical down flow of liquid above which the bubble is not sliding up under the effect of buoyancy anymore and dragged by the liquid. This velocity is around 0.7m.s-1 in their configuration (vertical flow). One notice, however, that their work is conducted with very low surface coverage what does not correspond to the case of the electrolysiscell (One might wonder what would be the effect of a large number of bubbles on the surface: limit bubbles movement or promote dragging?).
Evaluation of the upward co-current case.
We ignored the case of upward co-current flow of the gas-liquid mixture, as such flow is observed for very high gas flow-rate. Indeed, Zapke and Kröger [17] evaluated the minimum gas velocity needed to counter-act the downward flow of the liquid, namely the flooding. Flooding is the only physical phenomena that could lead to such upward oriented gas-liquid flow in the electrolysis cell configuration case. For tilted duct of height h and width w (hydraulic diameter dh), they correlated the 3 nondimensional numbers: 2
RiaG =
ρ G v& G gΔρ ⋅ h
2
RiaL =
ρL v& L gΔρ ⋅ dh
OhL =
Evaluation of the downward co-current case.
The studies (Barnea et al.[ 19 ]) dedicated to gasliquid flow observation with gas inlet can also lead to interesting conclusions: if one assumes that the gas phase is flowing in co-current with the liquid, i.e. downward a duct inclined at 45°, then several regimes could be obtained, as illustrated in, for the case of a horizontal pipe. Note that the so-called “intermittent regime” corresponds to slug & elongated bubble flow which are chaotically appearing on the walls of the tube in these studies.
μL2 ρL dhσ L
Stratified smooth
Through: Ri
aG
= C
1
exp( − C
2
Ri
0 .6 aL
O
0 .2 hL
Stratified wavy
)
with C1 and C2 depending on the inclination angle (β). The application of this correlation to the case of the cell under evaluation is presented in Figure 18.
Elongated bubble
Slug
-1
Gas Velocity for Flooding (m.s )
100
10 Annular
1 Dispersed
0.1
0.01 0.001
0.01 0.1 1 -1 Liquid velocity (m.s )
The flow-pattern map in velocity coordinates for 30° downward liquid flow is presented in Figure 18.
10
Figure 18. Evaluation of the gas velocity needed for flooding
A. Allanore, W. Xuan and H. Lavelaine.
11
SP13 – ULCOS-4, October 2008
persed bubble regime in the pilot-cell is therefore not predicted. iii) The predicted case: a counter current flow of gas and liquid, governed by gravity.
max. liquid velocity
The gas flow-rate is so small compared to the liquid flow-rate in the cell that, for the moderate liquid velocity range needed to handle the solid particles, the gas phase movement should mainly be governed by gravity. The overall behavior of the gasphase should therefore be similar to the one of a single bubble sliding on the anode, as depicted in the simplified model presented in the first section. One must not forget that the effect of coalescence and bubble/bubble or bubble flow interactions effect on the flow field has not be evaluated in this simple modeling approach. The most important conclusion is however that the gas-phase should be stratified from the liquid and the solid phase, avoiding any reduction of the oxygen on the cathode and limiting the increase of the ohmic drop in the cell.
Figure 18. Flow pattern map for -30° pipe inclination (5 cm diameter)
Only three main zones are observed, corresponding to a stratified-wavy interface in most of the diagram, a dispersed bubble regime for very high liquid velocity and annular regime for high gas velocity. The intermittent regime is ill-defined and corresponds to both gas and liquid high velocity.
Conclusion Very high liquid velocities of electrolyte flowing in a 45°tilted duct can be obtained under a gravity induced flow. Existing correlations for suspension flow predicted that an asymmetric flow of the liquid/solid electrolyte can be obtained at reasonable velocity, promoting the transfer of the particles toward the reacting cathode and avoiding accumulation on this surface.
For the range of gas and liquid velocity encountered in the electrolysis cell, the main predicted regime is stratified-wavy. It means that each gas bubble reaches the top of the cell (the anode side) and a continuous gas phase is obtained. The wavy term is due to the liquid flow on such lightcontinuous gas phase, as observed in rivers, where the liquid is in interaction with the atmosphere, leading to peculiar gravity-induced phenomena. Such waves issue is qualitatively evaluated thanks to the Froude number: Fr =
A divided anode configuration can be adopted to create oxygen bubbles movement toward interslats region under the simple effect of bubble growth due to faraday processes, providing diameter around 150µm is reached for the bubble. The liquid velocity must also be kept at reasonable value to enable bubble sliding.
v& L
The gas fraction in the electrolysis cell is fairly small what leads to two possible regimes for the two-phase flow: a dispersed regime or a stratified-wavy. Evaluation of the liquid velocity needed to obtain the first regime reveals that this should not be realized in the iron electrolysis cell. The second regime, corresponding to a stratification of the gas phase in the upper part of the cell, should lead to gas evacuation through the slats of the anode, providing capillary and surface tension effects are not too important.
g ⋅ cos β ⋅ hL
The wavy regime is obtained for Froude number greater than 1.5 (Barnea [19]), though mainly for high gas volume fraction (more than 0.3). This limiting case leads to a minimum velocity for wavy regime of 0.66 m.s-1 in the electrolysis cell. Such results imply that the waves should be very limited: it is difficult to imagine the size of the wave for a continuous gas layer of around 300µm, the maximum order of magnitude of electrogenerated oxygen bubbles diameter at the beginning of their sliding on the anode (cf. previous section). Another possible regime is a bubbly pattern, obtained for very high liquid velocity. However, the diameter of the pipe has then a critical role, and Barnea et al., mention the relationship: dh > 19 ⋅
Δρ ⋅ σ 2 ρL ⋅ g
which, in the case under study, leads to a minimum diameter of 0.15 m, far from the hydraulic diameter of the cell under evaluation. The existence of dis-
A. Allanore, W. Xuan and H. Lavelaine.
12
SP13 – ULCOS-4, October 2008
Appendix 2. Balance of the forces acting on a bubble generated on the upper wall of a tilted duct.
Acknowledgements Authors are grateful to Marie Simonnet for her fruitful support.
The motion of a bubble is considered to be governed by five forces introduced in Newton’s equation.
The present work is part of the ULCOS program, which operates with direct financing from its 48 partners, especially of its core members (ArcelorMittal, Corus, TKS, Riva, Voestalpine, LKAB, Saarstahl, Dillinger Hütte, SSAB, Ruukki and Statoil), and has received grants from the European Commission under the 6th Framework RTD program and the RFCS program1.
ρD VD
du duD = ρ C VD C + FE + T + FB + FV + FA dt dt
Where C indicates the continuous phase and D indicates the discontinuous phase. 9
T is the drag force: it depends on the semi2 surface of the bubble πd , the density of 4
solution ρC :
Appendix 1. Physico-chemical parameters for the 50wt% NaOH-H2O electrolyte (110°C) and the hematite suspension. Symbol
Physical means
Value
Unity
d
diameter of hematite particle
10-5
m
ρs
density of solid
5240
kg/m3
ρL
density of 33% wt. sodium dioxide solution
1461
kg/m3
ρ
global density of the suspension
1923
kg/m3
ρb
density of oxygen at 110°C 1 atm.
1.02
kg/m3
μb
viscosity of oxygen bubbles
2.10-4
kg/(m.s)
μL
viscosity of 50% wt. sodium hydroxide solution
4.4.10-3
kg/(m.s)
μ
viscosity of suspension
T = Cx
the
5.5.10
4
2
uCD is the relative velocity between the fluid and the bubble, UCD=UC-UD. 9
FV is the volumetric force, which is the gravity force in this case FA = G =
9
9
6
gρ D
πd3 6
gρ C
FE is the force of virtual mass, which concerns the part of liquid that is dragged along with the bubble. It is dependent of the density of solution ρC, volume of the bubble VP and the coefficient CE FE = C E ρ C VP
kg/(m.s)
πd3
FA is the Archimede’s force, also called buoyancy force: FA =
9 -3
πd 2 ρ C u CD u CD
duCD duD = −C E ρ C VP dt dt
FB is the Basset’s force, which is generally negligible in the case of a bubble
In fact, the acceleration of the continuous phase’s velocity is neglected in the following modelling. Thus the Newton’s equation can be simplified as:
Reynolds Number: Re= DVρ
μ
ρ D VD
Particle Reynolds: Rep= dV0 ρ μ
duD = FE + T + FV + FA dt
The situation is depicted below:
θ
Figure a1. Simplified forces balance on a bubble in an inclined pipeline
1
Priority 3 of the 6th Framework Programme in the area of “Very low CO2 Steel Processes”, in co-ordination with the 2003 and 2004 calls of the Research Fund for Coal and Steel
A. Allanore, W. Xuan and H. Lavelaine.
13
SP13 – ULCOS-4, October 2008
Two more assumptions are made to simplify the problem: • •
Therefore in the domain of our interest (10μm