Journal of Petroleum Exploration and Production Technology https://doi.org/10.1007/s13202-018-0485-9
ORIGINAL PAPER - EXPLORATION GEOPHYSICS
Application of multilayer perceptron neural network and seismic multiattribute transforms in reservoir characterization of Pennay field, Niger Delta Akindeji Opeyemi Fajana1 · Michael Ayuk Ayuk2 · Pius Adekunle Enikanselu2 Received: 21 November 2017 / Accepted: 10 May 2018 © The Author(s) 2018
Abstract Supervised multilayer perceptron neural network and seismic multiattribute transforms were applied to three-dimensional (3D) seismic and a suite of borehole log data set obtained from Pennay field, offshore Niger Delta with a view to predicting lateral continuity of hydrocarbon reservoir properties beyond well control. Four (4) hydrocarbon-bearing sands, namely, Pennay 1, 2, 3, and 4, were delineated from borehole log data. Four (4) horizons corresponding to near top of mapped hydrocarbon-bearing sands were used to produce time maps and then depth structural maps using appropriate checkshot data. Petrophysical analysis of the mapped reservoirs revealed that the area is characterized with hydrocarbon saturation ranging from 56 to 72%, water saturations between 27 and 44%, volume of shale between 7 and 20%, and porosity between 25 and 31%. Three major structure building faults (F2, F3, and F5 which are normal, listric concave in nature), two antithetic (F1 and F4), were identified. Structural closures identified as roll-over anticlines and displayed on the time and depth structure maps suggest probable hydrocarbon accumulation at the upthrown side of the fault F4. Seismic attribute results reveal two main characteristic patterns of high and low amplitude and frequency areas. There is an intermediate zone between the low and high amplitude and frequency that may be regarded as transition zone. Multilayer Perceptron Neural Networks (MLPNN) revealed how permeability, net-to-gross, porosity, volume of shale, and hydrocarbon saturation vary away from well control across the entire field. The supervised MLPNN-simulated volumes for petrophysical properties of interest have their uncertainties quantified and measure of accuracy in prediction and the predictive power in terms of root-mean-square error (RMSE). RMSE is the standard deviation of residual which is difference between the predicted values and observed values, i.e., input and output of the network. RSME ranges between 0 and 1 and values closer to zero (0) indicate a fit that is more useful for prediction and also very high confidence level for the resulting output. Permeability modelled at RMSE of 0.030 revealed some thief zones (channel with high absolute permeability) within and outside the areas with well concentration with average permeability of 635md. MLPNN-modelled map of net-to-gross (NTG) at RMSE of 0.0290 revealed that 72% of the reservoirs have a very high NTG (ratio of the volume of the sand in the reservoir to the total volume of the reservoir) with average NTG of 0.7184. Effective porosity was modelled at RMS error of 0.0053 with resulting average effective porosity of 0.295. The effective porosity slice on top of reservoirs revealed the lateral variation of effective porosity across the field with very high effective porosity areas coincide with the delineated regions of interests. Moreover, hydrocarbon saturation was also modelled at RMSE of 0.0282 with an average of 69.7% and volume of shale was modelled at RMSE of 0.028 and average volume of shale of 9%. A comparison of MLPNN slices of petrophysical properties on the mapped horizons revealed that a relatively higher NTG, low volume of shale, high hydrocarbon saturation, high permeability, and high effective porosity were observed in the regions of interest in the field. In conclusion, successful MLPNN prediction has been done for petrophysical properties at inter-well points and locations beyond well control. MLPNN-modelled maps revealed some bypassed sand channels and some thief zones within and outside the areas with well concentration that are not evident on the structural maps and attribute slices. The integration of the different analyses and results from the study has improved our understanding of mapped reservoirs and enhanced lateral prediction of its properties. Keywords Lateral prediction · Seismic attributes · 3D seismic · Petrophysics · Neural network Extended author information available on the last page of the article
13
Vol.:(0123456789)
Journal of Petroleum Exploration and Production Technology
Introduction The tertiary Niger Delta is made of numerous structural complexities with a projected reserve of more than 12 billion barrels of crude oil scattered around various oil field in the region (Corredor et al. 2005). The middle Eocene to Pleistocene Agbada Formation in the Niger Delta Basin is producing hydrocarbons in viable quantity from a series of paralic clastic reservoirs (Ebi Omatsola 1999). This hydrocarbon-rich basin is ranked eighth amid the world’s hydrocarbon provinces with further auspicious reserves not yet discovered as search for petroleum proceeds into the deeper offshore. The Niger Delta hydrocarbon province has some verified recoverable reserves of around 37,452 million barrels (mmbbl) of oil (OPEC 2016) and 5.1 trillion cubic meters of gas resources (BP 2014). Current massive oil discoveries in the deep-water zones of the Delta suggest that the province will continue to be a focus of exploration activities (Corredor et al. 2005). The numerical simulations of flow in hydrocarbon reservoirs require the specification of the geometry and physical properties of complex geological formations. These are built from sparse or low-resolution samples obtained from well and seismic data and are required to be consistent with geological concepts. In most of the cases, incorporation of the 3D seismic data and well-log record has been used for qualitative and quantitative reservoir characterization in terms of reservoir permeability, porosity, facies distributions, and basin description. A reliable and most effective method to obtain petrophysical properties is well-log record analysis. However, the borehole record analysis can only determine the properties of subsurface rock or stratigraphy at well location and its immediate surroundings. Therefore, in a situation, where there are very few well-log records or the wells are concentrated in a part of the study area, the distributions of petrophysical properties across the field is very difficult to understand. However, 3D seismic data have a record of information for both vertical and lateral variations of rock properties vis-a-viz their amplitude, frequency, phase, etc. If seismic attributes that measures of kinematic, geometric, dynamic, and statistical features derived from seismic data and petrophysical properties derived from well logs are statistically and physically related to excellent geological significance; one can intelligently extrapolate sparse well petrophysical properties of interest unto the much denser seismic grid. The Multilayer Perceptron Neutral Network (MLPNN) prediction tool provides such procedure that adequately addresses the mapping and lateral prediction of petrophysical properties away from well control with integration of seismic attributes and well-log data. In recent times, the uncertainty in such lateral prediction is being reduced and quantified using prediction
13
tools such as neural networks (Pramanik et al. 2004; Hampson et al. 2001). This research work, integrate wireline logs, 3D seismic data volumes, and seismic attributes volumes to characterize the reservoir in the field of study (Fig. 1). Several different techniques, namely, multilayer perceptron neural networks, and technique which incorporates seismic inversion and multiattribute transforms together were used towards the achievement of the aim of the work in the field of study, Pennay field, offshore Niger Delta.
Geological framework The Niger Delta is located in the Gulf of Guinea on the west coast of Central Africa (Fig. 2) and outspreads all over the Niger Delta area (Stacher 1995). During the Tertiary, it built out into the Atlantic Ocean at the mouth of the Niger Benue river system, an area of catchment that covers more than a million square kilometres of mainly savannah-covered plains. The delta with the sub-aerial portion covering about 75,000 km2 and covering more than 300 km from climax to mouth (Fig. 3). The Tertiary sequence of Niger Delta is subdivided into three broad stratigraphic units (Fig. 4): Akata Formation, Agbada Formation and Benin Formation in descending order of sedimentation. Non-marine sand characterized almost entirely the shallowest part of the sequence. It was deposited in alluvial or upper coast plain environments following a southward shift of deltaic deposition into a new depobelt. The oldest continental sands are probably Oligocene, although they lack fauna and are impossible to date directly. Akata Formation (Marine Shale) is a fully marine deposit, characterized by uniform shale development with lenses of siltstone and sandstone. It is generally overpressured (i.e., under-compacted). The boundaries between each formation are not always sharp, but gradual transition is common. This formation is believed to have been deposited in front of the advancing delta and has a maximum thickness of over 6100 m in the central part of the delta. Akata shale is thermally matured and is considered to be the main source rock, where hydrocarbons are generated. Agbada Formation (Paralic clastics) overlies the Akata Formation and underlies the Benin Formation. Agbada Formation is a paralic sequence consisting of alternation of sands (sandstones) and shale’s which are the result of differential subsidence, variation in sediment supply and shift of the delta depositional axes which result in local transgression and regression. Considerable problems arise with the definition of the top and base of the Agbada Formation. The top is usually defined by local geologist as the base of fresh-water invasion, whereas the base is often placed at the onset of hard over pressures during drilling. This sequence is connected with sedimentary growth faulting (Fig. 5) and contains the bulk of the
Journal of Petroleum Exploration and Production Technology
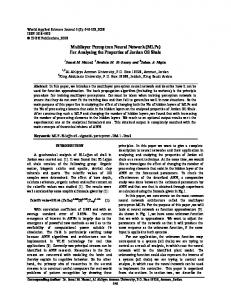
Fig. 1 Base map of the study location
hydrocarbon reservoirs. The Agbada Formation is divided into four members, namely: 1. D-1: This is predominantly regressive, marine sand and shale that contains minor oil and gas reservoirs. 2. Qua-Iboe: It consists of thick piles of shale with thin intercalated sands that are possible oil and gas reservoirs in some places. 3. Rubble beds: It lies directly below the Qua-Iboe as truncated beds. 4. Biafra member: It is predominantly sands and shale, and it consist the principal oil and gas reservoir. It is divided into upper, middle and lower. Benin Formation (Continental sands) occurs in the whole Niger Delta from Benin-Onitsha in the North and extends beyond the present coastline. This is composed of entirely non-marine sand and it is the shallowest part of the sequence. It has massive continental (fluvative) grave, which consists of shale and sand with thickness up to 200 km. It was deposited in alluvial or upper coastal plain environments following a southward shift of deltaic deposition into a new depobelts. This is a terrestrial sequence. It is the uppermost and shallowest stratigraphic unit in the Niger Delta (Fig. 6).
It consists of poorly sorted, medium-to-fine grained, freshwater bearing sands and conglomerates, with a few shale intercalations which become more abundant towards the base. The thickness of this formation is about 2100 m and, it traps non-commercial quantities of hydrocarbon and has sand percentage of over 80%. The age of this formation is Oligocene (Short and Stauble 1967). The Pennay field is situated offshore, south-western Niger Delta and is complexly faulted within the basin. The topmost Benin sands, middle parallic Agbada Formation, and the marine shales of Akata Formation—are well represented in the field (Fig. 7). The field is characterized by only normal faults, which indicate an extensional deformational phase during subsidence and uplift associated with instability of the over-pressured shale in the Late Cretaceous.
Data sets and methodology The data sets available for this research include a base map, a three-dimensional (3D) seismic volume, suites of well logs for five (5) wells and checkshot data (Table 1). The 3D seismic data volume is a post stack, zero phase, Migrated, 58 folds, with dominant bandwidth of 65 Hz. It consists
13
Journal of Petroleum Exploration and Production Technology
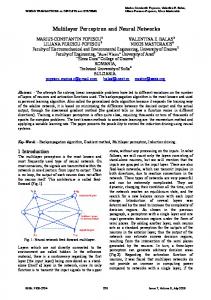
Fig. 2 Niger Delta concession map showing study area. Modified from Doust and Omatsola (1990) and Stacher (1995)
of 401 inlines and 201 crosslines. The quality in terms of resolution of the seismic section was further enhanced using post-processing techniques. Various lithologies in the field were identified via gamma ray log and this was possible by establishing shale baseline or cut-off mark of 70API within gamma ray log. The negative deviation from the shale baseline indicate that the lithology is sand and positive deviation to the right indicates that the lithology is shale lithology. Hydrocarbon-bearing reservoirs in the five wells were identified using area that has high-resistivity values and low gamma ray which is an indication of hydrocarbon and sand unit, respectively, such area was digitized on petrel and named. The 3D seismic data volume (Fig. 8a) was used for fault interpretation and was quality checked using the 3D window. Identified faults were assigned names, colourcoded (Fig. 8b). Four key seismic horizons were tied to the seismic section with the well tops which were defined from the gamma ray log. The resistivity logs were used to determine potential hydrocarbon-bearing zones. Qualities such as continuity, event strength, amplitude, and coherency were used as guides. These analyses prompted the interpretation of the seismic horizons (Fig. 8b). Five faults were mapped from the field the field of study and it was found out that the major faults are growth fault and roll-over anticline. Seven (7) attributes were extracted from the seismic sections
13
(horizon based and at 20–40 ms time-windows based) covering all the mapped horizons. This was done to analyze the amplitude and frequency changes and relate them possibly to changing reservoir properties away from well control on the mapped horizons across the field. Another section of the study involved the prediction of spatial distribution of reservoir and rock properties using multilayer perceptron neural network (MLPNN). The basic idea behind MLPNN is the use of a set of one or more measured values (independent variables) to predict the value of a single dependent variable. Well-to-seismic ties are considered to be the training points for the method; both the seismic response and the well-log property are known at the selected well locations. A statistical relationship in terms of cross plots (Fig. 9a, b), either linear or non-linear, is developed at the well sites to relate the seismic response to the well-log response. The network will find the optimal (non-linear) mapping between seismic attributes and target well-log attributes such as porosity, volume of shale, hydrocarbon saturation, permeability, and net to gross. The advantages of MLPNN include: handling of larger sets of data such as geophysical SEGY and welllog data, higher number of activation neuron for processing, back propagation network by backing error, and adopting coefficient to overcome limitation of hidden layer, error is determined for each neuron, and it is applied for adopting
Journal of Petroleum Exploration and Production Technology
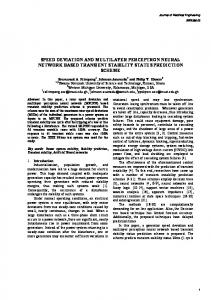
Fig. 3 Map of Niger Delta showing province outline and bounding features (After Evamy et al. 1978)
weighting coefficient and activation value (Fig. 10). It is learning (training) and validating of the network is done with supervision and output can be statistically quantified (Table 2).
Qualitative interpretation This involves the use of the suite of logs, such as resistivity (ILD), gamma ray, neutron and density logs to identify lithology within the five wells using the following generalised formula to estimate the petrophysical parameters, e.g., water saturation, hydrocarbon saturation, porosity, and permeability. True formation resistivity (Rt) This is the true resistivity of a formation. It is measured by a deep reading resistivity log such as Deep Induction Log (ILD) or Deep Laterolog (LLD). The ILD log signature across each reservoir formation in each well is examined and sampled to obtain its average value in each of the hydrocarbon reservoir. This gives the true resistivity Rt of each reservoir. Gamma Ray Index (Igr): Determining the Gamma Ray Index (IGR) is the first step needed to evaluate the volume of shale Vsh in porous reservoirs. They are applied in the analysis of shaly sands. The Gamma Ray Index IGR is given by
IGR =
GRlog − GRmin , GRmax − GRmin
(1)
where IGR is Gamma Ray Index, GRlog is gamma ray reading of formation, GRmin is minimum gamma ray response in a clean sand or carbonate zone, GRmax is maximum gamma ray response in a shaly formation, and GRlog, GRmin, and GRmax are measured in API (American Petroleum Institute) units.
Quantitative interpretation This involves the estimation of petrophysical parameters such as porosity, water saturation, hydrocarbon saturation, permeability, movable hydrocarbon index, bulk volume water, and residual oil saturation. Cross plots of the estimated parameters were generated to support the estimates. Volume of Shale (Vsh) The volume of shale Vsh was mathematically obtained from the following relationships (Eq. 3) using IGR using excel package. The mathematical relationships are: (i) Dresser Atlas (1979) formulae:
13
Journal of Petroleum Exploration and Production Technology
Fig. 4 Stratigraphic column showing the three formations of the Niger Delta. (Shannon and Naylor 1989; Doust and Omatsola 1990)
[ ] Vsh = 0.33 2(2×IGR ) − 1.0
(iii) Clavier (1970) formulae: (For older and consolidated rocks)
(2) [ ] Vsh = 0.083 2(3.7×IGR ) − 1.0 (Tertiary and unconsolidated rocks),
where Vsh is volume of shale, IGR is Gamma Ray Index: (ii) Linear relationship:
Vsh = IGR .
13
(3)
Vsh = 1.7[3.38 − ( IGR + 0.7)2 ]1∕2 . (iv) Stieber (1984) relationship:
( ) 0.5 × IGR Vsh = ( ). 1.5 − IGR (v) Bateman (1977) formulae:
(4)
(5)
Journal of Petroleum Exploration and Production Technology Fig. 5 Principal types of oilfield structures in the Niger Delta with schematic indications of common trapping configurations (After Tuttle et al. 1999)
Fig. 6 Event chart for the Niger Delta (Akata/Agbada) petroleum system. (Doust and Omatsola 1990)
(I +GR factor) Vsh = IGRGR .
(6)
The GR factor here is a number chosen to force the result to imitate either the Clavier or the Steiber relationship. Porosity (∅) Based on the available data, density-derived porosity ∅DEN was computed and corrected for shale effect
using the Dresser Atlas (1979) equation. The density-derived porosity ∅DEN is given by ( ) 𝜌ma − 𝜌b �DEN = . (7) 𝜌ma − 𝜌f
13
Journal of Petroleum Exploration and Production Technology
Fig. 7 Structural map of the top of Akata formation (a) and thickness isopach contours of the Agbada formation (b). Contours in 2000 foot intervals (Avbovbo 1978)
Table 1 Data available for interpretation
13
DATA
PENNAY 1
PENNAY 2
PENNAY 3
PENNAY 4
PENNAY 5
Well headers Deviation surveys Gamma ray log Density log Sonic log Resistivity Log Neutron log Spontaneous potential log Checkshot 3D seismic volume (Inlines & Crosslines)
●
●
●
●
● ● ● ● ● ●
● ● ● ● ● ●
● ● ● ● ● ●
● ● ● ● ● ● ●
● ● ● ● ● ● ● ● ●
●
Journal of Petroleum Exploration and Production Technology
The corrected density porosity, after Dresser Atlas (1979) is given by ( ) ( ) 𝜌ma − 𝜌b 𝜌ma − 𝜌sh �= − Vsh , (8) 𝜌ma − 𝜌f 𝜌ma − 𝜌f where Vsh is Volume of shale, ∅DEN is density-derived porosity, ∅ is corrected density porosity for shale effect, and ℓma is matrix density of formation. This is given to be 2.68 g/ cc in the log header, and ρb is bulk density of formation. It is obtained as the log response in each reservoir, and ρ f is fluid density. This is given as 1.0 g/cc in the log header, and ρsh is bulk density of adjacent shale. This is the density log response in the adjacent shale zone to each reservoir formation. Criteria of the ∅ grades (Buller and Konen 1970): ∅ < 5%: Negligible. 5% < ∅ < 10%: Poor. 10% < ∅ < 15%: Fair. 15% < ∅ < 25%: Good. ∅ > 25%: Excellent. Formation Factor Estimation (F) This fundamentally expresses the ratio of the resistivity of a formation to the resistivity of the water with which it is saturated. In borehole geophysics, the formation factor F is given by
a F = m, �
(9)
where a is tortuosity factor, m is cementation factor, and ∅ is porosity. Where a = 1, m = 1.8. Water saturation estimation (Sw) The water saturation in each of the reservoir formation was computed using the Archie (1942) formula. It is given by
( Sw =
F ×
Rw Rt
)1∕n ,
(10)
where F is formation factor, Rw is formation water resistivity at formation temperature, R t is true formation resistivity, and n is saturation exponent. This was given to be 2.0. This was obtained from the log header. Hydrocarbon saturation (Sh) The hydrocarbon saturation was computed using Eq. (11). Sh is given by (11) Irreducible water saturation (Swirr):n Water saturation at irreducible water Swirr is given by √ F (12) Swirr = , 2000
Sh = 1 − Sw .
where F is the formation factor. Absolute permeability (K) is the ability of a rock to transmit a single fluid when it is 100% saturated with that fluid. It is measured in millidarcy (md).
The absolute permeability K is given by
K 1∕2 =
100 × �2.25 . Swirr
(13)
This is called the Timur (1968) relationship:
K 1∕2 =
250 × ∞3 . Swirr
(14)
This is the Tixier (1956) relationship. This is applied in this study to compute the permeability for each reservoir rock. ∅ is the porosity. Swirr is the irreducible water saturation. Relative permeability (Kr): The relative permeability Kr is the ratio between effective permeability of fluid at partial saturation, and the permeability at 100% saturation (absolute permeability). It follows that when the relative permeability of a formation water is zero, and then, the formation will produce water-free hydrocarbons (i.e., when Krw = 0, then Kro = 100%). With increasing relative permeability to water Krw, the formation will produce increasing amounts of water relative to hydrocarbons, (Asquith and Gibson 1982). The relative permeability to water Krw is given by
Krw
[( ) ]3 Sw − Sw irr = ( ) . 1 − Sw irr
(15)
The relative permeability to oil Kro is given by
[ Kro =
Sh ( ) 1 − Sw irr
]2.1 .
(16)
Effective permeability (Kw and Ko) Effective permeability describes a situation, where there are two fluids in a rock. The ability of the rock to transmit one of the fluids in the presence of the other, when the two fluids are immiscible is a function of the effective permeability of the rock. The effective permeability to water Kw is given by (17) The effective permeability to oil Ko is given and thus
Kw = Krw × K.
(18) Hydrocarbon pore volume (HCPV) This is the fraction or the percentage of bulk reservoir volume that is occupied by hydrocarbon. It is given by ( ) HCPV=� × 1 − Sw = � × Sh , (19)
Ko = Kro × K.
where ∅ is the porosity, SW is water saturation, and Sh is hydrocarbon saturation.
13
Journal of Petroleum Exploration and Production Technology
Fig. 8 a Seismic volume and horizons interpreted on the study. b Typical interpreted seismic section (Inline 6190)
Results and discussion Petrophysical evaluation of reservoirs Petrophysical analysis of Pennay field was carried out using digitized data gotten from the composite well logs provided. The petrophysical evaluation of the reservoir units forms a qualitative approach of interpreting the well logs. The logs were used to determine the hydrocarbon saturation of each reservoir across the wells (Fig. 11a). All computations were done using relevant equations and typical results obtained are presented in Table 3. Reservoir A is located within a depth range of 2294–2440 m and extends across all the wells. It has an average porosity of 28%, hydrocarbon saturation of 60%, permeability of 721 md, volume of shale of 12%, net-to-gross sand ratio of 0.99, and water saturation of 39.7%. The reservoir has an average porosity of 28%, which is a good and significant characteristic of prolific reservoir according to criteria of the porosity ( ∅ ) grades by Buller and Konen (1970). The reservoir in sand B was penetrated at depths 2459–2563 m for Pennay 1, 2458–2727 m for Pennay 2, 2477–2691 m for Pennay 3, 2478–2684 for Pennay 4, and 2456–2747 m for Pennay 5. Gross reservoir thickness is of 108, 269, 28, 372, 133, and 110 m in Pennay 1–5, respectively. It was characterized by gross thickness of 120, 103, and 112 ft; net-to-gross ratio is 100% in Pennay 1, 2, 3, and 4, respectively. The average volume of shale is 8%,
13
as a result of this the reservoir, has a maximum porosity of 28% which is a clear indication that the reservoir has a large volume of sand deposit than shale; therefore, hydrocarbon saturated. The hydrocarbon saturation in the reservoir is 70, 72, 70, 72, and 70% for Pennay1–5, respectively. The estimation of effective and relative permeability to oil hydrocarbon of Pennay 2, Pennay 1, Pennay 4, Pennay 3, and Pennay 5 are 0.559, 0.61, 0.56, 0.61, and 0.56, respectively. Reservoir in sand C with thickness ranging from depths of 2778–3126 m for Pennay 1, 2783–3155 m for Pennay 2, 2870–3203 m for Pennay 3, and 2798–3159 m for Pennay 4 and 2779–3130 m for Pennay 5. Gross reservoir thickness of 122, 214, 333, 250, and 214 m in Pennay 2, 1, 4, 3, and 5, respectively. It is characterized by an average gross thickness and net-to-gross ratio of 230 m, with net-to-gross ratio of 84% in Pennay: 1–5, respectively. In Pennay 3 and Pennay 4, the resistivity log gives a little increase which is an indication of gas and oil contact, while in Pennay 3, the resistivity log yields a minute increase which is an indication of an oil and water contact. The average volume of shale in reservoir C is 15%. Reservoir in sand D was penetrated with thickness ranging from depths of 3206–3501 m for Pennay 1, 3256–3389 m for Pennay 2, 3246–3496 m for Pennay 3, 3210–3320 m for Pennay 4, and 3209–3509 m for Pennay 5. Gross reservoir thickness of 66, 32, 27, and 36 m in Pennay 2, Pennay 1, Pennay 4, and Pennay 3, respectively. It was characterized by an average volume of shale of 18%. The reservoir is thin
Journal of Petroleum Exploration and Production Technology
in the SE and thickens towards the NW; this probably could be attributed to deformation or tectonic activities in the area of study.
Statistical petrophysical analysis across wells and all the mapped reservoirs Statistical petrophysical analysis of all the mapped reservoirs in Pennay field (Fig. 11b, c) revealed that the reservoirs B and C have a better relative ranking to other mapped reservoirs in the study area. They are characterized with very good hydrocarbon saturation, low water saturation, and high porosity. It was found that all these reservoirs are good reservoir with high oil saturation at irreducible water saturation, because water saturation values are low, it follows that the reservoir must have high oil saturation, i.e., (1–Sw = Sh). The volume of shale in all the reservoirs are generally low ranging from (7.07–20%), which means that the sand body in all the reservoirs is high and there will be high rate of free flow of hydrocarbon in all the reservoirs as corroborated by their permeability values. Moreover, the high hydrocarbon saturation, low water saturation, and low volume of shale in the reservoirs made it more prolific and good for hydrocarbon exploration and exploitation.
Seismic structural analysis Structural interpretation was undertaken to identify and assign faults found in the 3D seismic volume. Time and depth structure maps in combination with well logs were used to produce for four horizons, namely: H1–H4. Three major growth faults (F2, F3, and F5 which are normal, listric concave in nature) and two antithetic (F1 and F4) were identified. Structural closures identified as roll-over anticlines and displayed on the time/depth structure maps suggest probable hydrocarbon accumulation at the upthrown side of the fault F4. Structural time maps, where values are in two-way seismic travel time, were generated for the mapped horizons using, fault polygons, boundary polygons, and the interpreted horizon, as shown in Fig. 8a. Structural depth maps were also generated and they show the true position of structures and fault within the study area for the mapped horizons corresponding to the time depth plot. The depth structural map of sand A is shown in Fig. 12a, and the contour lines vary from − 2260 to − 2380 m. The lowest point on this map is at the north-western part with depth values of − 2200 to − 2260 m. On this map, there are five faults; the two main faults (F–C and F–E) are responsible for the hydrocarbon accumulation. The crest of the structure is structurally high; hence, it is a hydrocarbon prospect. It can be observed that the existing wells are situated close to and on the flank of the mapped structural high. This confirms the validity of the existing interpretation. The
depth structural map of sand B is shown in Fig. 12b; the contour lines vary from − 2450 to − 2900 m. The lowest point on this map is at south-western part with depth values of − 2375 to − 2450 m. There are five faults on the map; the major fault is responsible for the hydrocarbon accumulation. The crest of the structure is structurally high; hence, it is a hydrocarbon prospect. It can be observed that the existing wells are situated close to and on the flank of the mapped structural high. This also confirms the validity of the existing interpretation. The depth structural map of sand C is shown in Fig. 12c; the contour lines vary from − 2450 to − 2900 m. The lowest point on this map is at the south-western part with depth values of − 2375 to − 2900 m. One major fault was mapped which is the main fault that is responsible for the hydrocarbon accumulation. The crest of the structure is structurally high; hence, it is a hydrocarbon prospect. It can be observed that the existing wells are situated close to and on the flank of the mapped structural high. The depth structural map of sand D is shown in Fig. 12d; the contour lines vary from − 3000 to − 3500 m. The lowest point on this map is at the south-western part with depth values of − 3000 to − 3125 m. On this map, one major fault was mapped which is the main fault that is responsible for the hydrocarbon accumulation. The crest of the structure is structurally high; hence, it is a hydrocarbon prospect. It can be observed that the existing wells are situated close to and on the flank of the mapped structural high. This also confirms the validity of the existing interpretation.
Discussion of attributes The root-mean-square amplitude attributes (Fig. 13) were extracted from the seismic sections @ 20–40 ms windows covering the mapped horizons. This was done to analyze the amplitude changes and relate them possibly to changing reservoir properties away from well control. The results reveal two main characteristic patterns of high and low amplitude areas. There is an intermediate zone between the low and high amplitudes that may be regarded as transition zone, the low amplitude is considered as the background amplitude, while the high amplitude is the anomalous amplitude. The high amplitude is as a result of matrix fluid contact on the surface which makes it act as a reflection surface. It measures seismic reflectivity; therefore, the brighter the bright spot, the better the prospect. The NW–SE elongated high amplitude anomaly depicts a sand channel with very good lateral continuity of about 80% of the entire horizon. The high amplitude zone falls within the top of the structure in the tested fault block, where the occurrence of hydrocarbon has been confirmed. Consequently, the attribute map helped in locating existing hydrocarbon zones and their lateral extent. It also extends to the roll-over structure in the upthrow side of fault F3.
13
Journal of Petroleum Exploration and Production Technology
Fig. 9 a Cross plot of RAI vs Effective porosity. b Cross plot of instantaneous frequency vs Effective porosity
Table 2 Results of data preparation and training statistics for effective porosity modelling PHIE test stats
Fig. 10 Artificial neurons (schematic)
Hence, regions of high amplitude constitute proven hydrocarbon areas and regions of prospect. This suggests that there is a relationship in the reservoir characteristics of the two structures and the root-mean-square amplitude attribute. Moreover, From the basic seismic theory of trace formation, reflection coefficient is convolved with extracted wavelet to form a trace. Reflection coefficient is related to acoustic impedance contrast which occurs at the boundary of two lithologies or fluids. The product of velocity and density yields the acoustic impedance. Therefore, it can be inferred that the high and low amplitude region may indicate impedance contrast between two different lithologies or fluids. The high amplitude zone is suspected to indicate the presence of hydrocarbon, since hydrocarbon has been confirmed in one of the regions. The relative acoustic impedance attribute (Fig. 13e) is an indicator of impedance changes, in a relative sense. The results reveal two main characteristic patterns of high
13
Number of used input vectors Number of invalid input vectors Data mean Data standard deviation Data minimum Data maximum RMS error RMS error, normalized Mean absolute error Maximum absolute error Input node relative importances: ([Inst. Phase]) ([RAi])
324 0 0.295 0.095 0 0.325 0.053 0.058 0.082 0.212 93.1 100.0
and low impedance areas. There is an intermediate zone that acts as transition zone, low impedance zone is considered as the anomalous region which corresponds to tested regions of hydrocarbon occurrence at the top of reservoir 2. Low impedance anomaly was observed because seismic signal travels in oil/gas zone at very low velocities that in turn result a push down of reflectors and cause a delay in time series, also very low density (2.2–2.25 g/cm3) is observed in hydrocarbon-rich sand. Therefore, low density, very low velocity coupled with the high porosity and hydrocarbon presence in these reservoirs will bring about low relative acoustic impedance as observed at the top of reservoir 2.
Journal of Petroleum Exploration and Production Technology
a
90 80 70 60 50 40 30 20 10 0
78.3 62.82
57.93 40.07
0.277
40.67
37.18 21.7
9.23
59.33
7.09
20
14.6
0.277
0.271
0.245
RES A
RES B
RES C
Vsh (%)
9.23
7.09
14.6
RES D 20
Sh (%)
57.93
78.3
62.82
59.33
Sw (%)
40.07
21.7
37.18
40.67
ØD
0.277
0.277
0.245
0.271
Sw (%)
ØD
60 40
500 0.277 9.23
57.93 42.07
612 0.27 14.47
64 36
0.277 9.13
57.93 42.07
0.297 11.17
59 41
600
952
c
Sh (%)
950
Vsh (%)
0.29 11.17
b
PEN 1
PEN 2
PEN 3
PEN 4
PEN 5
59
57.93
64
57.93
60
Sw (%)
41
42.07
36
42.07
40
K (md)
952
600
612
500
950
ØD
0.297
0.277
0.27
0.277
0.29
Vsh (%)
11.17
9.13
14.47
9.23
11.17
Sh (%)
Fig. 11 a Lithostratigraphic correlation section across the reservoirs. b Comparison of bar chart of hydrocarbon saturation, water saturation, porosity, and volume of shale across reservoirs. c Comparison
bar chart of hydrocarbon saturation, water saturation, porosity, permeability, and volume of shale across wells
13
0.39 0.61 0.46 0.36 29.6 5.4 8.3 28.9 0.05 0.01 0.03 0.05 600 600 300 500 16.1 20.0 15.2 15.3 42.07 27.7 38.8 43.7 104 269 214 206 A B C D
82 84 82 88
0.277 0.277 0.245 0.271
9.13 6.89 14.6 20
0.29 0.24 0.40 0.48
57.93 72.26 71.82 56.33
12 14 11 11
Kro Kw (md) Krw K (md) HCPV (%) BVOMOV (%) Sw (%) Sh (%) IGR Vsh(%) ∅D
Net/gross (%) Gross (m) Reservoir
Table 3 Computed petrophysical parameters of (4) reservoirs in Pennay field well 2
236 376 124 192
Journal of Petroleum Exploration and Production Technology Ko (md)
13
Instantaneous frequency (Fig. 13d) is a hydrocarbon indicator by low frequency anomaly as observed on top of reservoir 2. The lower frequencies indicate sand rich bedding and also a sand/shale ratio indicator. This effect is sometimes accentuated by the unconsolidated sands due to the oil content of the pores. The existence of low velocity in hydrocarbon zones are most likely to result in low frequency anomalies as observed in these regions of interest in the study area. Reflection intensity of top of Pennay horizon 2 (Fig. 13f) reveals local changes indicating faulting structural pattern detection that are outstandingly visible from the imprints of the attribute. It can also be called fault whisper. This was done so as to validate the already mapped faults. the attribute converts a volume of continuity (the normal reflections) into a volume of discontinuity (the faults and other boundaries). These attributes operate within a time window and use a variety of mathematical approaches similar to correlation. The normalized amplitude attributes (Fig. 13g) is the cosine of the instantaneous phase angle also extracted from the seismic sections covering the mapped horizons. It represents continuity and helpful in lateral continuity direction determination. The results reveal NW–SE lateral continuity direction near the tops of the mapped reservoirs. Figure 13c from the geological interrelationship of the major faults and structures in the field favours and led to the viability of the identified proven and prospective hydrocarbon zones/ region of interest (ROI). ROI-1 is sandwiched between downthrown of F2 and upthrown of F3, while ROI 2 is sandwiched between downthrown of F3 and upthrown of F5 and F4 (see Fig. 14).
Discussion of reservoirs and rock properties prediction using MLPNN The prediction of spatial distribution of reservoir and rock properties in Pennay field using Multilayer Perceptron Neural Networks (MLPNN) involve the use of seismic attributes as input to predict these properties (permeability, porosity, volume of shale, hydrocarbon saturation and net to gross) away from well control and the uncertainty in resulting maps were quantify in terms of its root-mean-square error (RMSE). Root–mean-square error is the Standard deviation of residual which is difference between the predicted values and observed values, i.e., input and output of the network. RMSE ranges from 0 to 1. Values closer to zero (0) indicate a fit that is more useful for prediction and also very high confidence level for the resulting output (Kellar and Perez 2002). RSME is also a way to quantify the uncertainty and measure of accuracy in prediction and the predictive power. Effective porosity was modelled at RMS error of 0.0053 with resulting average effective porosity of 0.295. The effective porosity slice on top of reservoir 2 (Fig. 15) revealed the lateral variation of effective porosity across the field with
Journal of Petroleum Exploration and Production Technology
Fig. 12 a Depth structure map of horizon sand A. b Depth structure map of horizon sand B. c Depth structure map of horizon sand C. d Depth structure map of horizon sand D
very high effective porosity areas coincide with the delineated regions of interests. The resulting reservoir permeability map (Fig. 16) was modelled at RMSE of 0.030, revealed some thief zones (channel with high absolute permeability) within and outside the areas with well concentration. The average permeability of the reservoirs modelled by MLPNN was 635md. Moreover, hydrocarbon saturation (Fig. 17) was also modelled at RMSE of 0.0282 with average of 69.9% and volume of shale (Fig. 18) was modelled at RMSE of 0.028 and average volume of shale of 9%. MLPNN-modelled map of net-to-gross (NTG) (Fig. 19) at RMSE of 0.0290 revealed that 72% of the reservoir has a very high NTG (ratio of the volume of the sand in the reservoir to the total volume of the reservoir) with average NTG of 0.7184. A comparison of MLPNN slices of petrophysical properties on the mapped horizons revealed that relatively higher NTG, low volume of shale, high hydrocarbon saturation, high permeability and high effective porosity were observed in these regions of interest. MLPNN-modelled maps revealed some bypassed sand channels and some thief zones (channel with high absolute permeability) within and outside the areas with well concentration that are not evident on the structural maps and attribute slices.
Conclusions Conclusions drawn from the research are as follows: 1. 4 hydrocarbon-bearing sands, namely, Pennay 1, 2, 3, and 4 were delineated from the study area. 2. The area is characterized by the following Petrophysical properties: Gross ranges between 108 and 361 m, net/ gross: 78–96%, ∅ : 27–31%, Vsh: 7–20%, Sh: 56–72%, Sw: 28–44%, HCPV: 13–21% and K: 300–1097 md 3. Reservoirs B and C have a better relative ranking to other mapped reservoirs in the study area. They are characterized with very good hydrocarbon saturation 72%, low water saturation 28% and excellent porosity 31% and it was found that all these reservoirs are good reservoir with high oil saturation at irreducible water saturation, because water saturation values are low, from (7.07–20%), which means that the sand body in all the reservoirs is high and there will be high rate of free flow of hydrocarbon in all the reservoirs as corroborated by their permeability values. 4. Four (4) horizons corresponding to near top of delineated hydrocarbon-bearing sands were mapped after wellto-seismic tie and subsequently used to produce time
13
Journal of Petroleum Exploration and Production Technology
13
Journal of Petroleum Exploration and Production Technology ◂Fig. 13 a RMS Amplitude map of top of PENNAY horizon 2 show-
ing. b: 3D view of depth structural map of PENNAY horizons. c RMS Amplitude map of top of PENNAY horizon 2 showing regions of interest, interrelationship of faults and well locations. d Instantaneous frequency of top of PENNAY horizon 2. e Relative acoustic impedance of top of PENNAY horizon 2. f Reflection intensity of top of PENNAY horizon 2. g Normalized amplitude of top of PENNAY horizon 2
5.
6.
7. 8.
maps and then depth structural maps using appropriate checkshot data. Three major structure building faults (F2, F3 and F5 which are normal, listric concave in nature), two antithetic (F1 and F4) were identified. Structural closures identified as roll-over anticlines and may be described as four-way dip closure was displayed on the time/depth structure map. Structural closures of this type act as hydrocarbon trap in the study area at the upthrown side of the fault F4. Seismic attribute results reveal two main characteristic patterns of high and low amplitude and frequency areas. There is an intermediate zone between the low and high amplitude and frequency that may be regarded as transition zone. The attribute maps provided insight into the possible nature of fluid, rock properties and horizontal extent of hydrocarbon fluid. Horizon cubes produced from MLPNN in regions of interest defined relationships that are clearly correlative with seismic attributes. MLPNN revealed how permeability, porosity, volume of shale and hydrocarbon saturation varies away from well control across the entire field. It also revealed some bypassed hydrocarbon sand rich bedding and some channels that would be of exploration and exploitation interest. Many of the properties
Fig. 14 MLPNN data preparation and training interface for hydrocarbon saturation modelling
predicted from multiattribute analysis of seismic data calibrated with logs correlated well with the simulated petrophysical property volumes Outcomes of this research have revealed the effectiveness of combining well log and seismic data in lateral prediction of reservoir petrophysical properties and evaluation of hydrocarbon latent of reservoirs and also to influence development choices. The detailed characterization of the reservoirs in relations to structure and lateral variation of petrophysical properties will bring about the needed production optimization in this field. Moreover, the result will help to plan the development method and guesstimate production and also helpful in providing very effective reservoir management approach as a result of lateral extent of the reservoirs and the class of hydrocarbon therein throughout the lifespan of the field. Based on the seismic interpretation, the field offers prospective structural closures for hydrocarbon
Fig. 15 Effective porosity time slice at top of reservoir 2
Fig. 16 Permeability time slice at top of reservoir 2
13
Journal of Petroleum Exploration and Production Technology
should be drilled to further increase hydrocarbon production and the drilling should be done to a probable depth to determine the depth at which the OWC will be encountered and for good, worthwhile production. It is recommended that further studies should include AVO/AVA analysis and further fault seal analysis should be carried out on the two major faults accumulating these hydrocarbon quantities to check efficiency of these faults in trapping the hydrocarbon. Open Access This article is distributed under the terms of the Creative Commons Attribution 4.0 International License (http://creativeco mmons.org/licenses/by/4.0/), which permits unrestricted use, distribution, and reproduction in any medium, provided you give appropriate credit to the original author(s) and the source, provide a link to the Creative Commons license, and indicate if changes were made. Fig. 17 Hydrocarbon saturation time slice at top of reservoir 2
References accumulation, since no wells have to explored the southwestern flanks of the reservoirs especially, more wells
Fig. 18 Volume of shale time slice at top of reservoir 2
Fig. 19 Net-to-gross time slice at top of reservoir 2
13
Archie GE (1942) The electrical reservoir log as an aid in determining some reservoir characteristics. Trans AME 146(19):54–64 Asquith G, Gibson D (1982) Basic well log analysis, 2nd edn. AAPG Methods in Exploration Series, No. 16, pp 123 Avbovbo AA (1978) Tertiary lithostratigraphy of Niger delta. Am Assoc Petrol Geol Bull 62:295–300 BP (2014) Statistical review of world energy. http://www.bp.com/ Buller M, Konen CE (1970) The log analyst and the programmable pocket calculator. Log Anal 18(5):3–11 Clavier (1970) The Niger delta oil province: recent developments onshore and offshore, pp 201–209 Corredor F, Shaw JH, Bilotti F (2005) Structural styles in the deepwater fold and thrust belts of the Niger delta. AAPG Bull 89:753–780 Dresser Atlas (1979) Log interpretation charts. Houston Dresser Industries Inc, pp 1–10 Doust H, Omatsola E (1990) Niger delta. In: Edwards JD, Santogrossi PA (eds) Divergent/passive margin basins. AAPG Memoir 48. The American Association of Petroleum Geologists, Tulsa, USA, pp 239–248 Ebi Omatsola (1999) Petroleum geology of the Niger delta. Geol Soc Lond Special Publ 50:365–365 Evamy B, Haremboure J, Kamerling P, Knaap W, Molloy F, Rowlands P (1978) Hydrocarbon habitat of tertiary Niger delta. AAPG Bul 62:1–39 Hampson DP, Schuelke JS, Quirein JA (2001), Use of multiattribute transforms to predict log properties from seismic data, SEG. pp 220–236 OPEC (2016) Annual statistical bulletin. http://www.opec.org/opec_ web/en/publications/202.htm Pramanik AG et al (2004) Estimation of effective porosity using geostatistics and multiattribute transforms: a case study. SEG 66:352–372 Shannon PM, Naylor N (1989) Petroleum basin studies. Graham and Trotman Limited, London, pp 153–169 Short K, Stauble A (1967) Outline of geology of Niger delta. AAPG Bull 51:761–779 Stacher P (1995) Present understanding of the Niger delta hydrocarbon habitat: geology of Deltas. AA Balkema, Rotterdam, pp 257–267 Stieber SJ (1984) The distribution of shale in sandstone and its effects on porosity. In: SPWLA sixteen annual logging symposium, vol 47, no 5, pp 7
Journal of Petroleum Exploration and Production Technology Timur A (1968) An investigation of permeability. Porosity and residual water saturation relationship for sandstone reservoirs. Log Anal 9(4) Tixier MP (1956) Fundamentals of electrical logging—microlog and microlatero1og. In: Fundamentals of logging. Petroleum Eng. Conf. Univ. Kansas, 2–3 April 1956 Tuttle ML, Charpentier RR, Brownfield ME (1999) The Niger delta petroleum system: Niger delta province, Nigeria, Cameroon, and
Equatorial Guinea. US Department of the Interior, US Geological Survey, Africa Publisher’s Note Springer Nature remains neutral with regard to jurisdictional claims in published maps and institutional affiliations.
Affiliations Akindeji Opeyemi Fajana1 · Michael Ayuk Ayuk2 · Pius Adekunle Enikanselu2 * Akindeji Opeyemi Fajana
[email protected] 1
2
Department of Applied Geophysics, Federal University of Technology Akure, Akure, Ondo State, Nigeria
Department of Geophysics, Federal University Oye-Ekiti, Oye‑Ekiti, Ekiti State, Nigeria
13