Application of Neural Networks in Financial. Data Mining. Defu Zhang, Qingshan Jiang, Xin Li. AbstractâThis paper deals with the application of a well-known.
PROCEEDINGS OF WORLD ACADEMY OF SCIENCE, ENGINEERING AND TECHNOLOGY VOLUME 1 JANUARY 2005 ISSN 1307-6884
Application of Neural Networks in Financial Data Mining Defu Zhang, Qingshan Jiang, Xin Li
�
the result is still dissatisfactory. In this paper, all mentioned above will be further investigated. Though the efficient market hypothesis [13], which is currently the most popular view on market behavior, states that no mining system can achieve consistently average returns exceeding the average returns of the market indices as a whole. However, many research results have shown that the mining system based on neural networks can outperform market if it is properly designed [14]. In this paper, the theory of neural networks is briefly discussed, and a neural network model to forecast future trends of stock time series is researched. Some improved strategies are presented. At last, an intelligent mining system is developed. The simulation results to Shanghai Composite Index show that neural networks can be applied to make profit for different investors.
Abstract—This paper deals with the application of a well-known neural network technique, multi-layer back-propagation (BP) neural network, in financial data mining. A modified neural network forecasting model is presented, and an intelligent mining system is developed. The system can forecast the buying and selling signs according to the prediction of future trends to stock market, and provide decision-making for stock investors. The simulation result of seven years to Shanghai Composite Index shows that the return achieved by this mining sys-tem is about three times as large as that achieved by the buy and hold strategy, so it is advantageous to apply neural networks to forecast financial time series, the different investors could benefit from it.
Keywords—data mining, neural network, stock forecasting. I. INTRODUCTION
N
EURAL networks are a class of generalized nonlinear nonparametric models inspired by studies of the human brain. Their main advantage is that they can approximate any nonlinear function to an arbitrary degree of accuracy with a suitable number of hidden units [1]. Neural networks get their intelligence from learning process, and then this intelligence makes them have the capability of auto-adaptability, association and memory to perform certain tasks. For a more detailed description of neural networks, the interested readers are referred to the papers in [2, 3, 4]. Financial forecasting is of considerable practical interest. Due to neural networks can mine valuable information from a mass of history information and be efficiently used in financial areas, so the applications of neural networks to financial forecasting have been very popular over the last few years [5, 6, 7, 8, 9, 10]. Some researches [11, 12] show that neural networks performed better than conventional statistical approaches in financial forecasting and are an excellent data mining tool. However, a large number of published researches only pay attention to giving the experimental simulating results and seldom give detailed description from modeling to forecasting to trading, and say nothing of giving their critical techniques. In addition, despite neural networks have many advantages, however, they still meet some problems, for example, overfitting and poor explanation capability and so on. Although many researchers pay special attention to avoid those problems,
II. FINANCIAL TIME SERIES FORECASTING A
sequence of vectors X t ( xt �n ,�, xt �i ,�, xt �2 , xt �1 ) , where xt�i represents past value which varies with the time t , such as stock price. One of the aims in the paper is to predict the future trends on the base of past price patterns X t . It can be formally stated as follows:
series
is
a
find a function F : R n o R , so that:
~ xt
F ( xt �n ,�, xt �i ,�, xt �2 , xt �1 ) ,
where ~ xt is a predict value. ~ xt �1 can be predicted after ~ xt is predicted based on the following function ~ xt �1 F ( xt �( n�1) ,�, xt �i ,�, xt � 2 , xt �1 , ~ xt ) . ~ ~ ~ Similarly, x , x ,�, x can be predicted. The neural t �2
t �3
t � d �1
networks of performing prediction are to approximate F . The trained network is then used to predict the price of future d days. It is well known that stock market is nonlinear dynamical system, and is affected mainly by factors like interest rates, inflation, economic growth, political situation and so on. Although there is correlation, dependency and interaction between these factors is obvious, their relation is rather difficult to express in mathematical function, for example F . So forecasting financial markets is a really challenging task. It is well known that the closing price of stock market is one of the most important factors and includes a lot of useful information, so the closing price time series is selected to predict the future trends of stock market.
Manuscript received November 3, 2004. This work was supported in part by Xiamen University under Grant X01122. D. F. Zhang is with the Department of Computer Science, 361005, Fujian, China (Tel: 0086-0592-5918207; fax: 0086-0592-2183502; e-mail: dfzhang@ xmu.edu.cn).
PWASET VOLUME 1 JANUARY 2005 ISSN 1307-6884
time
392
© 2005 WASET.ORG
PROCEEDINGS OF WORLD ACADEMY OF SCIENCE, ENGINEERING AND TECHNOLOGY VOLUME 1 JANUARY 2005 ISSN 1307-6884
memorized excessively the training patterns, it leads to poor generalization of neural networks. Although many methods are tried to avoid this problem, the result is still not satisfactory. A more effective way that can test whether or not a network is overfitting to set aside some training patterns as part of a testing patterns. In this paper, several other ways are presented to avoid overfitting. First, the training patterns are trained randomly by given times so that the stop criterion is met. In addition, in the process of forecast step by step, the presented mining system does not train every day, but retrain every given days, namely, every given days, neural networks are retrained with the latest closing price.
III. INTELLIGENT MINING SYSTEM Constructing an intelligent mining system often involves the choice of forecasting model and trading strategies. The feed-forward networks are the most widely used architecture because they offer good generalization abilities and are readily to implement. Although it may be difficult to determine the optimal network architecture and network parameters, these networks still show very good performance when trained appropriately. Therefore, the feed-forward network with three layers is selected to model for forecasting task. While neural network forecasting models often involve the choices of an appropriate architecture and training parameters. In detail, this intelligent system can be stated as follows. A. Designed Strategies After the structure and learning method of network are determined, we must consider network factors that significantly impact the performance of neural networks. These factors include the processing for the data, the size of input and hidden layers, the learning rate, the momentum factor, the initial weight, the error function and so on. Designing those factors is an art, some design strategies have been widely discussed [4,11,15], but the corresponding questions of error function and data processing and overfitting have not been adequately investigated. The designed strategies in this paper are presented below. Due to the nonlinearity inherent in stock market, the error function is unlikely to be globally convex and can have many local minima. In addition, the trend of up and down in the stock market is very important for making profits, so a penalizing coefficient D is integrated into the error function in order to make prediction more effective:
B. Trading Strategies After the neural network forecasting model is developed, the network is trained to forecast future trend. However, our interest is not only to construct a forecasting model, but also to make money. Although neural networks have powerful learning and nonlinear mapping capabilities, they are lack of explanation capability. The investors can only trust output of neural networks blindly, so a trading strategy must be considered to avoid the poor explanation capability of neural networks. In fact, whether the forecasting model is effective or not in real world, it must be tested by the trading strategies. Thus the forecasting model can give us valuable suggestions for our investment decision-making. The presented trading strategy is follows:
RBP ! RBT Buy if Signs ® and Down� trend ¯Sell if RSP � RST where RBP is the return of predict buying and can be calculated as
N
MSE
1 D (~xt � xt ) 2 ¦ 2t1
where
D
E ® ¯2 � E
predict
RSP
if ( ~ xt � xt �1 )( xt � xt �1 ) ! 0 , E (0,1) . else
0di � d
xt �1
selling
and
min ( ~ xt �i ) � xt �1 0di � d
can , RBT
, RSP is the return of be
calculated
and RST
as
are constant.
xt �1 Down � trend denotes the trend in the past two days is down and it can be computed by the smoothing methods, for example, moving average, kernel smoothing. The presented forecasting model can tell us when to buy or sell the stock according to the presented trading strategies.
It denotes that, if the predicted direction is the same as the real direction, D is given a smaller constant, otherwise D is given a bigger constant, namely, the incorrect predicted directions are penalized more heavily than the correct predicted directions. In the process of modeling neural networks, the data is usually preprocessed before training in order to make network more effective [4]. Due to the activation function in this paper is a sigmoid function that squashes input data to [0,1], so the real stock data used by this paper that varies from 250 to 2300 will not be useful. In order to make fitting range not saturate, in this paper, all the patterns are scaled in [0.1,0.9]. Generally, the output data cannot be directly used to predict, it must be postprocessed, namely using the inverse of the preprocessing transformation. Just like other non-parameter model, modeling neural networks still meet overfitting problem. When a network is trained excessively, Overfitting occurs. Due to overfitting
PWASET VOLUME 1 JANUARY 2005 ISSN 1307-6884
RBP
xt �i ) � xt �1 max( ~
IV. PERFORMANCE EVALUATION As mentioned before, the error function is the difference between the computed output and the desired target, so it is often used as an evaluation rule. In this paper, the adopted evaluation function is as follows
E (i )
1 M
M
¦ |~x
t �i
t 1
It is noted that where
� xt �i |, i
0,1,�, d � 1.
~ xt �i is the predict value, xt �i is the real
closing price, and M is the number of trading days in total predict period. E (i ) denotes the average absolute error of the
i th day in total predict period.
393
© 2005 WASET.ORG
PROCEEDINGS OF WORLD ACADEMY OF SCIENCE, ENGINEERING AND TECHNOLOGY VOLUME 1 JANUARY 2005 ISSN 1307-6884
In the financial application of neural network forecasting model, making money is the most important goal, and then it lies on the trend accuracy of the forecasting model, so the trend accuracy is a most important evaluation criterion in evaluating the performance of forecasting model [16]. In this paper, the trend accuracy in direction (TAD) is used to measure the performance of the mining system. The trend accuracy can be computed as follows: M
¦D TAD (i ) where
D ji
ji
j 1
u100%
M
xt �i � xt �1 )( xt �i � xt �1 ) ! 0 1 if ( ~ , i [0, d ) ® else ¯0
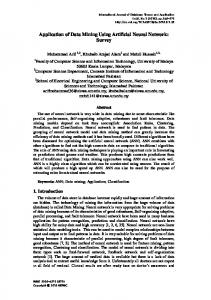
Fig. 1. The comparisons between the predict value and the real value
where ~ xt � i is the predict value in the i th trading day. In addition, the number of total trading (NTT), the number of buying (NB), the number of selling (NS), the number of profitable trading over the total selling trading (NPT), the success rates of selling among the total number of selling (SRS) are calculated for evaluating the mining system. V. SIMULATION RESULTS The presented mining system was implemented in C++ for Dos on a PC. The performance of this system was evaluated by trading the Shanghai Composite Index from June 1995 to June 2003. The training patterns in this paper are the closing price of 500 trading days from 1993. The parameters are designed as follows: n 20, m 5, K 0.01, O 0.5, d 30,
R BT
0.04, RST
0.025, E
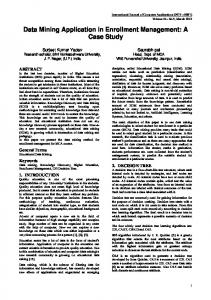
Fig. 2. Comparisons of returns between mining system and buy and hold strategy
0.5. The initial weights
and thresholds are randomly set in [-0.5, 0.5]. All the training patterns are selected randomly to train network about 15000 times, the process is repeated until the stop criteria is met. The trained network predicts the closing price of future 30 days, and then the training period is moved forward one trading day.
VI. CONCLUSION The average trend accuracy is 56.3% over 30 days, the success rate of selling is 85.71% from Table 1, although some opportunities cannot be captured by this system, a missed opportunity to profit does not mean lost money. From Fig. 2, it can know that the presented mining system perform better in bear market than in bull market, it denotes that the mining system have better capability of controlling risk. For Fig. 2, the return achieved by the mining system is 6, and the return achieved by the buy and hold strategy is 1.64. The former is three times as large as the latter. So the mining system is superior to the buy and hold strategy. The result of mining Shanghai Composite Index in the period from using the presented system was encouraging. This mining system can be actual application and is most efficient for combinational investment. In addition, the presented strategies avoid effectively the overfitting and poor explanation problem. The future work is to strive for making the system more adaptive to the application and applying the system to other market indices and individual stock.
the current trainingerror! 1.2* Min(allthe trainingerror) is the stop criteria. The network is retained every 150 days. The comparisons between the predict value and the real value can be seen in Fig. 1. The comparisons of returns between the mining system and the buy and hold strategy can be seen in Fig. 2. All returns were calculated after taking the actual transaction costs for each transaction into consideration, namely the transaction costs for buying and selling is 1% respectively. Other statistics can be seen in Table 1. Table 1. Other statistics about the intelligent mining system NTT NB NS NPT SRS 29 15 14 12 85.71%
PWASET VOLUME 1 JANUARY 2005 ISSN 1307-6884
394
© 2005 WASET.ORG
PROCEEDINGS OF WORLD ACADEMY OF SCIENCE, ENGINEERING AND TECHNOLOGY VOLUME 1 JANUARY 2005 ISSN 1307-6884
REFERENCES [1]
[2] [3] [4]
[5]
[6] [7] [8]
[9]
[10]
[11] [12]
[13] [14] [15] [16]
Hornik K., Stinchcombe M. and White H., “Multilayer feedforward networks are universal approximators”, Neural Networks, vol. 2, no. 5, pp. 359–366, 1989 Hertz J. Krogh A. and Palmer R.G., “Introduction to the theory of neurocomputing”, Addi-son-Wesley, Reading, MA (1991) Zurada J.M., “An introduction to artificial neural networks systems”, St. Paul: West Publishing (1992) Smith K.A, Palaniswami M and Krishnamoorthy M., “Neural techniques for combinatorial opti-misation with applications”, IEEE Transactions on Neural Networks (1998) 9:1301–1318 Widrow, B. Rumelhart, D.E. and Lehr, M.A., “Neural networks: applications in industry, business and science”, Communications of the ACM (1994) 37(3): 93–105 Refenes A.P,(ed.), “Neural network in the capital markets”, John Wiley& Sons Ltd (1995) Gately, E, “Neural networks for financial forecasting”, New York: Wiley (1996) Kate A.Smith, Jatinder N.D. Gupta, “neural networks in business: techniques and applications for the operations researcher”, Computers & Operations Research (2000) 27:1023–1044 J. T. Yao, C. L. Tan and H.-L. Poh, “Neural networks for technical Analysis: A study on KLCI”, International Journal of Theoretical and Applied Finance (1999) 2(2): 221–241 Y.S.Abu-Mostafa, A.F. Atiya, M. Magdon-Ismail, and H. White, “Neural networks in finan-cial engineering”, IEEE Transactions on Neural Networks (2001) 12(4): 653–656 E.Schoneburg, “Stock prediction using neural network: A project report”, Neurocomputing, (1990) 12(1): 12–27 Refenes,A.N., A.Zapranis, and G. Francis, “Stock performance modeling using neural net-work: A comparative study with regression models”, Neural Network (1994) 5: 961–970 B. G. Malkiel, “A random walk down wall street”, Norton, New York, NY (1990) Zahedi, F, “Intelligence Systems for Business. Expert Systems With Neural Networks”, Wodsworth Publishing Inc. (1993) 15. Rudolph, S: On Topology, Size and Generalization of Non-linear Feed-Forward Neural Networks. Neurocomputing (1997) 16(1): 1–22 Yao, J.T., H. L. Poh, “Equity forecasting: a case study on the KLSE index”, Neural Networks in Financial Engineering. Proceedings of 3rd International Conference On Neural Networks in the Capital Markets, Oct 1995, London, A. N. Refenes, Y. Abu-Mostafa, J. Moody and A. Weigend (Eds.), World Scientific (1996) 341–353.
PWASET VOLUME 1 JANUARY 2005 ISSN 1307-6884
395
© 2005 WASET.ORG