H OH OH
metabolites
Communication
Application of Pre-Column Labeling Liquid Chromatography for Canine Plasma-Free Amino Acid Analysis Kazuo Azuma 1, *, Yoshiko Hirao 2 , Yoshihiro Hayakawa 2 , Yusuke Murahata 1 , Tomohiro Osaki 1 , Takeshi Tsuka 1 , Tomohiro Imagawa 1 , Yoshiharu Okamoto 1 and Norihiko Ito 1, * Received: 2 December 2015; Accepted: 4 January 2016; Published: 12 January 2016 Academic Editor: Peter Meikle 1
2
*
Department of Veterinary Clinical Medicine, Tottori University, 4-101 Koyama-minami, Tottori 680-8533, Japan;
[email protected] (Y.M.);
[email protected] (T.O.);
[email protected] (T.T.);
[email protected] (T.I.);
[email protected] (Y.O.) Analytical and Measuring Instruments Division, Shimadzu Corporation, 1, Nishinokyo Kuwabaracho, Nakagyo-ku, Kyoto 604-8511, Japan;
[email protected] (Y.Hi.);
[email protected] (Y.Ha.) Correspondence:
[email protected] (K.A.);
[email protected] (N.I.); Tel./Fax: +81-857-31-5433 (K.A.); +81-857-31-6058 (N.I.)
Abstract: Plasma-free amino acid (PFAA) levels are a useful metric for diagnosing cancer and providing a prognosis. However, the use of analysis of PFAA levels has been limited in the veterinary medicine field. We addressed the application of liquid chromatography (LC) using a pre-column labeling technique for analysis of canine PFAA levels. This method significantly shortened the analysis time relative to conventional methods. No diurnal fluctuations were detected at 9:00 AM in most PFAA levels, and food intake increased the levels of some PFAAs, including valine, leucine, tyrosine, phenylalanine, and proline. These results indicate that LC with pre-column labeling is useful for measuring canine PFAA levels, for which time of day and interval after food intake must be taken into consideration. Keywords: Plasma-free amino acid; pre-column labeling; liquid chromatography measurements; canine plasma amino acid levels; pre- and post-food intake
1. Introduction Amino acids (AAs) are important substrates for and regulators of metabolic pathways [1]. Indeed, the balance of plasma-free (PF) AAs is disrupted in various diseases including cancer [2–5]. Moreover, a link has been reported between canine cancer and PFAA levels; plasma levels of glutamine (Gln), serine (Ser), asparagine (Asn), and alanine (Ala) were lower in dogs with malignant mammary gland tumors than in healthy animals [6], while plasma levels of threonine (Thr), proline (Pro), and Ser were reduced in canine oral malignant melanoma relative to controls [7]. These results indicate that PFAA levels are a useful metric for diagnosing canine cancer and predicting prognosis. Several methods are available for measuring AA levels, including liquid chromatography (LC), gas chromatography, and capillary electrophoresis, among others [8]. Although LC methods coupled with optical detection are well established and highly reliable, post-column LC procedures are time-consuming [8]. In contrast, levels of free major AAs in plasma can be determined within 17 min by pre-column derivatization followed by reversed-phase high-performance (HP) LC [9]. The shortened analysis time makes this method suitable for routine investigation of large sample sets [9]. It is posited that one reason why analysis of AA doses has not expanded in veterinary clinical medicine is their complication and the long time they require. Metabolites 2016, 6, 3; doi:10.3390/metabo6010003
www.mdpi.com/journal/metabolites
Metabolites 2016, 6, 3
2 of 10
It is posited that one reason why analysis of AA doses has not expanded in veterinary clinical medicine is their Metabolites 2016, 6, 3 complication and the long time they require. 2 of 10 PFAA levels in humans are influenced by many factors, including diurnal and hormonal fluctuations and the food ingested [10–13]. To our knowledge, however, there are no reports PFAA the levels in humans are influenced byand many factors, diurnal hormonal describing effects of diurnal fluctuations food intakeincluding on canine PFAAand levels via a fluctuations and the food ingested [10–13]. To our knowledge, however, there are no reports describing pre-column LC method. The aim of this study is to evaluate the efficiency of the pre-column LC the effects diurnal fluctuations intake on canine PFAA levels via a pre-column LC method. method forofcanine PFAA analysisand andfood investigate the effects of diurnal fluctuations and food intake The aim of this study is to evaluate the efficiency of the pre-column LC method for canine PFAA which affect PFAA levels. analysis and investigate the effects of diurnal fluctuations and food intake which affect PFAA levels. 2. Results and Discussion 2. Results and Discussion 2.1. Diurnal Fluctuations in Canine PFAA Levels Measured with Pre-Column Labeling LC 2.1. Diurnal Fluctuations in Canine PFAA Levels Measured with Pre-Column Labeling LC Table 1 indicates characteristics of dogs included in this study. All 20 AAs in canine plasma Table 1 indicates characteristics of dogs included in this study. All 20 AAs in canine plasma were separated within 14 min with a cycle time of 27 min, as seen in the chromatographs (Figure 1). were separated within 14 min with a cycle time of 27 min, as seen in the chromatographs (Figure 1). Figure 1 shows chromatograms of (a) an AA standard and (b) a canine plasma sample. PFAA levels Figure 1 shows chromatograms of (a) an AA standard and (b) a canine plasma sample. PFAA levels after deproteinization were under 250 μmol/L. There were no differences in PFAA levels across after deproteinization were under 250 µmol/L. There were no differences in PFAA levels across experimental days. experimental days. Table 1. Characteristics of dogs included in this study. Table 1. Characteristics of dogs included in this study.
No. No.1 12 23 3 4 4 55
Sex Age (years) Body Weight (kg) Sex Age Body Male 4 (Years) 12 Weight (kg) Male Male 11 4 11 12 Male Male 9 11 13 11 Male 9 13 Female 9 11 Female 9 11 Female 5 5 10 10 Female
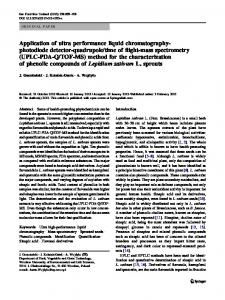
Figure 1. 1. The The schema schema of of pre-column pre-column labeling labeling method. Figure method.
Post-column labeling labeling techniques techniques are are sufficiently sufficiently accurate accurate for for measuring measuring canine canine PFAAs PFAAs [14]. [14]. However, a disadvantage of this method is that it is is time-consuming. time-consuming. For example, in our previous report, separation separation required required110 110min, min,with with a cycle time of 135 pre-column method a cycle time of 135 min.min. The The pre-column method used used here here shortened the analysis time by a considerable margin. PFAA levels are generally constant shortened the analysis time by a considerable margin. PFAA levels are generally constant within a within certain range [10–12]. certain arange [10–12]. In the the present presentstudy, study,there therewas wasnono significant change in PFAA levels measured at 9:00 significant change in PFAA levels measured eacheach day day at 9:00 AM AM 14-h fast (Figures and 3). However, standard of deviations of levels some including PFAA levels after after a 14-hafast (Figures 2 and 3).2However, standard deviations some PFAA His, including His,and Thr,Pro Gly,were Ala, large. and Pro were large. Our results it is true the PFAA most canine Thr, Gly, Ala, Our results indicate that itindicate is true that the most canine levels PFAA diurnalThey fluctuations. They indicate thataffects some PFAA hormones exhibit levels diurnalexhibit fluctuations. also indicate thatalso some hormones levelsaffects [15]. InPFAA facts, sex is a factor which affects PFAA levels [15]. To understand the diurnal fluctuations of plasma His, Thr, Gly, Ala, and Pro levels, a study separated into male or female is needed. It is also reported
Metabolites2016, 2016,6, 6,33 Metabolites
of10 10 33of
levels [15]. [15]. In In facts, facts, sex sex is is aa factor factor which which affects affects PFAA PFAA levels levels [15]. [15]. To To understand understand the the diurnal diurnal levels Metabolites 2016,of 6, 3plasma 3 of 10 fluctuations of plasma His, His, Thr, Thr, Gly, Gly, Ala, Ala, and and Pro Pro levels, levels, aa study study separated separated into into male male or or female female is fluctuations is
needed. ItIt is is also also reported reported that that PFAA PFAA levels levels exhibit exhibit circadian circadian rhythm rhythm in in humans humans [16,17]. [16,17]. On On the the needed. other hand, hand, itit is is reported reported that that serum serum hydroxyproline hydroxyproline level level does does not not affect affect circadian circadian rhythm rhythm in in dogs dogs other that PFAA levels exhibit circadian rhythm in humans [16,17]. On the other hand, it is reported that [18]. A A study study must must be be conducted conducted focusing focusing on on circadian circadian rhythmicity rhythmicity of of canine canine PFAA PFAA levels levels in in the the [18]. serum hydroxyproline level does not affect circadian rhythm in dogs [18]. A study must be conducted future. future. focusing on circadian rhythmicity of canine PFAA levels in the future.
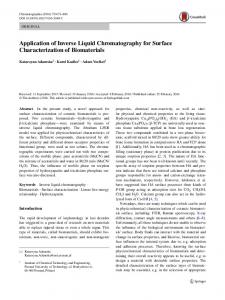
Figure 2. Representativechromatograms chromatogramsof AA standard and a canine plasma sample. Figure 2. 2. Representative Representative chromatograms ofof (a)(a) anan AA standard and (b) (b) canine plasma sample. The Figure (a) an AA standard and (b) aa canine plasma sample. The The concentration of AAs in standard the standard solution is μmol/L. 250 µmol/L. concentration of AAs AAs in the the standard solution 250 μmol/L. concentration of in solution isis 250
(a) (a)
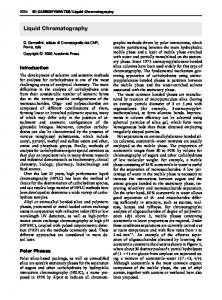
(b) (b) Figure 3. 3. Diurnal Diurnal fluctuations in AA concentration. Data are shown asas mean SD. Results forfor (a) Figure 3. are shown as mean ±± SD. Results for (a) Figure Diurnalfluctuations fluctuationsin inAA AAconcentration. concentration.Data Data are shown mean ˘ SD. Results essential and (b) non-essential AAs are shown. essential and (b) non-essential AAs are shown. (a) essential and (b) non-essential AAs are shown.
Metabolites 2016, 6, 3
4 of 10
2.2. Changes in PFAA Levels after Food Intake At 15 and 30 min after feeding, the levels of all PFAAs were equal to or slightly lower than pre-feeding levels (Table 2). At 2, 3, 4, and 6 h after feeding, plasma PFAA levels were increased relative to pre-feeding levels and those measured at the 15 and 30 min time points. At 2 h post-feeding, Leu levels were higher than before and 15 and 30 min after feeding, whereas Tyr levels were higher than at 15 and 30 min post-feeding (Figure 4). At 3 h after feeding, Val, Leu, Tyr, and Phe levels were increased as compared to those measured 15 and 30 min after feeding, and at 2, 3, and 4 h post-feeding, Pro levels were higher than 15 and 30 min post-feeding levels (Figure 5). Table 2. PFAA concentrations before (Pre) and at indicated times after food intake.
His Thr Arg Val Met Trp Phe Ile Leu Lys Asp Glu Asn Ser Gln Gly Ala Tyr Cys Pro
His Thr Arg Val Met Trp Phe Ile Leu Lys Asp Glu Asn Ser Gln Gly Ala Tyr Cys Pro
Pre
15 min
30 min
1h
2h
803.4 ˘ 88.4 66.1 ˘ 27.0 110.3 ˘ 21.0 146.4 ˘ 19.8 61.4 ˘ 7.4 79.7 ˘ 26.9 67.1 ˘ 11.5 56.1 ˘ 7.1 86.8 ˘ 11.4 51.3 ˘ 23.2 26.8 ˘ 4.9 80.6 ˘ 16.2 62.1 ˘ 6.0 214.9 ˘ 29.4 909.1 ˘ 137.1 157.2 ˘ 30.1 514.3 ˘ 55.1 50.0 ˘ 8.5 17.7 ˘ 9.4 273.3 ˘ 50.3
713.6 ˘ 96.9 62.1 ˘ 25.4 95.7 ˘ 25.7 128.8 ˘ 17.5 50.6 ˘ 8.9 79.6 ˘ 28.7 57.3 ˘ 1.8 49.4 ˘ 8.3 76.1 ˘ 14.7 36.1 ˘ 7.3 22.9 ˘ 8.8 84.3 ˘ 8.8 67.6 ˘ 32.2 182.7 ˘ 12.3 779.7 ˘ 119.0 135.4 ˘ 25.2 452.9 ˘ 55.4 42.0 ˘ 8.3 14.3 ˘ 7.4 244.4 ˘ 39.7
725.2 ˘ 85.3 63.9 ˘ 19.7 98.2 ˘ 21.1 133.0 ˘ 16.6 55.7 ˘ 7.1 88.1 ˘ 22.2 61.8 ˘ 11.4 51.0 ˘ 7.8 84.4 ˘ 14.9 35.8 ˘ 5.2 23.4 ˘ 3.9 74.5 ˘ 11.7 58.8 ˘ 12.9 201.5 ˘ 31.7 779.0 ˘ 105.6 143.2 ˘ 31.0 465.3 ˘ 70.3 40.5 ˘ 5.6 12.5 ˘ 1.7 252.1 ˘ 40.9
747.4 ˘ 99.7 71.6 ˘ 10.2 106.5 ˘ 15.3 164.1 ˘ 43.9 58.4 ˘ 7.7 97.9 ˘ 17.1 68.3 ˘ 12.7 65.9 ˘ 19.4 119.5 ˘ 37.7 45.2 ˘ 18.4 22.8 ˘ 4.5 70.8 ˘ 5.0 74.3 ˘ 13.0 188.2 ˘ 16.7 752.1 ˘ 82.7 142.7 ˘ 23.4 490.1 ˘ 38.4 54.0 ˘ 9.6 14.8 ˘ 1.7 285.7 ˘ 56.2
844.1 ˘ 184.6 96.6 ˘ 16.5 123.7 ˘ 34.8 221.1 ˘ 91.2 68.3 ˘ 15.3 111.6 ˘ 27.6 81.8 ˘ 16.9 84.8 ˘ 38.2 171.3 ˘ 74.6 52.6 ˘ 42.2 27.9 ˘ 11.2 79.2 ˘ 20.4 92.9 ˘ 27.0 207.5 ˘ 42.0 834.1 ˘ 205.9 159.3 ˘ 19.7 578.0 ˘ 160.0 68.2 ˘ 15.6 17.5 ˘ 5.3 402.3 ˘ 160.1
3h
4h
6h
8h
24 h
776.7 ˘ 139.2 92.8 ˘ 36.5 122.8 ˘ 37.9 258.3 ˘ 20.60 * 40.7 ˘ 24.5 104.2 ˘ 12.94 87.5 ˘ 21.1 * 87.3 ˘ 43.1 167.5 ˘ 69.3 * 86.3 ˘ 16.1 31.3 ˘ 10.6 91.5 ˘ 40.0 91.7 ˘ 14.8 215.9 ˘ 14.66 812.7 ˘ 31.46 160.0 ˘ 95.8 538.2 ˘ 130.5 71.2 ˘ 38.8 18.5 ˘ 2.3 442.9 ˘ 117.7
687.7 ˘ 109.2 73.9 ˘ 24.4 108.9 ˘ 22.4 220.6 ˘ 48.1 * 54.8 ˘ 24.5 110.8 ˘ 12.97 79.3 ˘ 7.2 * 77.3 ˘ 43.1 150.7 ˘ 69.8 * 94.4 ˘ 16.3 25.1 ˘ 7.8 70.9 ˘ 41.5 93.1 ˘ 14.8 211.7 ˘ 14.62 817.8 ˘ 31.41 171.7 ˘ 95.8 485.8 ˘ 130.4 66.0 ˘ 38.8 21.0 ˘ 11.5 437.1 ˘ 117.7
809.0 ˘ 111.2 67.2 ˘ 18.8 113.3 ˘ 24.5 191.3 ˘ 27.4 64.9 ˘ 7.8 111.1 ˘ 27.3 74.9 ˘ 9.1 66.0 ˘ 11.0 128.7 ˘ 13.0 102.6 ˘ 68.4 29.3 ˘ 10.3 79.4 ˘ 17.5 94.7 ˘ 24.4 240.4 ˘ 45.5 831.0 ˘ 94.6 185.8 ˘ 40.3 500.1 ˘ 41.6 64.9 ˘ 12.0 16.9 ˘ 2.3 442.8 ˘ 44.0
807.9 ˘ 100.9 61.8 ˘ 17.8 110.9 ˘ 9.5 166.5 ˘ 27.7 63.9 ˘ 12.9 98.5 ˘ 26.5 68.1 ˘ 8.4 55.7 ˘ 6.9 107.1 ˘ 16.2 93.4 ˘ 52.6 32.8 ˘ 13.6 83.1 ˘ 14.8 84.5 ˘ 14.6 238.2 ˘ 31.4 814.8 ˘ 64.2 181.7 ˘ 30.3 458.4 ˘ 38.8 63.2 ˘ 11.5 16.4 ˘ 4.3 398.0 ˘ 51.3
665.3 ˘ 116.2 57.7 ˘ 20.1 112.3 ˘ 20.6 174.3 ˘ 39.0 51.8 ˘ 12.9 52.4 ˘ 26.6 66.2 ˘ 10.1 62.3 ˘ 6.93 101.3 ˘ 16.2 78.4 ˘ 52.6 29.0 ˘ 13.6 85.1 ˘ 14.8 58.3 ˘ 14.8 186.5 ˘ 31.4 887.3 ˘ 95.8 139.9 ˘ 30.3 489.1 ˘ 38.8 56.2 ˘ 11.7 19.8 ˘ 7.4 229.9 ˘ 51.3
Data are shown as mean ˘ SD. * p < 0.05 vs. 15 and 30 min post-food intake.
Metabolites 2016, 6, 3 Metabolites 2016, 6, 3
5 of 10 5 of 10
(a)
(b)
(c) Figure 4. Changes in Val (a); Ile (b); and Leu (c) concentrations after food intake. Data are shown as Figure 4. Changes in Val (a); Ile (b); and Leu (c) concentrations after food intake. Data are shown as mean ± SD. * p < 0.05 vs. 15 and 30 min post-food intake. † p† < 0.05 vs. pre-food intake. mean ˘ SD. * p < 0.05 vs. 15 and 30 min post-food intake. p < 0.05 vs. pre-food intake.
Metabolites 2016, 6, 3 Metabolites 2016, 6, 3
6 of 10 6 of 10
(a)
(b)
(c) Figure 5. 5. Changes Changes in (a); Phe Phe (b) (b) and and Pro Pro (c) (c) concentrations concentrations after after food food intake. intake. Data Data are are shown shown as as Figure in Tyr Tyr (a); mean ˘ ± SD. mean SD.**pp