4th Int'l Conference on Advances in Engineering Sciences & Applied Mathematics (ICAESAM'2015) Dec. 8-9, 2015 Kuala Lumpur (Malaysia)
Application of Quality Function Deployment for Rubber Seedlings Business A. Srichan1 and M. Sasananan2
research. This method would satisfy the needs of customers by using the current available resources in the most efficiently way. [6]-[8].
Abstract— This research is the application of Quality Function Deployment to find the way to meet the customer needs for rubber seedlings business. The research began by collecting the voice of customer which were converted to the customer needs. Then the customer needs were used for questionnaire survey to prioritize their importance and the customer satisfaction performance. Needs of customers selected from the ranks were analyzed by 4phases of QFD. The results of this analysis led to the creation of guidelines for improving products and processes that focused on meeting the needs of customers
II. METHODOLOGY This research is organized as follow A. Define, organize and classify the customer needs The first step in obtaining the voice of the customer (VOC) for this research was to conduct interviews. Thirty of the customers were sampled; the research has shown that 20-30 interview comprehensive information required approximately 95% of customer needs [9]. The interviews were one-on-one conversations to define “WHAT” their expectations from the rubber seedling product and service. The collected VOC were interpreted and compiled to understand and easy to apply. Then the compiled data were organized using an affinity diagram and a tree diagram to organize and classify the customer needs. The 85 consequences were grouped into four similar categories and determined as the factor for operated in the next step.
Keywords—Quality Function Deployment, Voice of Customer, House of quality, Rubber Seedlings Business I. INTRODUCTION
P
ARA rubber is an important agricultural product in Thailand, with the sizing rubber growing areas is only the second from Indonesia. From 2006 to 2011, the rubber growing area expanded from 0.86 million hectares to 3.00 million hectares. The expansion was a result of the government’s support policy; total production increased at an average of 1.53% per year, from 3.07 million tons in 2006 to 3.35 million tons in 2011[1]. The rubber plantation area expansion is steadily increasing to the new operators those who want distribute the rubber seedlings [2]. Although now expanding rubber cultivation began to be diminished due to rapidly expanding farmland in the early stages and it had cause rubber prices dropped sharply in 2012, Furthermore the economic crisis of the EU and the US, the tsunami that hit Japan in March, The major flood in Thailand in late 2011 also the political unrested in Thailand recently have affected the automotive industry and the others [3],[4]. From all above have made the rubber plant demand down. However, the new generation farmers start gaining knowledge to bargain and expect better quality from rubber seedlings before purchasing [5] so the rubber seedling selling experiences difficulty and high competition. Additionally, the providers, the middlemen, also have turned themselves to become producers by researching the method to grow their own rubber in the lower cost. To increases the capability of rubber production to meet the highest needs of their customers so that the technique of Quality Function Deployment - QFD has applied to this
B. Survey This step was to find “HOW” the importance and the satisfaction rating for each consequence, for rubber seedling of the organization and the competitor, by customer determining. All consequences were assigned the satisfaction scale from 1 to 5, relative both how important and how well to the customer thinks for each consequence. The satisfaction rates for each item if it was made by the comparison of the competitors to determine and represent the target of the improvement. This survey was conducted of 98 customers for 95% confidence level. The sample size can be formulated as the following equation [10]. (1) Where is a required sample size, is the table value of chi-square for 1 degree of freedom at the desired confidence level (3.841), N is the population size, P is the 'population proportion (assumed to be 0.50 since this would provide the maximum sample size) and d is the degree of accuracy expressed as a proportion (0.05). The survey result was determined by geometric mean, which calculated for the individual rating for each the test [11], [12]. The rating is given by
Ancharee Srichan1 is now with the Department of Industrial Engineering, Thammasat University, Pathum Thani, Thailand (phone: +66882932828 ; e-mail:
[email protected]). Montalee Sasananan2, is with Thammasat University, Pathum Thani, Thailand. She is now a lecture of the Industrial Engineering, Thammasat University, Pathum Thani, Thailand (e-mail:
[email protected]) 25
4th Int'l Conference on Advances in Engineering Sciences & Applied Mathematics (ICAESAM'2015) Dec. 8-9, 2015 Kuala Lumpur (Malaysia)
The sixth column is Sale point (B1-6).This column is defined by the team and shown the advantages of the product or service compared to the competitor, the configuration of the sale point is 1 = not sale point, 1.2 = a mediocre sale point, and 1.5 = more sale points. The seventh column is a Raw weight (B1-7), the column which shows the rate of importance to the customer. The raw weight is calculated through sale point (B1-6), multiplied by the Improvement Ratio (B1-5) and importance to the customer (B1-1), using equation (4)
(2) where N is the overall rating and N1, N2, N3, .., Nn is the ratings for n different tests. The overall rating is a means of obtaining a comprehensive measurement by evaluating both what is important to a customer and how well they thinks about each consequence for seeding of the organizations and the competitors. The results are used for evaluate resource allocations, as if the customer satisfaction is lacking on the consequence that they is very important, the first priority should be focused to improve.
Raw weight = Sale point x improvement ratio x Importance to customer (4) The raw weight used for indicate the importance level while high score shows more important and low score shows less important. This will be converted into percentages or Normalized raw weight (B1-8) for the easier calculation later. The normalized raw weight was calculated as below.
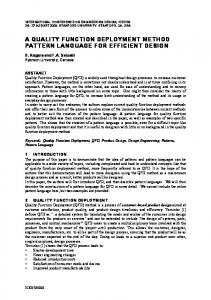
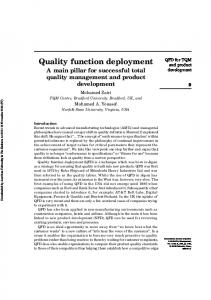
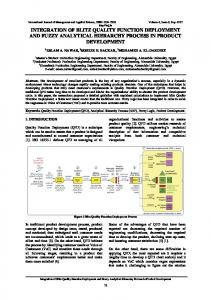
C. Develop Quality Function Deployment (QFD) technique The importance rating of the various factors that affect the customer satisfaction has to be used in the process of applying QFD four-phase matrix consisting of four metrics are correlated as Fig 1.
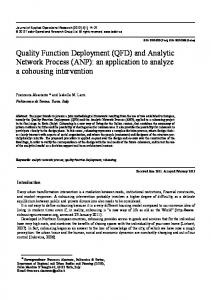
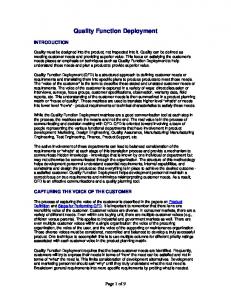
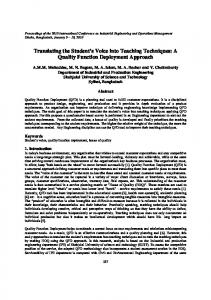
(5) After the customer consequence (A1) was analyzed in planning matrix (B1), the next step in the construction of HOQ is the development of the Technical requirements (C1) which design specifications that satisfy customer needs on the upper side of HOQ. The technical requirement is translated from the customer consequences and each consequence can have one or more technical requirement, focus on designing specific and measurable design aspects that ensure the end product meets the customer needs. This aspect QFD directly in the organization control, so the technical requirement should be within control of the business. When the customer consequence (A1) and the technical requirements (C1) were developed, the matrix defined the Relationships (D1) on the center of HOQ by using scale as 1 = weak, 3 = moderate and 9 = strong. The relationship between them identifies the technical requirements that satisfy the customer consequent and determines the appropriate investment of the resources for each. The correlations of the relationship matrix display the scale that determined on the basis of research conducted using resources available on the internet. On the roof of HOQ, the technical correlation (E1) maps the relationships and interdependencies among the technical requirements, the relationships which are assigned by the researcher were plotted by using symbol “+” for supplementary relationship and “-” for refuting relationship. The symbols are used to represent the strength of the relationship and inform the development process, revealing the existence and nature of bottlenecks in the improvement process. The final part, Technical matrix (F1) is constructed at the bottom of HOQ. This matrix addresses the relative importance of technical requirement (F1-1), Technical evaluation (F1-2), and Target value (F1-3). The relative importance of each technical requirement is the summation of value which is calculated by multiplying the scale value that assigned to the relationship between customer consequence (1,3 or 9) multiplied by normalized raw weight (B1-8). The result is a comprehensive measure that indicates the degree which the
Fig. 1 The four metrics correlation of QFD 4 phase
Phase I, Production planning: The House of Quality (HOQ) will be used for this phase. At this stage, the 85 consequences of customer needs were translated into technical requirement, each consequence can have one or more technical requirement which it must be within the control of the business and must be measurable to determine and represent the improvement. The first step was to specific all Customer consequences (A1) on the left side of HOQ. After that determined the data of planning matrix (B1) on the right side of HOQ. This matrix provides the market data, facilitates the goal setting for products or services improvement and permits prioritization of the customer needs. The customer survey was used for determination and calculation this matrix which consists of eight column topics such as Importance to customer (B1-1), Customer satisfaction performance (B1-2) and Competitive satisfactory performance (B1-3) that results from the formulation of survey ranking by geometric mean. The fourth column of planning matrix is the Goal (B1-4) that the team is set to target which is usually higher than the achievement in the current. The goal is classified by the team using weights from 1 to 5, 1 is low and 5 is high. The fifth column is Improvement ratio(B1-5), which is a measurement of the effort to improve. The improvement ratio was obtained from the follow equation Improvement ratio = Goal Customer satisfaction performance)
(3)
26
4th Int'l Conference on Advances in Engineering Sciences & Applied Mathematics (ICAESAM'2015) Dec. 8-9, 2015 Kuala Lumpur (Malaysia)
specific technical requirements contribute to the customer requirement, using equation (6). F1-1(cell) = ∑[Di,j × B1-8(cell)]
process parameters including their importance value are the output of this phase. Phase IV, Production operation planning: Due to this phase is the last phase and not continue use for any next matrix so the allocated process parameters which selected from the most priority of partial characteristics importance will be not used to construct any matrix, but the process will create the operation process to guide for improving products and processes that focused on meeting the needs of customers.
(6)
The technical evaluation of the competition and the product is carried out by the improvement team. The process is performed by research and analyzes the numeric value of technical characteristic for the products and the competitors. Following completion of relative importance of technical requirement and technical evaluation, the improvement team uses above data for consideration the appropriate target value of technical requirements to drive the improvement processes. The House of Quality structure is shown as in Fig. 1.
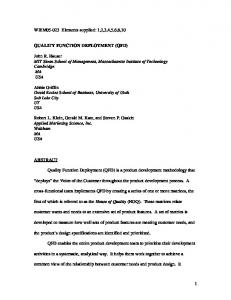
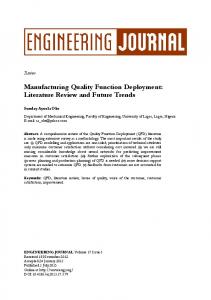
III. RESULTS In the first phase, HOQ was constructed and processed. The input 85 customer requirements which gathered from the survey were translated to 86 technical requirements of the rubber seedling product and service as the Fig. 2. The relative importance of each technical requirement was analyzed and compared to prioritize the most relative importance rating for improvement on the most critical customer requirement.
E C
Da,2
Da,3
…
Da,n
Ab
Db,1
Db,2
Db,3
Db,n
Ac
Dc,1
Dc,2
Dc,3
Dc,n
Ai
Di,1
Di,2
Di,3
F1
importance of technical requirement
F2
Technical evaluation
F3
Target value
B3
B4
B5
B6
B7
B8
Normalized raw weight
Da,1
B2
Raw weight
Aa
B1
Sale point
Cn
Improvement ratios
…
Goal
C3
Competitive satisfaction performance
C2
Customer satisfaction performance
C1
Importance to customer
B
A
E1
C1
Di,j
A1
D1
B1
Fig. 1 House of Quality structure
Phase II, Designed deployment: The technical requirements will be translated into part characteristic. The matrix in this phase is constructed like HOQ in phase I by using the technical requirements which was prioritized and selected with higher rating in phase I to input on the left side of the matrix (A2) and using data in the technical matrix (F1) to place and calculate on the right side (B2). After that, define part characteristic of product and service, converted from selected technical requirements, on the upper side of the matrix (C2). Then define the relationship between technical requirements and part characteristic by using a standard scale 1-3-9 scale. The above method lead to construct the bottom side of the matrix (F2) by calculating the relative importance of each part characteristic which helped to prioritize and allocate the most critical part characteristic that effected to the customer requirement. The evaluation and the target of the part characteristic will be defined in the last process of this stage to be used for developing the planning matrix in the next phase. Phase III, Process planning: The purpose of this phase is a translation from part characteristics into process parameters. The method of matrix construction on this stage is the same way of phase I and phase II that is the selected part's characteristics will allocated to be the input data and the
F1
Fig. 2 House of Quality in rubber seeding product and service planning.
The results of discussion show that the technical requirements with high score of relative importance rating should be given 26 items to improve and control, including : the level of awareness of the service, the duration of the rootstock nursery, the frequency of irrigation, the difference between sale price and the cost, the frequency of fertilizer, the reliability of the data, the duration of the production of seedlings, the percentage error of the data, the integrity of the seedlings before planting, the knowledge level of staff, the percentage of the cost for seedling booking, the percentage of damage in transit, the reliability of merchantability, the ability of employees, the level of the age of sail, the percentage of canceled orders, the number of documents for contract
27
4th Int'l Conference on Advances in Engineering Sciences & Applied Mathematics (ICAESAM'2015) Dec. 8-9, 2015 Kuala Lumpur (Malaysia)
reservations, the percentage of waste, work experience, the frequency of update information on the site, the difference between the sale price and the market price, the survival rate in the plantation, the reliability of the sources of the breeder, packaging appearance, the moving tools for rubber seedlings ,and the variety of product. In the second phase, all above selected technical requirements in the first phase were used to be input data in the design deployment matrix. In this phase, the 26 technical requirements were converted into 39 part characteristics. And after defining the relationship and prioritized the relative importance of each part characteristic, 20 part characteristics with scores over than 2.0 points were selected to analyze in the next phase as the TABLE I.
TABLE II THE RESULTS OF PHASE III : PROCESS PLANNING Process Parameters Topic 1. Setting standard performance for rubber seedling production. 2. Setting standard performance for team 3. Setting standard performance for public relations. 4. Determining manpower and recruitment. 5. Training the staff on standard operating procedures. 6. Evaluation the quality of work
TABLE I THE RESULTS OF PHASE II : DESIGN DEPLOYMENT Part Characteristics Topic
Direction
1.Number of staff to meet the standard operation.
↑
2.Performance of training
↑
3.Timing to work 4.Number of water springer per square meter 5.Frequency of water per day 6.Frequency of fertilizers per month 7.Number of production workers
↑
8. Timing to seed. 9.Timing to prepare plant materials 10.Period of raising seedlings 11.Quantity of seedling production
o ↓ o ↑
12.The integrity of the seedlings
↑
13.Timing to prepare plantation 14.Number of public relations content 15.Number of information change 16.Number of responsible personnel 17.Selling price 18.Product cost 19.The amount of seeding booking 20.Standard price
↓ ↑ ↑ ↑ ↓
o o o ↑
↓ ↓ ↓
Target
Direction ↑ ↑ ↑
Target 100 % of the production process. 100 % of the production process. 100 % of the production process. 100 % of task
↑ ↑ ↑
7. Improvement of wage and welfare. 8. The budget allocation for the purchase of equipment.
↑
9. Analyzing the product cost 10.Development of cost reduction project
↑
↑
100 % of all personnel 1 time per year 1 time per year To support the task 100 % . Covering actual costs 100 % of cost At least one project
↑
Everyone
In the fourth phase, all the selected process parameters were used for establish the operation plan which defines how performance to achieve the goal for each parameter. Each operation plan was detailed about the operation name, the operational objectives, action plan, success indicators, and responsible persons. The operation plans were organized into 3 parts: the part of production, the part of human resources, and the part of financial. For this research, the entrepreneur gave priority to improve the production because the process improvement directly affects the quality of the products including the existing resources were available to support the improvement immediately. In addition, the results of the production process improvement could be used for analyze to improve the process in the part of human resources such as work load, manpower and responsibility. Clearly, for the financial process improvement, the entrepreneur emphasized to improve only some procedures that were needed and involved or impacted to the quality of products or service because of the limited budget. Due to the period of research was limited, so the improvement was focused on bringing the plan into practice as a concrete such as uploading the improved products and services on the website, producing the standard products, preparing of sale operators, and improving the environment of the seedlings storage and sale area. After ensuring that the customers notice a better change for improvement, the survey was conducted for satisfaction evaluation to compare with the previous assessment and the determined target. The researchers surveyed the satisfaction of customers with original 85 customer needs again by random customer survey 79 samples from 98 customers who had surveyed the satisfaction levels before the improvement. The results shown that satisfied after improvement adjusted average of 4.56, better than the early survey result with the average score 4.05 and over the average target set at 4.40. Considering the level
100 % of the training content > 1 year 0.06springer per square meter 2 times per day 0.75 time per month Up to seedling quantity 6- 8 months Less is better 3-4 months Up to next year trend As the government standard Less is better More is better Less is better >= 1 person


![[PDF] QFD: Quality Function Deployment - Google Sites](https://m.moam.info/img/260x300/pdf-qfd-quality-function-deployment-google-sites_6477c7f9097c4744708c185c.jpg)