IJBR
INTERNATIONAL JOURNAL OF BIOTECHNOLOGY RESEARCH • January-June 2011 • Volume 4 • No. 1, pp. 11-18
International Science Press
Application of Response Surface Methodology for Production of Capsaicin from Capsicum Annum L. L. A. Sagwan*, S. A. Survase and U. S. Annapure** Food Engineering and Technology Department, Institute of Chemical Technology, University of Mumbai, Matunga, Mumbai 400 019, India
ABSTRACT Plant cell cultures are an attractive alternative source to whole plant for the production of high-value secondary metabolites. Taking advantage of this an optimization of different concentration of plant growth regulator was screened to obtain maximum callus growth and capsaicin production. A Statistical Design (Response Surface Methodology) was used in media optimization of chilli callus suspension culture. An increase in capsaicin yield from 29.89 µg/g dry weight cell mass to 36.32 µg/g dry weight cell mass was observed. Specific growth rate, Doubling time and Capsaicin production were higher for 25 g FW/L Inoculum size. Thus RSM was successfully used for increasing secondary metabolite production in suspension cell cultures. Keywords: Capsaicin, Response Surface Methodology, Plant Tissue Culture, Capsicum Annum, Secondary Metabolite, Suspension Cell Culture, Chilli Callus Capsaicinoids.
Many higher plants are major sources of natural products used as pharmaceutical, agrochemicals, flavor and fragrance ingredients, food additives, and pesticides (Balandrin and Klocke, 1988). These belong to a group collectively known as secondary products or secondary metabolites. Research in the area of plant tissue culture technology has resulted in the production of many pharmaceutical substances for new therapeutics such as alkaloids, terpenoids, steroids, saponins, phenolics, flavanoids, and amino acids. The Phenolic compounds characteristic to fruits of the genus Capsicum, are commonly called capsaicinoids. Capsaicin and dihydrocapsaicin, are the most abundant pungent principles in hot peppers, and are responsible for 90% of the total pungency (Kosuge and Furata, 1970). Capsaicinoids are derivatives of phenylopropanoid compounds (Sudhakar Johnson et al., 1992). They are characterized by a high biological activity and their pharmacological, neurological and dietic effectiveness is well known. For effective capsaicin production, it is highly essential to optimize all the culture conditions and composition of medium. However, practically to optimize all the parameters and to establish the best possible conditions by interrelating all the parameters, numerous experiments have to be carried out which is not economical and practical. The traditional one-factor at a time approach to optimization is time-consuming and incapable of reaching the true optimum especially due to *Corresponding author: *
[email protected]; **usa@udct. org;
interaction among factors. Moreover, it assumes that the various growth parameters do not interact and that the process response is a direct function of the single varied parameter. Unlike conventional optimization, statistical optimization methods such as response surface methodology can take into account the interaction of variables in generating the process response (Haaland, 1989). Response surface methodology is a collection of mathematical and statistical techniques useful for analyzing the effects of several independent variables (Box and Hunter, 1978). RSM can be used to identify the effect of individual variables, evaluate the relative significance and seek the optimum constituents (Adinarayana et al. 2003; Elibol, 2004). These methods are often employed after a ‘‘vital few’’ controllable factors are identified and you want to find the factor settings that optimize the response. 1. MATERIALS AND METHODS
Materials Kinetin, 2, 4-Dichlorophenoxy acetic acid, agar, di-sodium EDTA were procured from HIMEDIA Laboratories Pvt, Ltd. Mumbai. CaCl 2.2H 2O, MgSO 4.7H 2O, (NH 4)2 SO 4, Ca(NO3)2.4H2O, NaH2PO4.H2O, MnSO4.H2O, CuSO4.5H2O, Fe2SO4.7H2O, ZnSO4.7H2O, KI, KH2PO4, MgSO4.7H2O, FeCl3.6H20, inositol, sucrose, glucose, nicotinic acid, pyridoxine, glycine thiamine, ethanol, dry acetone, phosphomolybdic acid, Mercuric acid were procured from S. D. Fine chemicals Ltd. Mumbai. KNO3, HCl, CoCl2.6H2O, NH4NO3,H3BO3, Na2MoO4.2H2O, Na 2 SO 4 , sodium potassium tartarate, ammonium molybdate, ascorbic acid, sodium hypochlorite,
12 / L. A. Sagwan, S. A. Survase and U. S. Annapure
benzylkonium chloride, Capsaicin were procured from E. Merck - Mumbai. Explant Capsaicin annuum seeds (variety Jwala) were obtained from a seed producing company in Byculla, Mumbai, India. Method Generation of Healthy Seedlings High capsaicin-yielding seeds of C. annum were surface sterilized with 0.1% Mercuric chloride solution for a period of ten minutes. The sterile seeds were placed in basal Murashige and Skoog (MS) media supplemented with vitamins but devoid of plant growth regulators. Basal MS media was selected since it consisted of entire major nutrients in sufficient quantities. The seedlings obtained were differentiated into roots, hypo cotyledons and cotyledons. Optimization of the Age of the Seedlings The seeds were grown on MS media and hypocotyledons from the seedling of different age (7 days, 14 days, 21 days and one month old seedlings) were inoculated on the Gamborg (B5) media supplemented with 2, 4 Dichloro phenoxy acetic acid (2, 4–D) (2 mg l –1) and Kinetin (K) (0.1 mg l–1). The effect of age of seedlings was studied on the growth of callus and production of capsaicin. Screening of Explants for Callus Growth and Production of Capsaicin Different parts of the seedlings were divided into hypcotyledons, cotyledons and roots and screened as explants. The callus growth and production of capsaicin in each of the part was reported. The different explants were inoculated on different medium MS and B5 media supplemented with vitamins and plant growth regulators. The percentage of explants that showed initiation and proliferation among the inoculated explants were noted down for all different parts. Effect of Different Concentration of Plant Growth Regulators on Callus Growth and Capsaicin Production Sterilized explants were aseptically transferred into tubes containing MS and B 5 medium supplemented with vitamins and varying combinations of plant growth regulators 2, 4–D + kinetin. With the help of Latin Square Arrangement the combination that produced optimum callus growth and production of capsaicin was determined. Dry weight (DW) of callus was measured after two subculture (45 days) and capsaicin content was estimated spectrophotometrically at 650 nm using Hitachi UV/Vis Spectrophotometer.
Cultivation of Capsaicin Cells Media was defined as growth and production depending on whether the particular media combination gave high biomass yield or capsaicin content. Callus grown in B5 media supplemented with optimized 2, 4–D and Kinetin were aseptically excised into pieces, macerated with the aid of a sterile spatula and transferred into B5 liquid media to obtain a suspension culture. The fine uniform cell suspension free from clumps was agitated on an orbital shaker at 110 rev min -1 and 25°C with light. The suspension culture was maintained by sub culturing every seven days. Optimization of the Inoculum Size Inoculum size is important factor as too small inoculum size leads to dilute cell suspension as well as too large inoculum size leads to increased competition for growth and also increase in shear force level. Four different inoculum sizes (1.5%, 2.5%, 5% and 7%) were used in the B5 media and the effect of inoculum size on the cell growth and capsaicin production were studied. The overall maximum biomass, maximum metabolite production, % increase in biomass were calculated for each inoculum size and results were compared. Design of Statistical Experiments RSM is a collection of statistical techniques for designing experiments, building models, evaluating the effects of factors and searching for the optimum conditions, and has successfully been used in the optimization of bioprocesses (Kalil et al., 2000). RSM is used to determine the optimum nutrient concentrations, for the production of capsaicin. A central composite rotatable experimental design (CCRD) for three independent variables was used. In the current study experiments were designed to find the interaction of three variables Calcium Chloride, Potassium nitrate and Ammonium nitrate (nitrogen source) and sodium di-hydrogen phosphate (phosphate source). These nutrients were selected with the main objective of increasing the capsaicin yield. The relationship of the independent variables and the response (capsaicin yield) was calculated by the second order polynomial equation. The Design Expert (Version 6.0.10, Stat-Ease Inc., Minneapolis, USA) software package was used to estimate the response of dependent variables and optimized conditions. Callus maintained on solid B5 media supplemented with 2, 4–D (2 mg l–1 and kinetin (0.1 mg l–1) was aseptically transferred to liquid B5 media with same combination of phyto-hormones but different media component combinations. After two weeks the fully grown cells were transferred from the B5 media (growth media) to the MS media (production media). The cells were harvested for the capsaicin extraction after 15 days.
International Journal of Biotechnology Research • January-June 2011 • Volume 4 • Issue 1
Application of Response Surface Methodology for Production of Capsaicin from Capsicum Annum L / 13
Growth kinetics profile: Fully grown callus on solid B5 media was aseptically transferred to liquid B5 media. B5 was selected as it gave high callus growth. Nine flasks were inoculated with an inoculum size of 1g Fresh weight (FW) in 40 ml media. The FW, DW, capsaicin content and sugar consumption were estimated after every 3 days till day 27. The mean growth rate (µ) was calculated over the period of increasing dry weight using linear regression analysis of a log linear plot. Doubling time (td) was calculated using the formula td = 0.693/µ.
upto 30days and estimated for the changes in the phosphate concentration as follows. The cell suspension culture was filtered through Whatman filter No. 1 to obtain a clear filtrate. The filtrate was diluted 100 times. To 1ml of the filtrate 3 ml of distilled water and 4 ml of Phosphate reagent (1 part 6 N Sulphuric acid (H2 SO4) + 2 parts of distilled water + 1 part of 2.5 % w/v ammonium molybdate + 1 part of 10% ascorbic acid) was added and incubated at 37°C for a period of 2h. The color formed as a result of the phosphomolybdate complex was estimated at 820 nm using Hitachi UV/Vis Spectrophotometer.
Analytical Procedures
Estimation of nitrate: Nitrate content of the cell suspension culture was estimated using Brucine sulphate (BS) method (Jenkins and Medsken, 1964). Samples from the cell suspension culture were diluted 100 times as the initial nitrate content was above 2000 mg/L and the range of the standard graph was between 0-50 mg/L. 2 ml Samp le + 1 ml BS reagent (50 ml D/W + 3 ml HCl heat this solution just to boiling and added 1g brucine sulphate and 0.1 g sulphanilic acid with stirring cooled and diluted to 100ml) + 10 ml H2SO4. Shake for 5 min + Cover with petri plates and keep in dark for 10 min + add 10 ml D/W + mix it and keep in dark for 30 min (cover with plates). The yellow colored complex formed was read at 420 nm using Hitachi UV/Vis spectrophotometer.
Estimation of biomass: The fresh weight of cell aggregates was determined by filtering the aggregates through pre-weighed filter paper under a vacuum, washing with distilled water. The dry weight of cell aggregates were also determined the same as above only drying the filter paper and the aggregates at 60°C for one hour. Estimation of sucrose: Total sugar content of the cell suspension culture was estimated using Dinitro Salicylic acid (DNSA) method as developed by Miller (1959). 10 ml of the suspension medium was taken and diluted with water to 50 ml this was then subjected to hydrolysis using 6ml of 6.34N Hydrochloric acid (HCl) at 60oC for 45 min. The solution was cooled and then neutralized using 40% Sodium Hydroxide (NaOH). The volume was then made upto 100ml. 1ml of this neutralized solution was taken in a test tube to which 1ml of DNSA reagent was added (1.6g NaOH + 1g DNSA + 30 g sodium potassium tartarate in 100ml water). The tubes were then placed in a boiling water bath for 10 min. after which they were cooled and 10 ml Distilled water (D/W) was added to make up the volume to 12ml. The red colored complex formed by the reaction of nitro group of DNSA with reducing sugars was read at 540 nm using Hitachi UV/V is spectrophotometer. The reducing sugars of the suspension culture were determined by DNSA, a method developed by Miller. The difference in the values of total sugars and reducing sugars of the same sample accounted for the amount of sucrose (Panda et al., 1990). The difference in the values of total sugars and reducing sugars of the same sample accounted for the amount of sucrose. Estimation of phosphate: Phosphate content of the cell suspension medium was estimated using ascorbic acid method (Mahadevaiah et.al., 2007). Samples from the cell suspension cultures were withdrawn after every 5 days
Estimation of capsaicin: Capsaicin was estimated spectrophotometrically using Hitachi UV/V isspectrophotom -eter. Standard graph of capsaicin was plotted for concentration varying from 1 to 10µg/ml. Capsaicin extracted with dry acetone gave maximum absorbance at 650 nm (Sadasivam and Manickam, 1992). Concentration of capsaicin was estimated using standard graph. 2. RESULTS AND DISCUSSION
The age of the seedling is one of the important factors for callus induction and profileration. Hence twenty one day old seedlings showed maximum callus growth (0.843 g ± 0.048) and capsaicin content (9.431µg/g ± 0.14). The Hypocotyledons, the media B5 2 mg l–1 (2, 4–D) + 0.1 mg l–1 (K) gave the maximum cell mass whereas MS 1.5 mg l–1 (2, 4 – D) + 0.5 mg l–1 (K) gave the maximum production of capsaicin. The growth pattern and capsaicin production for four inoculum size 15 g l–1, 25 g l–1, 50 g l–1 and 75 g l–1 is as shown in Table 1. In all the four cases, inoculum size of 2.5% showed maximum fresh cell weight and capsaicin production.
Table I Profile of Growth and Capsaicin Production for Different Inoculums Inoculum (gm/l)
Max. cell FCW (g/L)
% increase in FCW
Max. Capsaicin content (mg/l)
capsaicin content of cells (µg/ gm FCW)
15 25 50 75
20.89 53.67 65.72 80.84
39.27 114.68 31.44 7.78
0.24 1.31 1.07 1.20
11.67 24.42 16.28 14.87
International Journal of Biotechnology Research • January-June 2011 • Volume 4 • Issue 1
14 / L. A. Sagwan, S. A. Survase and U. S. Annapure
In the present study, a central composite rotatable design which consists of 20 trials, including a six centre point replicates was used to develop a second order polynomial model. Second order polynomial equation was used to correlate the independent process variables, Xi, with capsaicin yield. The second order polynomial coefficient for each term of the equation determined
through multiple regression analysis using the Design Expert. Table 2 represents the coded and the non coded values of the experimental variables. Design of the table along with capsaicin yield is given in Table 3. The experiments were carried out at in duplicates, which are necessary to estimate the variability of measurements. The yields are reported as mean of the duplicates.
Table II Central Composite Rotatable Design (CCRD) Matrix of Independent Variables and their Corresponding Experimental and Predicted Values of Capsaicin Media Componentsa Run
a
Calcium chloride
Nitrogen
Phosphorus
(mM)
(mM)
(mM)
Experimental
Predicted
1
3 (-1)
30 (-1)
0.75 (-1)
21.45
21.35
2
9 (1)
30 (-1)
0.75 (-1)
36.97
35.6
3
3 (-1)
90 (1)
0.75 (-1)
22.45
24.16
4
9 (1)
90 (1)
0.75 (-1)
30.23
27.81
5
3 (-1)
30 (-1)
1.75 (1)
25.43
21.87
6
9 (1)
30 (-1)
1.75 (1)
30.23
29.84
7
3 (-1)
90 (1)
25.43
25.43
23.53
8
9 (1)
90 (1)
21.64
21.64
21.10
9
0.96 (-1.68)
60 (0)
19.71
19.71
18.76
10
11.04 (1.68)
60 (0)
28.78
28.78
33.45
11
6 (0)
9.6 (-1.68)
31.38
31.38
30.20
12
6 (0)
110.4 (1.68)
26.24
26.24
25.22
13
6 (0)
60 (0)
31.54
31.54
29.40
14
6 (0)
60 (0)
22.46
22.46
24.20
15
6 (0)
60 (0)
33.54
33.54
32.97
16
6 (0)
60 (0)
32.23
32.23
32.97
17
6 (0)
60 (0)
30.32
30.32
32.97
18
6 (0)
60 (0)
32.01
32.01
32.97
19
6 (0)
60 (0)
33.21
33.21
32.97
20
6 (0)
60 (0)
29.48
29.48
32.97
Factora
DFb
F Value
pc
Model A B C A2 B2 C2 AB AC BC
9 1 1 1 1 1 1 1 1 1
20.45 50.19 16.94 17.80 42.48 6.07 16.80 14.62 27.12 0.45
< 0.001* < 0.001* 0.0021 * 0.0018 * < 0.001* 0.0335 * 0.0022 * 0.0034 * 0.0004 * 0.5193
A = Calcium chloride B = Nitrogen C= Phosphate = Degree of freedom c *p < 0.05 are significant, R2 = 0.95 b
(µg g-1 DW)
values in parenthesis are coded values of variables
Table III Analysis of Variance (ANOVA) for the Experimental Results of the Central-Composite Design (Quadratic Model)
a
capsaicin
The Analysis of Variance (ANOVA) summary is shown in Table 4. ANOVA is important in determining the adequacy and significance of the quadratic model. The model F-value of 20.45 implies that the model is significant and that there is only a 0.01% chance that a Model F-value this large could occur due to noise. Values of Model P(Prob > F) less than 0.001 indicate model terms are significant. The P values were used as a tool to check the significance of each of the coefficients, which, in turn, are necessary to understand the pattern of the mutual interactions between the test variables. Based on the above interpretation, A(Calicum chloride), B(Nitrogen), C(Phosphate), A × B (calcium chloride × nitrogen) and A × C(calcium chloride × phosphate) are significant model terms.
International Journal of Biotechnology Research • January-June 2011 • Volume 4 • Issue 1
Application of Response Surface Methodology for Production of Capsaicin from Capsicum Annum L / 15 Table IV Optimized Medium Composition for Capsaicin Production by C.annuum Cell Suspension Media Component Concentration No
Calcium
Nitrogen
Phosphate
chloride (mM)
(mM)
(mM)
= 31.78 + (2.90 × Calcium chloride) - (1.68 × Nitrogen) – (1.72 x Phosphate) – (2.59 × Calcium chloride2) – (0.98 × Nitrogen2) – (1.63 × Phosphate 2) - (2.04 × Calcium chloride × Nitrogen) – (2.79 × Calcium chloride × Phosphate) - (0.36 x Nitrogen x
Capsaicin (µg g-1 DW)
1a
3
60
1.25
29.89 ± 0.11
2b
8.97
35.7
0.76
36.32 ± 0.23
3
8.97
35.7
0.76
37.03
c
Capsaicin µg/g DW
the values before optimization the optimized values derived from RSM regression and capsaicin production in this study. c the predicted optimum values and predicted maximum capsaicin production derived from RSM regression in this study. a
b
The application of response surface method resulted in following empirical relationship between capsaicin yield and media components in real value:
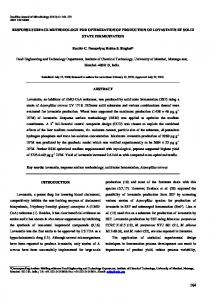
Phosphate) The mathematical model is reliable with an R2 value of 0.95 (the closer the R2 value to 1, the better is the model fit to the experimental date). It suggests that the model was unable to explain only 5% of the total variations. A very low value of coefficient of the variation (C.V.) (5.39) clearly indicates a very high degree of precision and a good deal of reliability of the experimental values (Table 5). This is also evident from the plot of predicted versus experimental in Fig. 1.
Table V Sucrose Consumption, Capsaicin Production, Phosphate and Nitrate Consumption for Optimum Inoculum Size Sucrose (g l-1) 20
Sucrose
Max.
Max.
Phosphate
Phosphate
Nitrate
Nitrate
utilization (%)
DCW (g l-1)
capsaicin (mg l-1)
(g l-1)
utilization (%)
(g l-1)
Utilization (%)
93.4
52.5
1.123
0.15
63.75
2.5
64.65
Figure 1: Predicted Vs Experimental Values of Capsaicin Production International Journal of Biotechnology Research • January-June 2011 • Volume 4 • Issue 1
16 / L. A. Sagwan, S. A. Survase and U. S. Annapure
Figure 2 show the response and contour curves for calcium chloride concentration, Nitrogen concentration and phosphate concentration. The critical analysis of the response surface represents that capsaicin yield is a function of concentrations of two independent variables with another variable being at a fixed level. The response surface plots showed that capsaicin production increased with the increase in calcium chloride concentration (2 fold) and a decrease in phosphate concentration and nitrogen concentration. This can be attributed to the fact that calcium is known to regulate metabolic processes in plants either directly or through the calcium-calmodulin
interaction. Calcium chloride is also known to precipitate phosphate from the medium hence decreasing its concentration and increasing the capsaicin yield. Nitrogen was also found to play an important role in capsaicin production. Lower concentration of nitrogen showed maximum capsaicin yield. Depletion of nutritional factors are known to arrest growth and channel the precursors for secondary metabolite. Hence at lower concentration of nutrients such as nitrogen and phosphate showed a marked increase in secondary metabolite.
Figure 2: Surface Response Plot for Capsaicin Production: (A) Effect of Phosphate and Nitrogen when Other Variables are Held at Zero Level. (B) Effect of Phosphate and Calcium Chloride when Other Variables are Held at Zero Level. (C) Effect of Nitrogen and Calcium Chloride when Other Variables are Held at Zero Level.
International Journal of Biotechnology Research • January-June 2011 • Volume 4 • Issue 1
Application of Response Surface Methodology for Production of Capsaicin from Capsicum Annum L / 17
Using the response surface methodology, increase of capsaicin yield from 29.89µg g–1 to 36.32 µg g–1 was obtained. The optimal concentrations for the three components as obtained from the maximum point of the model were calculated to be as 8.97 mM, 35.7 mM and 0.76 mM for calcium chloride, nitrogen and phosphate, respectively. (Table 6). Studies in Growth Kinetics of Cell Suspension Culture of C.annuum Figure 3 shows the growth profile of C.annuum cells. Maximum cell concentration was 52.5 g l–1 FCW which corresponds to 17 g l –1 DW. The production of the capsaicin was observed and the production reached maximum on day 18 (stationary phase) (21.54 ± 0.24 µg g–1 DCW). It then showed a drastic decline in production (death phase). Rate of consumption of all the essential nutrients (nitrate, sucrose and phosphate) is also shown Figure 4. During the exponential phase, it can be seen that peak biomass dry weight (17.00 g l–1) shows a low
concentration of sucrose 1.32 g l–1, phosphate 0.054 g l–1, nitrate 0.88 g l–1 also it is seen that the capsaicin production was found to increase gradually with utilization of nutrients in the medium. Sucrose was found to be the most limiting of the nutrients monitored as 93.4 % of the sucrose was utilized in a period of 18 days by the cells as the concentration of sucrose reduced from 19.56 g l–1 to 1.32 g l–1. Concentration of sucrose above 2% has been found to enhance the yield of secondary metabolites by not only stimulating growth but also increasing the rate of product synthesis (Merillon et al., 1984; Zenk et al., 1975). Table 7 shows amount of sucrose, nitrate and phosphate consumed for maximum capsaicin production and growth of cells. As seen in Figure 4 the dry weight of the cells increased from 2.25 g l–1 to 17.00 g l–1 in eighteen days. The specific growth rate using dry weight was 0.289 day–1 which was in close correspondence to previous reports (Mavituna and Park, 1987). The doubling time using dry weight was found to be 2.39 days.
Figure 3: Profile of Growth, Capsaicin Production Consumption by Cell Suspension Culture of C.annuum Cell
Figure 4: Profile of Growth, Nutrient Consumption by Cell Suspension Culture of C.annuum Cells International Journal of Biotechnology Research • January-June 2011 • Volume 4 • Issue 1
18 / L. A. Sagwan, S. A. Survase and U. S. Annapure 3. CONCLUSION
It was possible to optimize the major nutrients of media for suspension culture using a statistical experimental design (Response Surface Methodology). The optimized media yielded almost one fold increase in capsaicin content (36.32 µg g-1) when compared to the media before optimization. Growth kinetic studies helped in evaluating the kinetic parameters like specific growth rate, doubling time that are essential for further process development. The optimum Inoculum size was found to be 25 g FW L-1. REFERENCES [1]
Adinarayana, K., Ellaiah, P., Srinivasulu, B., Bhavani, R. And Devi Adinarayana, G. (2003), “Response Surface Methodological Approach to Optimize the Nutritional Parameters for Neomycin Production by Streptomyces marinesis under Solid-state Fermentation”, Process Biochemistry, 38, 1565-1572.
[2]
Box, G. E. P. And Hunter, W. G. (1978), “In: Statistics for Experimenters, John Wiley and Sons”, New York, 54-67.
[3]
Box, G. E. P. and Wilson, K. B. (1951), “On the Experimental Attainment of Optimum Conditions”, Journal of Royal Statistics Society B, 13, 145-149.
[4]
Cooucci, M. And Negrini, N. (1991), “CalciumCalmodulin in Germination of Phacelia tanacetifolia Seeds: Effects of Light, Temperature, Fusicoccin and CalciumCalmodulin Antagonists”, Physiologia Plantarum, 82, 143149.
Glucan Synthase from Soybean Cells”, FEBS Letters, 158, 84-88. [12] Knobloch, K.h., Beutnagel, G. And Berlin, J. (1981), “Influence of Accumulated Phosphate on Culture Growth and Formation of Cinnamoyl Putrescines in MediumInduced Cell Suspension Cultures of Nicotiana tabacum”, Planta, 153, 582-585. [13] Kosuge, S. And Furata, M. (1970), “Studies on the Pungent Principle of Capsicum, Part XIV: Chemical Constitution of the Pungent Principle”, Agricultural Biological Chemistry, 34, 248-256. [14] Mahadevajah, Y. K., Mansour, M. S., Abdul Galil, M. S., Suresha, M. A. And Nagendrappa, G. (2007), “A Simple Spectrophotometric Determination of Phosphate in Sugarcane Juices, Water and Detergent Samples”, Journal of Chemistry, 4, 467-473. [15] Mavituna, F., And Park, P. M. (1987), “Size Distribution of Plant Cell Aggregates in Batch Culture”, The Chemical Engineering Journal. 35, 9-14. [16] Merillon, J. M. (1999), “Large Scale Production in Bioreactors, In: Biotechnology, secondary metabolites”, (Ramawat, K.G. and Merillon, J.M.), Oxford and IBH Publishers, New Delhi, 331-337. [17] Merillon, J. M., Rideau, M. And Chenieux, J. C. (1984), “Influence of Sucrose on the Levels of Ajmalicine”, Serpentine and Tryptamine in Catharanthus roseus cells in vitro. Planta Med. 50, 561 -567. [18] Miller, G. L. (1959), “Use of Dinitrosalicylic Acid Reagent for Determination of Reducing Sugar”, Analytical Chemistry, 31, 426-428.
[5]
Dougall, D.k. And Weyrauch, K.w. (1980), “Growth and Anthocyanin Production by Carrot Suspension Cultures Grown under Chemostat Conditions with Phosphate as the Limiting Nutrient”, Biotechnology and Bioengineering, 22, 337-352.
[6]
Elibol, M. (2004), “Optimization of Medium Composition for Actinorhodin Production by Streptomyces coelicolor A3(2) with Response Surface Methodology”, Process Biochemistry, 39, 1057-1062.
[7]
Haaland, P.d., (1989), “In: Experimental Design in Biotechnology”, Dekker, New York. 45-61.
[21] Pollard, T. D. (1984), “Polymerization of Adp-actin, Journal of Cell Biological”, 99, 769-777.
[8]
Hepler, P. K. And Wayne, R. O. (1985), “Calcium and Plant Development”, Annual Review of Plant Physiology, 36, 397-439.
[22] Sadasivam, S. And Manickam, A. (1992), “Biochemical Methods for Agricultural Sciences, Wiley Eastern, Ltd, Madras, 246pp.
[9]
Jenkins, D. And Medsken, L., (1964), “A Brucine Method for the Determination of Nitrate in Ocean, Estuarine, and Fresh Waters”, Analytical Chemistry, 36, 610-612.
[23] Tsapatsaris, S., And Kotzekidou, P. (2004), “Application of Central Composite Design and Response Surface Methodology to the fermentation of Olive Juice by Lactobacillus plantarum and Debaryomyces hansenii”, International Journal of Food Microbiology, 95, 157–168.
[10] Kalil, S. J., Maugeri, F. And Rodrigues, M. I. (2000), “Response Surface Analysis and Simulation as a Tool for Bioprocess Design and Optimization”, Process Biochemistry, 35, 539–550. [11] Kauss, H., Koehle, H. And Jebelick, W. (1983), “Proteolytic Activation and Stimulation by Calcium of
[19] Mythili, J .b. And Thomas, P. (1999), “Influence of Ammonium to Nitrate Nitrogen Ratio in Different Basal Media on Callusing Response of (Capsicum annuum L., grossum Sendt.) anthers”, Indian Journal of Experimental Biology, 37, 314-316. [20] Panda, A. K., Bisaria, V. S, Mishra, S. And Bhojwani, S. S. (1990), “Cell Culture of Holarrhena antidysenterica: Growth and Alkaloid Production”, Phytochemistry, 30, 833-836.
[24] Zenk, M.s., Ei-shaggy, H., And Schutte, U. (1975), “Anthraquinone Production by Cell Suspension Culture of Morinda citrofolia”, Plant Medicine Supplement, 30, 79101.
International Journal of Biotechnology Research • January-June 2011 • Volume 4 • Issue 1