Brzeg and OÅawa. This is a new flap weir, whose construction began in 1991, and the structure was put into use in June 2003. The measurement data employed ...
Studia Geotechnica et Mechanica, Vol. XXXII, No. 1, 2010
APPLICATION OF SELECTED ROBUST ESTIMATION METHODS FOR CALCULATING VERTICAL DISPLACEMENTS OF HYDROTECHNICAL STRUCTURES ZBIGNIEW MUSZYŃSKI Institute of Geotechnics and Hydrotechnics, Wrocław University of Technology. Abstract: The subject of this paper concerns, in general, geodetic surveys of vertical displacements in hydro-engineering. Special attention has been paid to the issue of the correct assessment of settlement, which, in turn, depends on the proper identification of fixed reference benchmarks. In classical methods sometimes it is very difficult to identify which reference marks are fixed. The paper presents the possibility of applying robust estimation methods (on the example of Huber’s method and the linear method) for the purpose of fixed benchmark detection. Displacement values obtained in this way are more reliable and resistant to the influence of incorrect reference mark identification. The problem is illustrated by means of calculations of vertical displacements of the Lipki weir.
1. INTRODUCTION Proper and safe use of many engineering structures requires carrying out periodical control of technical condition of those structures. This, in the first place, refers to dams, weirs and other hydrotechnical structures. One of the objectives of the aforementioned control is the assessment of the structure’s geometrical properties by means of the so-called geodetic determination of displacement. That issue was discussed at length in numerous publications, e.g. [1], [5], [10]. The considerations included in this article are limited to the determination of vertical displacements of a hydrotechnical structure. On the basis of the archival geodetic measurements it will be checked if selected robust estimation methods are suitable for the purpose of identifying fixed reference benchmarks in situations where traditional identification methods do not give clear-cut results. 2. METHODS OF DETERMINING VERTICAL DISPLACEMENTS Detailed nomenclature referring to geodetic measurements of displacement may be found in the code of practice [9] and book [10]. By way of a more insightful introduction, some basic definitions given in the above mentioned sources will be recalled. A displacement of a structure is the change of its position in relation to the accepted system of reference, occurring in a particular time interval. The parameters of the displacement are the values describing the change of the structure’s position: the values of shift along each of the axes of the coordinate system, as well as the angles of
70
Z. MUSZYŃSKI
rotation, subsequently about each of the system’s axes. In the real world environment, the coordinate system is represented by the points of reference (reference marks) located outside the zone of impact of the structure under survey, in places that ensure the stability of mutual position of the points. The engineering structure under analysis is denoted by a certain number of check points. Those are either the aforementioned reference marks fastened to the structure under survey, or some characteristic elements of the structure that are easy to identify, the displacements of which are to be determined. Knowing the displacement of separate points, it is possible to model the displacement of the whole structure. The planned monitoring of vertical displacement begins at the stage of the construction works. The marked points of reference and the benchmarks under control constitute a control-measurement network, which is cyclically measured by means of precise geometric levelling. The first levelling survey of the network is called initial measurement and it constitutes the point of reference for subsequent measurements, denoted as periodic measurements. The last of the periodic measurements is called the current measurement. The material obtained in the course of measurements is subject to control in the following ways: a) elevation difference at each station is measured twice and the difference obtained cannot exceed the admissible value; b) each levelling traverse connecting two benchmarks is measured twice: in forward and backward directions, and the difference obtained cannot exceed the admissible value; c) if the particular levelling circuits form together a closed figure – the so-called closed traverses, their closing deviations (misclosures) are checked and compared with the admissible value. The measurement results check makes it possible to remove potential gross errors. In addition, the influence of systematic errors is eliminated by means of a proper measuring technology, and also because appropriate corrections are made. The analysis of the results before the adjustment ends in the calculation of the standard error of the typical observation in the whole network. As far as vertical displacement is concerned, the typical observation is assumed to be the mean difference of elevation (from the foresight and backsight measurement) measured at a singular level station [5]. The data from the initial measurement, after their check gives positive results, are subject to adjustment by means of the least squares method (LS) accompanied by the analysis of accuracy of the results obtained. As far as the periodic survey is concerned, after the field test material is approved, the process of identification of fixed points of reference begins. This consists in detecting reference points that were subject to displacement, and their removal from the reference point set. Afterwards, the measurement results are adjusted by means of the least squares method with the tie-in to the identified fixed points, taking into account standard errors of their location obtained in the initial measurement. The point of reference that is mistaken for a fixed one, in the process of adjustment using the least squares method, will cause the deformation of the whole elevation dif-
Application of selected robust estimation methods
71
ference network. As a result, we will obtain erroneous values of the displacement of the check points on the structure. The correct detection of fixed reference points is, therefore, considered crucial for the whole process of displacement determination. In order to identify the fixed reference benchmarks, criterion (1) is most frequently used, as described, among others, in works [1], [5]:
(Δh′ − Δh) max ≤ 1.5 ⋅ μ 0′′ ⋅ n + n′ ,
(1)
where: Δh – the difference in height between the reference benchmarks from the initial survey ( Δh′ – from the current survey), n – the number of stations of the surveyor’s level in the traverse that connects reference benchmarks from the initial survey ( n′ – from the current survey), μ0′′ – standard error of the typical observation before the adjustment, calculated by means of formula (2) [1]:
μ0′′ = ±
( μ0 ) 2 + ( μ0′ ) 2 , 2
(2)
where μ0 – standard error of the typical observation before the adjustment from the initial survey ( μ0′ – from the current measurement). For any pair of reference benchmarks under investigation, the difference in elevation differences (from the initial and the current measurement) should not exceed the admissible value. If this condition is met, the benchmark pair may be considered mutually fixed. The aforesaid criterion may be applied in two variants [5]: a) without the preliminary adjustment of the elevation network – using “raw” survey results (the average calculated from the elevation measured in the forward and backward direction) for each traverse; b) on the basis of the elevation difference values obtained from the preliminary adjustment of the levelling network in the tie-in to one benchmark, situated approximately in the middle of the network. When considering all possible links between the reference benchmarks (selecting those traverses that possess a lesser number of stations) it is possible to detect a group of points that are mutually fixed. In practice, it happens that the results of such identification are inconclusive and it is difficult to decide which points have preserved their fixed position. 3. ROBUST ESTIMATION METHODS Robust estimation is one of the branches of mathematical statistics. Specialist literature includes the description of a considerable amount of various robust methods, applied in different fields of science. In the context of geodetic adjustment calculus,
72
Z. MUSZYŃSKI
the core of robust method consists in iterative modification (reduction) of the weight of those observations that were considered as outliers. An outlier is the observation for which the calculated correction value exceeds the admissible value. Eventually, outliers have a lesser influence on the solution obtained. Below, there is a short description of two robust methods employed in this work. Detailed characteristics of those methods, against the background of the robust methods classification presented in statistic and geodetic specialist sources, may be found in work [7]. 3.1. HUBER’S METHOD
This method was proposed by Huber in [3] and recounted in article [4]. It is a fusion of the least squares method and the least standard deviation method. For the i-th observation, the iterative modification of weights proceeds in accordance with the following formula: for | vi | ≤ f , ⎧ pi ) ⎪ pi = ⎨ f ⎪ pi | v | for | vi | > f , i ⎩
(3)
where: p – primary weight of the i-th observation; ) p – modified weight; v – the correction of the observation calculated from the previous iteration; f – tuning parameter, which defines the interval of the admissible correction values v. 3.2. LINEAR METHOD
Linear method was described in course book [8]. Unlike with the method mentioned earlier, the modifications that are carried out do not refer to the weight of the observations in a direct manner, but indirectly, i.e. by means of the a priori alteration of standard error values for particular observations. Boundary value of the corrections (the value after the exceeding of which the errors are modified in accordance with formula (4)) is the coupled value of standard error for a given observation. For a correction that exceeds the boundary value, the standard error is increased by the value equal to how much that correction exceeded the admissible interval.
) ⎧m mi = ⎨ i ⎩mi + | vi | −2 ⋅ mi
for | vi | ≤ 2 ⋅ mi , for | vi | > 2 ⋅ mi ,
(4)
Application of selected robust estimation methods
73
where: mi – standard error of the a priori measurement for the i-th observation; ) mi – modified value of standard error of the i-th observation. 3.3. FITTING THE NETWORK INTO CONGRUENT TIE-IN POINTS
In the process of the levelling network adjustment by means of the least squares method taking into account tie-in points, one has to formulate two kinds of observation equations. The first type of equations includes the adjustment corrections of the measured elevation differences. The second type treats the height of the tie-in points as if they emerged from the measurement and the corrections of the height of these points are calculated [8]. The results of the adjustment are assessed by checking the following parameters: a) standard error of a typical observation after the adjustment m0, which is a root of the variance coefficient estimator (5). This parameter makes it possible to formulate general conclusions referring to the standard errors, assumed a priori, of the measured values, from which, subsequently, the original weights are calculated. For correctly assumed weights: m0 ≈ 1 m0 =
vT ⋅ P ⋅ v , n−k
(5)
where: v – the matrix of the calculated corrections of the observations, P – matrix of weights, n – the number of observation equations, k – the amount of the unknowns being calculated; b) if conditions (6) and (7) are met for each observation: | vi | ≤ 3, mvi
(6)
| vi | ≤ 3, mi*
(7)
where: mv – standard error of the i-th correction calculated in the course of the adjustment, m* – standard error of the adjusted i-th observation: for the observation equations of the first type this is the standard error of the adjusted elevation difference m* = mΔh , for the equations of the second type – the standard error of the adjusted height of point m* = mh .
74
Z. MUSZYŃSKI
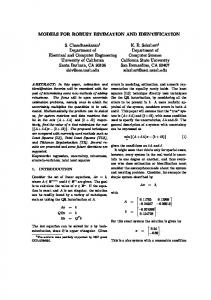
If the reference points were subject to displacement, it would be possible to carry out an iterative adjustment of the network and simultaneously to fit it into the congruent reference points, modifying (increasing) the errors of the divergent reference points. Such a solution was suggested in book [8], using the linear method for that purpose. In this work, aside from the linear method, also Huber’s method was used. The initial errors for observation equations of the second type were assumed on the basis of the initial measurement of the covariance matrix of the adjusted reference points’ heights. In both robust methods, in the course of the adjustment, the elements on the main diagonal of the aforementioned matrix (variances) were modified, whereas the covariance values were modified on the basis of the constant correlation coefficients. 4. OBJECT OF RESEARCH In the research use was made of the archival results of geodetic survey of vertical displacement of the Lipki weir, included in report [2], whereas all the computations were carried out in the calculation spreadsheet in the Mathcad environment [6]. The Lipki weir is located on the Odra river at 206 + 900 km, between the towns of Brzeg and Oława. This is a new flap weir, whose construction began in 1991, and the structure was put into use in June 2003. The measurement data employed refer to the first stage of the construction works (the construction of the weir’s right abutment and the right pillar) and they entail the initial measurement and three periodic measurements (table 1). The object of investigation was the displacement of nine benchmarks under control (benchmarks for subsidence measurement) in relation to temporary reference benchmarks: wall benchmarks nos. 21, 22, 23 and 24, and on-ground benchmark no. 25, located on the right bank of the river (figure 1).
Fig. 1. Sketch of control-measurement network
Application of selected robust estimation methods
75 Table 1
Geodetic survey results
6-25 25-24 24-23 23-22 22-21 21-20 20-4 4-6 4-3 3-5 5-6 3-7 7-9 9-5 7-8 8-10 10-9 Parameter:
–2950.94 3 2109.60 12 –562.02 3 –1305.01 7 –1611.94 2 2695.55 4 1628.40 1 –3.04 1 1.29 1 –10.70 1 6.38 1 –9.91 1 10.96 1 –11.65 1 0.82 1 12.35 1 –2.21 1 μ 0 = ±0.06 mm
–2952.17 3 2109.70 12 –562.26 3 –1305.38 7 –1612.56 2 2696.38 4 1628.40 1 –2.20 1 1.81 1 –10.28 1 6.26 1 –10.06 1 11.34 1 –11.68 1 0.25 1 12.75 1 –1.66 1 ′ μ 0 = ±0.03 mm
∆h' [mm]
–2950.74 3 2109.72 12 –562.36 3 –1304.53 7 –1611.68 2 2694.84 4 1628.15 1 –2.91 1 0.70 1 –10.32 1 6.71 1 –9.10 1 11.00 1 –12.18 1 0.30 1 12.59 1 –1.89 1 ′ μ 0 = ±0.04 mm
3rd periodic 05.10.1998
∆h' [mm]
the number of stations
∆h' [mm]
2nd periodic 06.11.1997 the number of stations
∆h [mm]
1st periodic 09.05.1997 the number of stations
initial 11.10.1996 the number of stations
From benchmark to benchmark
Measurement Data
–2949.92 3 2110.79 13 –562.91 3 –1303.83 9 –1612.35 2 2692.80 4 1628.35 1 –2.55 1 0.51 1 –10.10 1 7.04 1 –9.00 1 10.62 1 –11.61 1 –0.50 1 12.48 1 –1.36 1 ′ μ 0 = ±0.02 mm
The adjustment of the initial measurement was carried out on the basis of the known height of benchmark no. 24, assumed as the flawless one. The control of the field test material for each of the three periodic measurements turned out positive, which is also confirmed by small values of errors μ0 and μ0′ . Some difficulties occurred while the fixed reference points were identified according to criterion (1). Using raw data (figure 2), unequivocal results were obtained. For the 1st periodic measurement, the fixity of the position was detected for the following benchmark pairs: 25-22, 25-23, 25-24, using traverses with a large number of stations. At the same time, for considerably shorter traverses, the lack of fixity was observed between the points nos. 22-23 and 23-24, which undermines those points’ fixity. A similar situation was observed for the 3rd periodic measurement. In the case of the long traverses, the fixity was detected between the benchmarks nos. 24-21 and 24-22, but the much shorter traverse of 21-22 displays lack of fixity. For the pur-
Z. MUSZYŃSKI
76
pose of comparison, the fixed reference benchmarks were identified by means of an alternative method (figure 2), using the preliminary adjustment of the elevation differences (in tie-in to benchmark no. 4). The results of the adjustment confirmed the coherence of the field test materials. Identification of fixed points of reference: after the newtork was adjusted
3rd periodic measurement
2nd periodic measurement
1st periodic measurement
without initial network adjustment
Fig. 2. Identification of fixed points of reference (solid line – mutual fixity, broken line – significant alteration of the elevation difference values)
The second variant of identification rejected benchmark no. 21 for the 1st periodic measurement and benchmarks 22, 23, 25 for the 3rd periodic measurement. For the 2nd periodic measurement, both identification variants provided the same solution: benchmarks 22, 24, 25 were detected as fixed pointing, simultaneously, to the fixity of
Application of selected robust estimation methods
77
benchmark pair 25-23 (for a long traverse), which was not confirmed by short traverses 22-23 and 23-24. The identification of fixed tie-in benchmarks by means of both robust estimation methods was carried out on the assumption that the admissible interval of correction of the tie-in points’ height was selected as some multiplicity of the standard error of the point’s height from the initial measurement. This multiplicity was supposed to ensure that the obtained m0 is closest to one, and for the subsequent periodic measurements in Huber’s method it amounted to 0.5 (5 iterations until convergence were obtained), 0.6 (4 iterations) and 0.15 (11 iterations), whereas in the linear method: 3.0 (5 iterations), 1.3 (5 iterations) and 1.1 (14 iterations). Table 2
III periodic
II periodic
I periodic
Measurement
Test results for robust estimation methods Test result | vi | mvi from method:
Benchmark no.
21 22 23 24 25 21 22 23 24 25 21 22 23 24 25
Test results | vi | mhi from method:
LS
Huber’s
linear
LS
Huber’s
linear
– 1.5 0.4 1.1 1.3 – 1.1 – 0.1 1.0 0.2 – – 0.2 –
1.7 1.1 1.1 0.5 1.1 1.7 1.4 0.2 1.2 1.0 1.1 1.3 0.9 1.1 0.4
1.7 1.8 0.8 0.8 1.5 1.1 1.3 0.4 1.5 0.8 1.0 1.0 1.2 1.0 0.3
– 1.8 0.2 1.6 1.5 – 0.8 – 0.1 0.8 0.2 – – 0.2 –
7.1 2.7 1.0 0.6 2.3 5.0 3.5 0.1 2.9 1.2 5.6 7.4 1.9 5.9 0.3
9.1 3.0 0.7 1.5 2.3 5.2 3.4 0.3 2.7 0.9 7.4 9.7 2.4 7.7 0.2
The calculations were paused when the alteration of the adjusted benchmarks’ height was smaller than 0.01 mm. For the purpose of better fitting of the network, benchmark 24 was rejected as flawed, assuming standard error for this point on the level of neighbouring benchmarks. The obtained calculation results met condition (6) for all the observation equations (table 2), as well as condition (7) for the observation equations of the first type. If condition (7) is not met for any of the tie-in benchmarks, it means that the benchmark was displaced. After the adjustment of the 1st periodic
Z. MUSZYŃSKI
78
measurement, both robust methods clearly rejected benchmark 21 (which corresponds with the results of the traditional identification) and pointed to benchmark no. 22 as considerably displaced. For the 2nd periodic measurement, benchmarks 23 and 25 proved to be most stable, while benchmark 22 was detected as displaced (which has not been revealed by traditional identification methods). Benchmark 24 was on the limit of the position fixity criterion. For the 3rd periodic measurement, robust methods detected again benchmark pair 23-25 as fixed (table 2). The remaining points were subject to an obvious displacement. The detected points are one of the three pairs of benchmarks which were qualified as fixed on the basis of “raw” observations in the traditional approach. At the same time, the classical identification of fixity on the basis of preliminarily adjusted elevation differences pointed to the fixity of a completely different benchmark pair: 21-24. It is worth remembering that benchmark 21 in the previous two periodic measurements was detected as displaced by each of the identification methods tested. In the end, all the periodic measurements were adjusted by means of the least squares method in the tie-in to the fixed reference benchmarks identified by means of classical methods. The displacements of all the benchmarks of the control-measurement network, calculated in this way, were compared with the displacements obtained from both methods of robust estimation (figures 3, 4, 5). The charts show additionally – for each displacement – the interval of the double value of standard error for that displacement identification. For the 1st periodic measurement, the calculated displacements are almost identical. For two remaining periodic measurements it is clearly visible that the values of displacement altered depending on the assumed group of fixed points of reference. Both methods of robust estimation provided mutually similar results, visibly decreasing the displacement of the benchmarks under control (especially in the 3rd periodic measurement).
Displacements [mm]
1,5 1,0 0,5 0,0 -0,5 -1,0
LS
Huber's
linear
-1,5 3
4
5
6
7
8
9 10 20 Benchmark no.
21
22
23
Fig. 3. Vertical displacements of benchmarks – 1st periodic measurement
24
25
Application of selected robust estimation methods
79
Displacements [mm]
1,5 LS
1,0
Huber's
linear
0,5 0,0 -0,5 -1,0 -1,5 3
4
5
6
7
8
9 10 20 Benchmark no.
21
22
23
24
25
24
25
Fig. 4. Vertical displacements of benchmarks – 2nd periodic measurement
3,0 LS
Displacements [mm]
2,0
Huber's
linear
1,0 0,0 -1,0 -2,0 -3,0 -4,0 -5,0 3
4
5
6
7
8
9 10 20 Benchmark no.
21
22
23
Fig. 5. Vertical displacements of benchmarks – 3rd periodic measurement
5. SUMMARY Proper identification of fixed reference benchmarks is of great significance for the correct detection of displacement of the structure under control. The widely used classical methods of identification are not meant to be downgraded here, but it has to be clearly stated that in certain situations those methods give ambiguous results. In such a case, robust estimation methods may be applied, which are very efficient at detecting displaced reference benchmarks. Iterative adjustment makes it possible to fit the network of congruent reference points within the limits of their standard errors without deforming the good-quality results of geodetic levelling. In effect, it is possible to obtain more credible values of displacement of the benchmarks under control.
80
Z. MUSZYŃSKI REFERENCES
[1] BRYŚ H., PRZEWŁOCKI S., Geodezyjne metody pomiarów przemieszczeń budowli, PWN, Warszawa, 1998. [2] CISEK A., KLIMOWICZ H., WINTER J., Badanie przemieszczeń jazu Lipki w budowie, Raporty Instytutu Geotechniki i Hydrotechniki PWr, seria SPR nr 933, Wrocław, 1998. [3] HUBER P.J., Robust Estimation of a Location Parameter, The Annals of Mathematical Statistics, 1964, Vol. 35, No. 1, 73–101. [4] HUBER P.J., The 1972 Wald Lecture Robust Statistics: A Review, The Annals of Mathematical Statistics, 1972, Vol. 43, No. 4, 1041–1067. [5] LAZZARINI T. et al., Geodezyjne pomiary przemieszczeń budowli i ich otoczenia, PPWK, Warszawa, 1977. [6] Mathcad 2001i Professional® firmy MathSoft Engineering & Education, Inc. [7] MUSZYŃSKI Z., Zastosowanie metod estymacji odpornej do identyfikacji obiektów budowlanych na podstawie pomiarów geodezyjnych, Rozprawa doktorska, Politechnika Wrocławska, Wrocław, 2007. [8] OSADA E., Geodezja. Podręcznik elektroniczny w Mathcadzie 2001i, Oficyna Wyd. PWr, Wrocław, 2002. [9] PN-N-02211:2000. Geodezja. Geodezyjne wyznaczanie przemieszczeń. Terminologia podstawowa. [10] PRÓSZYŃSKI W., KWAŚNIAK M., Podstawy geodezyjnego wyznaczania przemieszczeń. Pojęcia i elementy metodyki, Oficyna Wyd. PW, Warszawa, 2006.