Physicochem. Probl. Miner. Process. 50(1), 2014, 249−264
Physicochemical Problems of Mineral Processing
www.minproc.pwr.wroc.pl/journal/
ISSN 1643-1049 (print) ISSN 2084-4735 (online)
Received August 16, 2013; reviewed, accepted September 3, 2013
APPLICATION OF STATISTICAL PROCESS CONTROL FOR PROPER PROCESSING OF THE FORE-SUDETIC MONOCLINE COPPER ORE Adem TASDEMIR*, Przemyslaw B. KOWALCZUK** *
**
Department of Mining Engineering, Division of Mineral Processing, Eskisehir Osmangazi University, 26480, Eskisehir, Turkey,
[email protected], Tel: +90 222 239 37 50 Wroclaw University of Technology, Wybrzeze Wyspianskiego 27, 30-370 Wroclaw, Poland,
[email protected]
Abstract: The paper deals with Statistical Process Control (SPC) applied to three original and three generated variables of copper ore upgrading by flotation. The six variables were evaluated by the SPC charts based on industrial upgrading of copper ore data gathered during one month of operation in the form of copper content in feed, concentrate and tailing. The remaining three upgrading variables were concentrate yield, copper recovery in concentrate and non-copper components recovery in tailing. Although, all variables obeyed normal distribution, considerable autocorrelation was detected between observations for all variables. For this reason, the traditional Shewhart control charts, that assume the process data generated are normally and independently distributed, resulted in many of out-of-control points which may lead to wrong decisions regarding the control of process variables. The most suitable ARIMA time series models were determined for all variables to remove autocorrelations. The ARIMA(0,1,1) model was found the best for copper content in feed, copper content in concentrate, concentrate yield and non-copper components recovery in tailing, while the AR(1) model was suitable for copper content in tailing and copper recovery in concentrate. keywords: copper, upgrading, statistical process control, ARIMA model, Shewhart’s chart, autocorrelation
Introduction Each separation process provides a set of results, which can be used for evaluation, analysis and optimization of the process. The obtained data from industrial processing of raw materials are always scattered. It is due to fluctuation of operational variables and variation of feed composition (Mukherjee and Chandra, 2002; Drzymala et al., 2010). Moreover, most separation processes are specific and typical statistical methods applied for analysis and evaluation of separation results are very often not http://dx.doi.org/10.5277/ppmp140121
250
A. Tasdemir, P.B. Kowalczuk
applicable (Drzymala and Kowalczuk, 2010). It causes a need for appropriate processing of separation results data. The processing of an ore in beneficiation plants is mainly controlled by the grade of feed, concentrate and tailing. These data, and some new parameters of the ore upgrading such as recovery and yield can be calculated and used for evaluation of the overall plant performance (Wills and Napier-Munn, 2006; Drzymala, 2007). Therefore, the process data must be gathered and analysed to determine control limits of variables and to monitor them. During industrial processing two types of variability occur. The first one is the common cause variability that occurs with the nature of any process and cannot be avoided. The second one is a special cause variability, which is not a part of process characteristics and exists almost in all processes. The special cause variability can be identified and eliminated by the Statistical Process Control (SPC) charts. The SPC chart is a guide during decision making on the process and taking the corrective actions. If there is no special cause in the process, the SPC methods are also used to check its working conditions at a predetermined level (Smeti et al., 2006; Psarakis and Papaleonida, 2007). The control charts represent a very important tool in statistical quality control used to monitor a process and detect shifts in values of its variables. Traditional control charts are based on the assumption that process outputs obtained at each time period are normally distributed and independent (Alwan and Roberts, 1988; Zhang, 1997; Castagliola and Tsung, 2005). Many research studies showed that violation of these assumptions resulted in many false alarms which caused wrong decisions about the process (Alwan and Roberts, 1988; Stoumbos and Reynolds, 2000; Bisgard and Kulahci, 2005). Therefore, both normality and independence assumptions should be satisfied since most industrial data are usually non-normal and auto-correlated. The dynamics of any process induces correlated variables, which are closely spaced in time. Therefore, in the process outputs some correlations, called autocorrelation, can occur. The autocorrelation may have serious effects on the properties of standard control charts developed under independence assumption (Singh and Prajapati, 2011). Hence, the process mean is not constant if there is autocorrelation between variables (Thaga, 2008). It is well known that the autocorrelation may significantly degrade the in-control performance of the control charts due to frequent false alarms (Testik, 2005). The effect of autocorrelation on the performance of the Statistical Process Control (SPC) charts were reported by many authors (Alwan and Roberts, 1988; Montgomery and Mastrangelo, 1991; Reynolds and Lu, 1997; Zhang, 1997; Lu and Reynolds, 1999; 2001; Bisgaard and Kulahci, 2005; Testik, 2005; Singh and Prajapati, 2011). However, the data generated are assumed independent (not autocorrelated), and normally distributed in many SPC applications of mineral and/or mining industry and assumptions for the monitoring and process control aims. On the other hand, satisfaction of normality and dependence assumptions of the SPC is necessary to avoid wrong decisions due to false alarms on the charts (Bhattacherjee and Samanta, 2002).
Application of SPC for proper processing of the Fore-Sudetic Monocline copper ore
251
A significant effect of autocorrelation on the SPC charts was considered in mineral and mining applications by a limited number of studies (Samanta and Bhattacherjee, 2001; Bhattacherjee and Samanta, 2002; Samanta, 2002; Elevli et al., 2009; Tasdemir, 2012a; 2013). In the case of autocorrelation, it is necessary to make some modifications for traditional control charts. Fitting a time series model to the traditional control charts, which display the original observations was suggested by Alwan and Roberts (1988), Reynolds and Lu (1997), Lu and Reynolds (1999, 2001). A suitable time series model for the investigated quality parameter of the process is required to apply this method (Apley and Lee, 2003). The individual control chart applied to the residuals is called the Special Control Chart (SCC), which is also known as the X residual or the Shewhart chart. The first residual control chart was developed by Alwan and Roberts (1988). In residual charts, an appropriate time series model is fitted to autocorrelated observations and residuals are plotted on the SCC (Demirkol, 2008). More detailed information can be found in Psarakis and Papaleonida (2007) and the references therein. As in the many industrial plants, large amounts of data are obtained over time at mineral processing plants. The analyses of these resulting data by a suitable method are very important steps to understand the plant performance (Ketata and Rockwell, 2008). Application of times series to many data sets from mineral processing plants was shown to be a suitable method (Napier-Munn and Meyer, 1999; Meyer and Napier-Munn, 1999; Ganguli and Tingling, 2001) since the data structure is identical to the time series form. Many ore quality characteristic values in mineral processing are good examples of the time series that is correlated in time domain (Ganguli and Tingling, 2001; Elevli et al., 2009; Tasdemir, 2012a, b, 2013). Therefore, usage of the ARIMA time series for removing the autocorrelation to detect correct ore quality limits by the SPC is advantageous, since we can also use this time series model for near future estimation of ore quality characteristics. Two examples were reported for the short-term prediction of recovery and ore quality variables at a chromite preparation plant by using the AR(1) time series model (Tasdemir, 2012b, 2013). In this work we investigate the individual control charts based on the original observations of residuals obtained by the time series of ARIMA models to monitor three original and three generated upgrading variables of the Fore-Sudetic Monocline copper ores by a flotation process, that are copper content in the feed, concentrate and tailing, and three generated upgrading parameters, that are concentrate yield, Cu recovery in concentrate and non-Cu components recovery in tailing. The ARIMA models were developed for the copper ore parameters to characterize the autocorrelation between observations. Finally, we compare the performance of the standard Shewhart chart, which ignores subgroup correlations with the X- individual control charts of ARIMA residuals.
252
A. Tasdemir, P.B. Kowalczuk
Methods The data sets were obtained from the Fore-Sudetic Monocline copper ore flotation process gathered during one-month production (Drzymala and Kowalczuk, 2010) in the form of copper content in feed α, concentrate β and tailing ϑ, and three generated ⎛ α −ϑ ⎞ upgrading parameters, namely concentrate yield γ = ⎜ ⎟ ⋅ 100% , copper recovery ⎝ β −ϑ ⎠ in the concentrate ε = tailing ε o =
β (α − ϑ ) ⋅ 100% , and non-copper components recovery in α (β −ϑ )
( β − α )(100 − ϑ ) ⋅ 100% (Drzymala, 2007), to monitor the changes in the ( β − ϑ )(100 − α )
industrial processing plant. The plant works three shifts in a day, therefore 93 records were used to investigate the effect of autocorrelation on the performance of the Shewhart individual control charts based on the original observations or the residual charts from the ARIMA models. The SPC chart is used to present sample quality for one parameter measured in control samples. If the data occur outside the limits, the process is out-of-control and has to be stopped and inspected of causes, when the out-of-control points are detected. More detailed information on this topic can be found in Montgomery and Runger (2011) and Tasdemir (2012a,b). The parameters of time series models were estimated from the ARIMA models using Minitab 16 and Statgraphics Centrion XVI softwares. The softwares were also used for constructing and evaluation the SPC charts and for statistical analysis of residuals from the ARIMA models. More details on the ARIMA estimation methodology and model selection can be found in the work of Montgomery et al. (2008) and two examples for coal washing data were applied by Tasdemir (2012a). In this study, the Akaike Information Criterion (AIC) was considered during the selection of a suitable ARIMA model for the Cu upgrading variables. Finally, the Shewhart charts of individual observations were compared with the Shewhart charts of residuals to investigate the autocorrelation effect on the performance of the SPC charts.
Results and discussion Normality and autocorrelation of upgrading parameters The process control charts can be applied, when the normality assumption is satisfied. Without a normal distribution, correct limits of control charts may fail. Montgomery and Runger (2011) studied behaviour of the Shewhart control chart for non-normal process data. According to Montgomery and Runger (2011), even if the process shows evidence of moderate departure from normality, the given control limits may be entirely inappropriate. In situations involving a large number of measurements, it may
253
Application of SPC for proper processing of the Fore-Sudetic Monocline copper ore
99.9
99.9
99
99
95 90 80 70 60 50 40 30 20 10 5
95 90 80 70 60 50 40 30 20 10 5
Percent
Percent
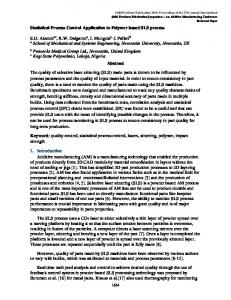
be possible to subgroup the data and construct the mean chart ( X ) instead of the X individual chart. However, the measurements should not be subgrouped arbitrarily for this purpose (Srinivasan, 2011). If subgrouping is not possible, two alternatives of the normality of data occur. One approach attempts to transform data. A number of mathematical transformations were developed over the years. The data transformation means performing the same mathematical operation on each piece of original data, preferably with a transformation method like the Box-Cox or the Johnson (Chou et al., 1998). Another approach is to modify the usual limits based on a suitable model for the data distribution (Castagliola and Tsung, 2005). Identifying a mathematical distribution can help to develop alternate control limits. Thus, it can be identified if the data belong to a particular class of distribution. The normal probability graphs of six copper upgrading variables are plotted with 95% confidence interval (Fig. 1). The p values, which test normal distribution, for all variables were higher than 0.05. It means that all the considered process data have normal distribution. It indicates that normality, the first assumption needed for applying the traditional Shewhart control charts, was satisfied.
Mean StDev N AD P-Value
1 0.1
1.4
1.5
1.6
1.7
1.8
1.9
1.726 0.09205 93 0.245 0,753
2.0
Mean StDev N AD P-Value
1 0.1
2.1
21
22
99.9
99
99
95 90 80 70 60 50 40 30 20 10 5
95 90 80 70 60 50 40 30 20 10 5
Percent
Percent
99.9
Mean StDev N AD P-Value
0.1 0.10
0.15
0.20
0.25
0.30
0.2217 0.02903 93 0.727 0.056
0.1
0.35
99
95 90 80 70 60 50 40 30 20 10 5
95 90 80 70 60 50 40 30 20 10 5
Percent
Percent
99.9
99
Mean StDev N AD P-Value
80
82
84
86
88
90
26
27
28
Mean StDev N AD P-Value
4
5
6
7
6.117 0.4935 93 0.374 0,409
8
Concentrate yield, γ
99.9
0.1
25
1
Cu content in tailing,
1
24
Cu content in concentrate, β
Cu content in feed, α
1
23
24.85 0.8258 93 0.534 0,168
92
Cu recovery in concentrate, ε
87.90 1.709 93 0.170 0,930
94
Mean StDev N AD P-Value
1 0.1
94.0
94.5
95.0
95.5
96.0
96.5
non-Cu recovery in tailing, ε0
Fig. 1. Normal probability plots of considered copper upgrading variables
95.32 0.4184 93 0.401 0,355
97.0
254
A. Tasdemir, P.B. Kowalczuk
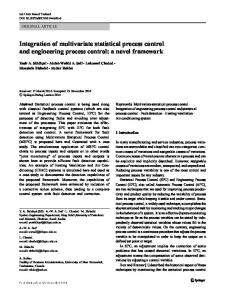
The statistical process control (SPC) can only be applied for a process, when the independence of data is also satisfied. If any correlation of data is detected, it has to be eliminated before use for the standard control charts. Data are autocorrelated when each value is correlated to the previous one. The autocorrelation (or time dependency) builds up automatically and occurs between observed data. It can be checked by scatter diagrams of each value (lag plot) against the previous one (Stapenhurst, 2005; Drzymala and Kowalczuk, 2010; NIST/SEMATECH, 2010). Figure 2 shows the scatter diagrams of six copper upgrading variables, where considerable positive correlations between two consecutive data values of all variables are observed. It means that there is no non-random pattern in the data. Since each individual observation is dependent upon the previous one, the degree of autocorrelation should be determined and removed before constructing the SPC charts. It can be done by using the ARIMA time series models. 2.0
27 26
1.9
25
αi
βi
1.8
24
1.7 23 1.6
22
1.5
21 1.5
1.6
1.7
1.8
1.9
2.0
21
22
23
24 βi-1
αi-1
0.300
25
26
27
7.5
0.275
7.0
0.225
γi
i
0.250
0.200
6.0
0.175
5.5
0.150
5.0 0.150
0.175
0.200
0.225 i-1
0.250
0.275
0.300
5.0
93
5.5
6.0
6.5 γi-1
7.0
7.5
96.5
92
96.0
91 90
95.5
89
ε0(i)
εi
6.5
88
95.0
87 94.5
86 85
94.0
84 84
85
86
87
88 89 εi-1
90
91
92
93
94.0
94.5
Fig. 2. The lag plots of copper upgrading variables
95.0 95.5 ε0(i-1)
96.0
96.5
255
Application of SPC for proper processing of the Fore-Sudetic Monocline copper ore Time Series Plot of Cu Content in Feed (α)
ACF for Cu content in feed (α)
1.8 1.7 1.6 1.5 1
9
18
27
36
45 54 Time
63
72
81
90
2
25 24 23 22 21 18
27
36
45 54 Time
63
72
81
2
4
Time Series Plot of Cu Content in Tailing ( )
0.225 0.200 0.175 0.150 27
36
45 54 Time
63
72
81
2
4
Time Series Plot of Concentrate Yield (γ)
6.0 5.5 5.0 27
36
45 54 Time
63
72
81
2
90 89 88 87 86 85 84 27
36
45 54 Time
63
72
81
2
95.5 95.0 94.5 94.0 27
36
45 54 Time
63
72
12 14 Lag
16
18
20
22
2
6
8
10
12 14 Lag
16
81
4
6
8
10
12 14 Lag
16
4
6
8
10
12 14 Lag
16
90
18
20
4
6
8
10
12 14 Lag
16
10
12 14 Lag
16
18
20
22
4
6
8
10
12 14 Lag
16
18
20
22
18
20
22
18
20
22
18
20
22
18
20
22
1.0 0.8 0.6 0.4 0.2 0.0 -0.2 -0.4 -0.6 -0.8 -1.0
22
2
4
6
8
10
12 14 Lag
16
PACF for concentrate yield (γ)
18
20
1.0 0.8 0.6 0.4 0.2 0.0 -0.2 -0.4 -0.6 -0.8 -1.0
22
2
4
6
8
10
12 14 Lag
16
PACF for Cu recovery in concentrate (ε)
18
20
1.0 0.8 0.6 0.4 0.2 0.0 -0.2 -0.4 -0.6 -0.8 -1.0
22
2
4
6
8
10
12 14 Lag
16
PACF for non-Cu recovery in tailing (ε0)
1.0 0.8 0.6 0.4 0.2 0.0 -0.2 -0.4 -0.6 -0.8 -1.0 2
8
PACF for Cu content in tailing ( )
Partial Autocorrelation
96.0
18
10
6
1.0 0.8 0.6 0.4 0.2 0.0 -0.2 -0.4 -0.6 -0.8 -1.0
ACF for non-Cu recovery in tailing (ε0)
Autocorrelation
non-Cu Recovery in Tailing (ε0)
Time Series Plot of non-Cu Recovery in Tailing (ε0)
9
8
1.0 0.8 0.6 0.4 0.2 0.0 -0.2 -0.4 -0.6 -0.8 -1.0
90
96.5
1
6
4
PACF for Cu content in concentrate (β)
Partial Autocorrelation
Autocorrelation
Cu Recovery in Concentrate (ε)
91
18
2
ACF for Cu recovery in concentrate (ε)
Time Series Plot of Cu Recovery in Concentrate (ε)
92
9
22
1.0 0.8 0.6 0.4 0.2 0.0 -0.2 -0.4 -0.6 -0.8 -1.0
90
93
1
20
Partial Autocorrelation
Autocorrelation
Concentrate Yield (γ)
6.5
18
18
ACF for concentrate yield (γ)
7.0
9
16
1.0 0.8 0.6 0.4 0.2 0.0 -0.2 -0.4 -0.6 -0.8 -1.0
90
7.5
1
12 14 Lag
Partial Autocorrelation
Autocorrelation
Cu Content in Tailing ( )
0.250
18
10
ACF for Cu content in tailing ( )
0.275
9
8
1.0 0.8 0.6 0.4 0.2 0.0 -0.2 -0.4 -0.6 -0.8 -1.0
90
0.300
1
6
Partial Autocorrelation
26
9
4
1.0 0.8 0.6 0.4 0.2 0.0 -0.2 -0.4 -0.6 -0.8 -1.0
ACF for Cu content in concentrate (β)
Autocorrelation
Cu Content in Concentrate (β)
Time Series Plot of Cu Content in Concentrate (β)
27
1
PACF for Cu content in feed (α)
1.0 0.8 0.6 0.4 0.2 0.0 -0.2 -0.4 -0.6 -0.8 -1.0
Partial Autocorrelation
1.9 Autocorrelation
Cu Content in Feed (α)
2.0
18
20
22
1.0 0.8 0.6 0.4 0.2 0.0 -0.2 -0.4 -0.6 -0.8 -1.0 2
4
6
8
Fig. 3. Time series, ACF and PACF plots of copper upgrading variables
10
12 14 Lag
16
256
A. Tasdemir, P.B. Kowalczuk
The assumptions of independence and stationary were also checked for six upgrading variables using the autocorrelation (ACF) and partial autocorrelation (PACF) functions. Figure 3 shows the time series plots of six data sets together with their ACF and PACF plots. The ACF plots show the correlation between Xt and Xt-k, where Xt is the response variable at time t, and k lag between two measurements. The PACF plots show the partial autocorrelation function for a given lag k, where the partial autocorrelation at lag k is the autocorrelation between Xt and Xt–k , that is not accounted for lags 1 through k – 1 (NIST/SEMATECH, 2010). These plots are generated for 25 lags. The ACF and PACF plots (Fig. 3) clearly confirm the existence of autocorrelation between values of all upgrading variables. It can be seen that the data are highly autocorrelated with the lag one autocorrelation of 0.472 for Cu content in tailing (ϑ) and 0.462 for Cu recovery in concentrate (ε). According to the autocorrelation plots of these variables, the ACF of the time series values cuts off quickly after few lags, then they can be considered stationary. The autoregressive models are indicated by exponential decay to zero of the ACF plot and order of the autoregressive model is determined by the initial peaks in the PACF plots. The ACF and PACF plots for ϑ and ε indicate the autoregressive model with lag 1, since they have one important spike at first lag in their PACF plots. For these reasons, the AR(1) model was suitable for fitting the data of copper content in tailing ϑ and copper recovery in concentrate ε. The autocorrelation of copper content in feed α and concentrate β, concentrate yield γ and non-copper components recovery in tailing εo can be also described by the ARIMA time series model. The autocorrelation values at first lag were determined as 0.361, 0.279, 0.402 and 0.399 for the copper content in feed (α), concentrate grade (β), yield of product (γ) and non-copper components content in tailing (εo), respectively (Fig. 3). The slow decay of autocorrelation coefficients for these variables in the ACF plots implies that they are not stationary. The stationary characters were achieved by applying first order differencing. After that, all upgrading variables showed one significant spike at the first lag of the ACF plots suggesting the first order of the moving average model MA(1). Finally, the ARIMA (0,1,1) model was found to be the most suitable for these variables. In the ARIMA (0,1,1) model the autogresessive parameter is zero, number of differencing passes is one and moving average parameter is one. ARIMA models and residual analysis The ARIMA time series models were used to remove autocorrelations. The models were fitted by using the Statgraphics software, which optimizes the model parameters according to the selection criteria of the model. The models with the lowest values of the Akaike Information Criterion (AIC) were selected as the best describing model of the variables. More detailed information about the AIC can be found in Tasdemir (2012a).
257
Application of SPC for proper processing of the Fore-Sudetic Monocline copper ore
It was mentioned before that among different ARIMA models, the ARIMA(0,1,1) was found the best one for α, β, γ and εo, while the first order autoregressive time series model AR(1) was the most suitable for ϑ and ε. The AR(1) model was used by many authors for daily metal recovery or concentrate grade at a zinc flotation plant, daily gold feed grade and gold recovery data (Napier-Munn and Meyer, 1999; Meyer and Napier-Munn, 1999), B2O3% contents in two colemanite concentrator plants (Elevli et al., 2009), Al2O3% and SiO2% constituents of a bauxite ore (Bhattacherjee and Samanta, 2002), forecasting chromite feed grade and product quality parameters (Tasdemir, 2013), and prediction of Cr2O3 recovery in a chromite preparation plant (Tasdemir, 2012b). Except the AR(1), other time series models were reported for mineral processing data such as the ARMA models for flotation (Trybalski and Cieply, 2000), SO2 emissions (Gleit, 1985) and coal preparation (Tasdemir, 2012a). Validation of the models obtained for the Cu upgrading variables was checked for the adequacy. The model is adequate if residuals are uncorrelated and normally distributed. The evaluation results of the ARIMA models as the so-called 4-plot of data and residual ACF plots for β as an example are presented in Fig. 4. It clearly indicates that the residuals are uncorrelated within (or very close to) 95% confidence limits and distributed randomly. The residuals of other parameters are also found uncorrelated and normally distributed. Therefore, they can be considered as a white noise allowing to work on the traditional SPC charts. Residual Plots for Cu content in concentrate (β) 2
-3.0
-1.5
0.0 Residual
1.5
0 -2
3.0
24.0
Histogram
25.6
2 Residual
Frequency
24.8 25.2 Fitted Value Versus Order
30 20 10 0
24.4
-3
-2
-1 0 Residual
1
2
0 -2 1 10 20 30 40 50 60 70 80 90 Observation Order
Autocorrelation
50 10 1 0.1
ACF of Residuals for Cu content in concentrate (β)
Versus Fits
99.9 99 90
Residual
Percent
Normal Probability Plot
1.0 0.8 0.6 0.4 0.2 0.0 -0.2 -0.4 -0.6 -0.8 -1.0 2
4
6
8
10
12 14 Lag
16
18
20
22
Fig. 4. Residual plots from ARIMA model and ACF chart for Cu content in concentrate β
The calculated parameters of the AR(1) and ARIMA(0,1,1) models for Cu upgrading variables are given in Tables 1 and 2, respectively. It can be seen that the pvalues of all model parameters are less than 0.05, so they are significantly different from zero at the 95.0% confidence level. We obtained the following AR(1) models for copper content in tailing ϑ and copper recovery in concentrate ε:
Xt = 0.472 Xt–1 + 0.117 with the AIC of –7.278 (for ϑ), Xt = 0.462 Xt–1 + 47.308
with the AIC of 0.894 (for ε).
258
A. Tasdemir, P.B. Kowalczuk
and ARIMA(0,1,1) models (Eq. 8) for copper content in feed α and concentrate β, concentrate yield γ and non-copper compounds recovery in tailing εo: Xt = Xt-1 + 0.759 a t–1
with the AIC of –4.977 (for α),
Xt = Xt-1 + 0.846 a t–1
with the AIC of –0.4804 (for β),
Xt = Xt-1 + 0.751 a t–1
with the AIC of –1.7362 (for γ),
Xt = Xt-1 + 0.754 a t–1
with the AIC of –2.0624 (for εo),
where at is the independent error term (random shock term) at time t, which reflects the amount of variation in data. Table 1. Summary of AR(1) model parameters for copper content in tailing ϑ and Cu recovery in concentrate ε. WNV means white noise variance of random shock term (at) in the model Upgrading variable Cu content in tailing, ϑ , %
Cu recovery in concentrate, ε, %
Model descriptors and statistics Parameter
Estimate
Standard error
t-value
p-value
AR(1)
0.471505
0.0908267
5.19126
0.000001
0.0048676
45.6189
0.000000
Mean
0.222053
WNV
0.000666
AR(1)
0.461607
0.0911491
5.0643
0.000002
Mean
87.8695
0.287521
305.611
0.000000
WNV
2.36768
Table 2. Summary of ARIMA(0,1,1) model parametersfor Cu content in feed α and concentrate β, concentrate yield γ, and non-copper components recovery in tailing εo. WNV means white noise variance of random shock term (at) in the model Upgrading variable Cu content in feed, α, % Cu content in concentrate, β, % Concentrate yield, γ, % Non-Cu recovery in tailing, ε0, %
Parameter MA(1) WNV MA(1) WNV MA(1) WNV MA(1) WNV
Model descriptors and statistics Estimate Standard error t-value 0.75944 0.068817 11.0356 0.00682 0.84585 0.061638 13.7229 0.62394 0.75112 0.067773 11.0828 0.17818 0.75425 0.067943 11.1013 0.12881
p-value 0.00000 0.00000 0.00000 0.00000
Individual control charts and ARIMA residuals The original and ARIMA residual values of the control chart parameters used for constructing the statistical process control chart (SPC) are given in Tables 3 and 4,
Application of SPC for proper processing of the Fore-Sudetic Monocline copper ore
259
respectively. In Tables 3 and 4, X is the mean of individual values and σ is standard deviation which is calculated from MR / 1.128 formula, where MR is the average moving range value of individual observations. The SPC charts are designed to allow determining whether the data come from a process which is in a state of statistical control. The individual Shewhart charts of six upgrading copper variables based on the original data and residuals obtained from the ARIMA models are presented in Fig. 5. Figure 5 compares the individual charts of the Shewhart (left hand side plots), and ARIMA residuals (special cause charts, right hand side plots) with additional Western Electric rules, which are applied to improve the efficiency of control charts for small shifts. The number of the Western Electric rules applied was four. The same run rules were used in our previous study (Tasdemir, 2012a). More details regarding the method can be found in Montgomery and Runger (2011). A common calculation is to plot the SPC with z-score when comparing multiple control charts. Therefore, the numerical values of the original and ARIMA residual data set in Fig. 5 were presented as z-score values. The z-scores standardize ±3σ values. The calibrated z-values of control charts presented in Fig. 5 were calculated from formula
UCLX − X
σ
for the upper control
limit and LCLX − X for the lower control limit. σ
Table 3. Individual Shewhart’s chart parameters of Cu upgrading variables
ϑ
Chart parameters Upper control limit, UCLX ( X + 3σ )
α 1.942
β 26.81
0.284
γ 7.199
ε 91.676
εo 96.219
Mean of individual values ( X )
1.726
24.85
0.222
6.117
87.903
95.319
Lower control limit, LCLX ( X − 3σ )
1.508
22.89
0.159
5.035
84.129
94.419
Average of moving average ( MR) σ (MR / 1.128) 2σ 3σ
0.082
0.736
0.024
0.407
1.419
0.338
0.072 0.144 0.216
0.652 1.305 1.956
0.021 0.042 0.063
0.361 0.722 1.083
1.258 2.516 3.774
0.300 0.600 0.900
Table 4. ARIMA residual chart parameters of Cu upgrading variables Chart parameters Upper control limit, UCLX ( X + 3σ )
ϑ
α 0.244
β 2.063
0.077
γ 1.205
ε 4.694
εo 0.975
Mean of individual values ( X )
0.002
–0.019
–0.0003
0.016
0.025
–0.013
Lower control limit, LCLX ( X − 3σ )
–0.239
–2.1
–0.077
–1.173
–4.644
–1.001
Average of moving average ( MR) σ (MR / 1.128) 2σ 3σ
0.091
0.783
0.029
0.447
1.755
0.371
0.081 0.161 0.242
0.694 1.388 2.081
0.026 0.052 0.077
0.396 0.793 1.189
1.556 3.112 4.669
0.329 0.659 0.988
260
A. Tasdemir, P.B. Kowalczuk 5
5
X- Individual Chart for Cu content in feed
3
3.00
1
-1
-3
-3.00
-3
-5 0
5
20
40 60 Observation
80
100
0 5
X- Individual Chart for Cu content in concentrate
20
40 60 Observation
80
100
X-Individual Chart of residuals for Cu content in concentrate
3
3.00
1
3.00
0.00
0.00
Z
Z
1
-1
-1
-3.00
-3
-3
-5
-3.00
-5
0
20
40 60 Observation
80
0
100
5
X- Individual Chart for Cu content in tailing
3
3.00
40 60 Observation
80
100
X- Individual Chart of residuals for Cu content in tailing 3.00
1 0.00
Z
Z
0.00
20
3
1 -1
-1 -3.00
-3
-3
-5 0
20
40 60 Observation
80
-3.00
-5
100
0 5
X - Individual Chart for concentrate yield
3
20
40 60 Observation
80
100
X - Individual Chart of residuals for concentrate yield
3
3.00
1
3.00
1 0.00
Z
Z
0.00
-1
-1 -3.00
-3
-3
-5 0
20
40 60 Observation
80
-3.00
-5
100
0
20
40 60 Observation
80
100
5 X - Individual Chart of residuals for Cu recovery in concentrate
X - Individual Chart for Cu recovery in concentrate
3
3
3.00
3.00
Z
0.00 -1 -3.00
-3
Z
1
1
0.00 -1 -3
-3.00
-5
-5 0
5
-3.00
-5
3
5
0.00
Z
Z
0.00
5
3.00
1
-1
5
X-Individual Chart of residuals for Cu content in feed
3
20
40 60 Observation
80
0
100 5
X - Individual Chart for non-Cu recovery in tailing
40 60 Observation
80
100
X - Individual Chart of residuals for non-Cu recovery in tailing
3
3.00
3
20
3.00
1
Z
0.00 -1 -3.00
-3
0.00
Z
1
-1 -3
-3.00
-5
-5 0
20
40 60 Observation
80
100
0
20
40 60 Observation
80
100
Fig. 5. Comparison of Shewhart’s chart of original data (left) and ARIMA residuals (right) with unusual points determined by run rules
Application of SPC for proper processing of the Fore-Sudetic Monocline copper ore
261
From Fig. 5, it can be seen that the number of out-of-control points on the original and residual SPC charts are different. Higher number of out-of-control points are given on the SPC charts (Fig. 5, left), which only assume the independence of data and use original data values. From 93 individual observations unusual points were determined as 18 for α, 19 for β, 16 forϑ, 25 for γ, 14 for ε and 28 for εo by applying the run rules. On the other hand, the residual charts (Fig. 5, right), which consider the autocorrelation give less uncontrolled data points: 2 for α, 4 for β, 4 for ϑ, 1 for γ, 7 for ε and 3 for εo. This clearly indicates that wrong decisions can be made about uncontrolled number of process variables, when the data used are autocorrelated. Therefore, if there is any autocorrelation between the consecutive observations it should be taken into account during the process control of the Cu beneficiation variables. The autocorrelation effect on the SPC charts was already shown as the important factor in some mineral processing and mining applications (Samanta and Bhattacherjee, 2001; Bhattacherjee and Samanta, 2002; Samanta, 2002; Elevli et al., 2009; Tasdemir, 2012a; 2013). Also, the performance of the Shewhart individual chart was shown to be better for weak positive and negative autocorrelation, and it is advisable only for small values of autocorrelation (Karaoglan and Bayhan, 2011; Tasdemir, 2013).
Conclusions The methodology for monitoring a plant scale copper flotation process was proposed. The technique was based on the statistical quality control charts used to monitor the process and detect shifts in values of its variables. As in the many modern applications of statistical process control charts, the autocorrelation has an important effect on mining and mineral industry data and it should be considered. When the data are autocorrelated the wrong decisions can be made about uncontrolled number of process variables. If there is any autocorrelation between the consecutive observations, it should be taken into account during the process control of the Cu beneficiation parameters. The data showed that copper upgrading variables obtained during the beneficiation of the copper ore from the Fore-Sudetic Monocline (SW Poland) were autocorrelated over time. It was shown that the typical Shewhart charts are inappropriate for controlling the upgrading variables of the copper ore due to the existence of autocorrelation. The autocorrelation can be described by the suitable ARIMA time series models. It was found that the upgrading variables of copper content in feed, concentrate, product yield and non-copper components recovery in concentrate can be modelled by the ARIMA(0,1,1), while copper content in tailing and copper recovery in concentrate were described by the AR(1). It was determined that the standard control charts are not capable of detecting right unusual points of the copper ore upgrading variables, when the data are autocorrelated from one time period to the next one. Usage of the residual charts is more suitable to
262
A. Tasdemir, P.B. Kowalczuk
monitor or control the Cu ore upgrading variables, since the residuals resulted from the ARIMA models consider the dynamics of the process. Since the time series are often used for near future estimation aims, the ARIMA models developed in this research to remove autocorrelation of the Cu upgrading variables can be considered as a useful tool for the short-term process control functions. Acknowledgements The authors thank Prof. Jan Drzymala (Wroclaw University of Technology) for his help in many aspects of this work. Financial support by the Polish Statutory Research Grants (S20119 and B20073), the Foundation for Polish Science (FNP), and a Fellowship co-financed by the European Union within the European Social Fund are also greatly acknowledged.
References ALWAN L.C., ROBERTS H.V., 1988, Time Series Modelling for Statistical Process Control, Journal of Business and Economic Statistics, 6: 86–95. APLEY D.W., LEE H.C., 2003, Design of Exponentially Weighted Moving Average Control Charts for Autocorrelated Processes With Model Uncertainty, Technometrics, 45(3): 187–198. BHATTACHERJEE A., SAMANTA B., 2002, Practical Issues in the Construction of Control Charts in Mining Applications, The Journal of The South African Institute of Mining and Metallurgy, 173–180. BISGAARD S., KULAHCI M., 2005, Quality Quandaries: The Effect of Autocorrelation on Statistical Process Control Procedures, Quality Engineering, 17: 481–489. CASTAGLIOLA P.. TSUNG F., 2005, Autocorrelated SPC for non-normal situations, Qual. Reliab. Engng. Int., 21, 131–161. CHOU Y.M., POLANNSKY A.M., MASON R.L., 1998. Transforming non–normal data to normality in statistical process control, Journal of Quality Technology, 30(2), pp. 133–141. DEMIRKOL Ş., 2008, Comparison of Control Charts for Autocorrelated Data, Master Thesis, Graduate School of Natural and Applied Sciences of Dokuz Eylül University. DRZYMALA J., 2007, Mineral processing. Foundation of Theory and Practice of Metallurgy. Oficyna Wydawnicza PWr, Wroclaw. DRZYMALA J., LUSZCZKIEWICZ A., FOSZCZ D., 2010, Application of Upgrading Curves for Evaluation of Past, Present and Future Performance of a Separation Plant, Mineral Processing and Extractive Metallurgy Review, 31(3), 165–175. DRZYMALA J., KOWALCZUK P.B., 2010, Problems with Statistical Evaluation of Separation Results, Proceedings of The XIIth International Mineral Processing Symposium, Cappadocia, Turkey, 1191– 1202. ELEVLI S., UZGÖREN N., SAVAS M., 2009, Control Charts for Autocorrelated Colemanite Data, Journal of Scientific & Industrial Research, 68: 11–17. GANGULI R., TINGLING J.C., 2001, Algorithms to Control Coal Segregation Under Non-Stationary Conditions Part II: Time Series Based Methods, International Journal of Mineral Processing, 61, 261– 271. GLEIT A., 1985, SO2 Emissions and Time Series Models, Journal of Air Pollution Control Association, 35(2), 115–120. KETATA C., ROCKWELL M.C., 2008, Stream Material Variables and Sampling Errors, Mineral Processing & Extractive Metall. Rev., 29, 104–117.
Application of SPC for proper processing of the Fore-Sudetic Monocline copper ore
263
KARAOGLAN A.D., BAYHAN G.M., 2011, Performance Comparison of Residual Control Charts for Trend Stationary First Order Autoregressive Processes, Gazi University Journal of Science, 24(2):329–33. LU C.W., REYNOLDS Jr. M.R., 1999, Control Charts for Monitoring the Mean and Variance of Autocorrelated Processes, Journal of Quality Technology, 31: 259–274. LU C.W., REYNOLDS, Jr. M.R., 2001, CUSUM Charts for Monitoring an Autocorrelated Process, Journal of Quality Technology 33: 316–334. MEYER D., NAPIER-MUNN T., 1999, Optimal Experiments for Time-Dependent Mineral Processes, Austral. & New Zealand J. Statist., 41(1), 3–17. MUKHERJEE A.M., CHANDRA S., 2002. A Robust Statistical Method to Evaluate Unit Operation in Coal Washery, International Journal of Mineral Processing, 66, 145–162. MONTGOMERY D.C., MASTRANGELO C.M., 1991, Some Statistical Process Control Methods for Autocorrelated Data, Journal of Quality Technology, 23: 179–293. MONTGOMERY D.C., JENNINGS C.L., KULAHÇI M., 2008, Introduction to Time Series Analysis and Forecasting, Wiley Series in Probability and Statistics. MONTGOMERY D.C., RUNGER G.C., 2011, Applied Statistics and Probability for Engineers, Fifth Edition, John Wiley&Sons, Inc. NAPIER-MUNN T.J., MEYER D.H., 1999, A Modified Paired t–Test for the Analysis of Plant Trials with Data Autocorrelated in Time, Minerals Engineering, 12(9), 1093–1100. NIST/SEMATECH e-Handbook of Statistical Methods, 2010, free access at http://www.itl.nist.gov/ div898/handbook/, 2/16/2010 and 4/15/2013. PSARAKIS S., PAPALEONIDA G.E.A., 2007, SPC Procedures for Monitoring Autocorrelated Processes, Quality Technology & Quantitative Management, 4(4), 501–540. REYNOLDS JR. M.R., LU C.W., 1997, Control Charts for Monitoring Processes with Autocorrelated Data, Nonlinear Analysis, Theory, Methods &Applications, 30(7): 4059–4067. SAMANTA B., BHATTACHERJEE A., 2001, An Investigation of Quality Control Charts for Autocorrelated Data, Mineral Resources Engineering, 10: 53–69. SAMANTA B., 2002, Multivariate Control Charts for Grade Control Using Principal-Component Analysis and Time Series Modelling, Trans. Inst. Min. Metall. (Sect A: Min Technol), 307: 149–157. SINGH S., PRAJAPATI D.R., 2011, Behavior of CUSUM Chart for Autocorrelated Data, International Journal of Engineering Sciences Research, Vol. 02, Issue 04, 1–8. SMETI E.M., KOUSOURIS L.P., TZOUMERKAS P.C., GOLFINOPOULOS S.K., 2006, Statsitical Process Control Techniques on Autocorrelated Turbidity Data from Finished Water Tank, Proceedings of An International Conference on Water Science and Technology Integrated Management on Water Resources, AQUA 2006, Athens, Greece. SRINIVASAN A., 2001, Application of information technology and statisitcal process control in pharmaceutical quality assurance &comliance, MSc Thesis in Electrical Engineering & Computer Science, Massachusettes Institute of Technology. STOUMBOS Z.G.B., REYNOLDS Jr. M.R., 2000, Robustness to non–normality and auto-correlation of individuals control charts, Journal of Statistical Computation and Simulation, 66(2), pp. 145–187. STAPENHURST T., 2005, Mastering Statistical Process Control, A Handbook for Performance Improvement Using Cases, Elsevier. TASDEMIR A., 2012a, Effect of Autocorrelation on the Process Control Charts in Monitoring of a Coal Washing Plant, Physicochemical Problems of Mineral Processing, 48(2), 495–512.
264
A. Tasdemir, P.B. Kowalczuk
TASDEMIR A., 2012b, Prediction of Chromite Concentrate Recovery in A Chromite Processing Plant by ARIMA Model of Time Series, Proceedings of XIIIth International Mineral Processing Symposium, Bodrum, Turkey, 911–918. TASDEMIR A., 2013, Analysis of Chromite Processing Plant Data by First Order Autoregressive Model, Physicochemical Problems of Mineral Processing, 49(1), 157–174. TESTIK M.C., 2005, Model Inadequacy and Residuals Control Charts for Autocorrelated Processess, Quality and Reliability Engineering International, 21, 115–130. THAGA K., 2008, Control Chart for Autocorrelated Process with Heavy Tailed Distributions, Economic Quality Control, 23(2): 197–206. TRYBALSKI K., CIEPLY J., 2000, ARMA Type Model for Copper Ore Flotation, Proceedings of the XXI International Mineral Processing Congress, Developments in Mineral Processing C3(72–78). WILLS B.A., NAPIER-MUNN T., 2006, Mineral Processing Technology, An Introduction to the Practical Aspects of Ore Treatment and Mineral Recovery, Elsevier Science & Technology Books. ZHANG N.F., 1997, Detection Capability of Residual Control Chart for Stationary Process Data, Journal of Applied Statistics, 24(4): 475–492.