International Journal of Research (IJR) e-ISSN: 2348-6848, p- ISSN: 2348-795X Volume 2, Issue 10, October 2015 Available at http://internationaljournalofresearch.org
Application of Taguchi Method for Optimization of Process Parameters in Improving the Productivity of Corrugation Operation Mohit Mittal mohit.
[email protected] Assistant Professor, B.S Anangpuria Institute of Technology& Management, Maharshi Dayanand University, Rohtak (Haryana) ABSTRACT: Taguchi Method is a powerful statistical approach to enhance the Quality & Productivity of Process by optimization of Process Parameters (Nutek Report on Basic Design of Experiment). The Objective of this study is to implement the Design of Experiments (DOE) based Taguchi Method in Corrugation operation for optimizing the Productivity. The Orthogonal Array, Signal to Noise Ratio, individual factor influence is employed to study the Quality Characteristics on Corrugation Operation. In Research Process, critical control factors namely Raw Material, Preheating Temp., Flute Profile, Speed of Corrugating Roll, Adhesive, & Pressure Roll Temp were considered. Accordingly, a suitable orthogonal array was designed & experiments were conducted. After conducting the experiments, signal to noise ratio was calculated for determining optimum parameter value. These results were compared with the results of full factorial method. Keywords: Corrugation Process; Design of Experiment; Orthogonal array; S/N Ratio; Taguchi Method that it nullifies the effect of noise factors. I. INTRODUCTION Taguchi Method is a standardized method of Taguchi Method consist experiment design by Design of Experiment (DOE) developed by Dr. standardized orthogonal array to analyze the Genichi Taguchi to study the effects of multiple factor influence and predict the Quality variables simultaneously for determining the Characteristics (W. T. Foster, Basic Design of optimum result (A Primer of Taguchi Method Experiment, 2000). by Ranjit Roy).Taguchi parameter design Here, an attempt has been made to technique improves product/process design via demonstrate the application of Taguchi Method consistency of performance & robustness to improve the productivity of Corrugation (insensitivity toward uncontrollable factor) operation by optimization of process (Roy, Ranjit K. Design of Experiments, 2001). parameters. Productivity is the important The main applications of Taguchi Methodology component to evaluate the performance of an are Optimize Designs using analytical enterprise, growth of the MSMEs, Economic simulation studies, Select better alternative in growth of the nation, & employment generation Development and Testing, Optimize (Vrat,P., Sardana, G.D. and Sahay, B.S. 1998). manufacturing Process Designs,& solve So it is highly desirable to improve Quality & productivity of process. manufacturing problems (Taguchi Experiment Design, Kraus International Publications, 1987). II. APPROACH TO PRODUCT/PROCESS Success in achieving the desired results involves DEVELOPMENT a careful selection of process parameters & Many methods have been implemented & bifurcating them into control and noise factors. developed over the years to optimize the Selection of control factors must be made such
Available online:http://internationaljournalofresearch.org/
P a g e | 537
International Journal of Research (IJR) e-ISSN: 2348-6848, p- ISSN: 2348-795X Volume 2, Issue 10, October 2015 Available at http://internationaljournalofresearch.org
production process. Some of the most used approaches are given below: 1.1 Build-Test-Fix The “Build-test-fix is the most primitive approach aimed at achieving performance on target and reduced variation by process/product tested approach and reworked each time till the target value is not achieved. It is based on trial methodology according to the resources available, instead of trying to optimize it. 1.2 One Factor at a Time The “One-factor-at-a-time” is a tedious, time consuming, & expansive approach aimed at optimizing the process by running an experiment at one particular condition and repeating the experiment by changing any one control factor till the effect of all control factors analyzed. The main disadvantage of this optimization technique is not consider the interaction between control variables and only individual factor influence are taken into account. 1.3 Design of Experiment The Design of Experiment is a statistical technique in product/process development that provides a predictive knowledge of a complex, multi variable process. It is considered as best tool for optimum factor solution under multiple variable condition with minimum effort. Following are the major approaches to DOE: 1.3.1 Full Factorial Design A Full factorial experiment is an experimental design technique that takes all possible combination of each factor for studying the effect of each factor, & the effects of interactions between factors on the response variable. If there are k factors with 2 levels then full factorial design has 2k runs. 1.3.2 Taguchi Method The full factorial design becomes laborious & complex method since it requires a large number of experiments to be carried out by considering all possible control variable Available online:http://internationaljournalofresearch.org/
combination. To overcome this problem, Taguchi introduced an experiment design technique by using orthogonal array to study the entire parameter range with lesser number of experiments. Taguchi recommends the use of loss function to measure the performance characteristics that are deviating from the target value. The value of Loss function is further transformed to signal-to-noise ratio. Usually, there are three categories of performance characteristics (nominal the best, smaller-thebetter, and larger-the-better) are used to analyze the S/N ratio. III. Steps involved in Taguchi Method Taguchi Method is used to improve the Quality of products & process (System of Experiment design, UNIPUB, 1987). Following are the application steps are: 1.Brainstorming: This is necessary first step in any application. The session should include firsthand knowledge of the project. Determine what you are after and how to evaluate it. When there is more than one criterion of evaluation, decide how each criterion is to be weighted and combined for the overall evaluation. Identify all influencing factors and those to be included in the study. Determine the factor levels. Determine the noise factor and the condition of repetitions. 2. Designing Experiments: Experiments was designed by using factors & levels determined in the brainstorming session. To design the experiments, implement the following: Select the appropriate orthogonal array. Assign factor and interaction to columns. Describe each trial condition. Decide order and repetition trials. 3. Running Experiments: Run experiments in random order when possible.
P a g e | 538
International Journal of Research (IJR) e-ISSN: 2348-6848, p- ISSN: 2348-795X Volume 2, Issue 10, October 2015 Available at http://internationaljournalofresearch.org
4. Analyzing Results: Analysis is performed to determine the following The Optimum Design Influence of Individual Factors IV. APPROACH TO THE EXPERIMENT DESIGN According to steps that are involved in Taguchi Method, a series of experiments are to be conducted. Here a case study, optimization of corrugation process by using Taguchi Method is given. The procedure is given below: 4.1
2. Preheating Temperature 3. Profile of Corrugating Roll 4. Speed of Corrugating Roll 5. Type of Adhesive used 6. Pressure Roll Temperature Noise Factors 1. Humidity 2. Vibrations 3. Temperature 4. Operator Skill 5. Machine Condition Corrugation Machine Parameters 1. Paper Roll Diameter – 1.5 m 2. Width of Paper Roll – 3.3 m 3. Steam Pressure – 15 bar 4. Spray Damper Pressure – 2 bar 5. Corrugating Roll Material – Chrome Molybdenum Steel 6. Roller Coating Thickness – 0.05 to 0.08 Tungsten Coating Thicknesses 7. Hardness of Roller - > 55-60 HRC 8. Pressure Roll Diameter – 250 mm 9. Flute Roll Diameter – 320 mm
Identification of Main Function, Objective & Result, and Quality Characteristics Main Function: Corrugation operation on Kraft material using Corrugated Machine Objective & Result –Determine best process parameter settings. Quality Characteristics – Measure Rate of Production (Output/time).
4.2 Determine System Parameters (Control Factors, Noise Factors, Corrugation Machine Parameter) Control Factors: 1. Type of Raw Material (Corrugating Medium & Liner material).
4.3 Identify the Objective Function Objective function: Larger the Better S/N Ratio for this function: ƞ
= -10
2
log10(i )/n) Where n=Sample Size, Y=Rate of Production
4.4 Define the Control Factor Level TABLE: 4.1 CONTROL FACTORS & THEIR LEVEL FACTORS
LEVEL 1
LEVEL 2
Raw Material (Corrugated Medium & Liner)
Kraft Medium & Kraft Liner
Kraft Liner & Semi Kraft Fluting
Preheating Temp.
192.2 C
180 C
Flute Type of Corrugated Roll
Coarse Flute Type
Fine Flute Type
Speed of Corrugated Roll
30 m/min
40 m/min
Adhesive Type
High Amylose Hybrid
Conventional Corn Starch Type
Pressure Roll Temp.
115 C
130C
Available online:http://internationaljournalofresearch.org/
P a g e | 539
International Journal of Research (IJR) e-ISSN: 2348-6848, p- ISSN: 2348-795X Volume 2, Issue 10, October 2015 Available at http://internationaljournalofresearch.org
(Source: Author Observation) 4.5 Experimental Design by Orthogonal Array: Orthogonal array define the number of factors and their appropriate level. The total number of factors available divided by the number of repetitions yield the size of the array for design. A number of factors are identified for an optimization of corrugation process. Time available is two weeks during which only 25 tests can be run Three repetitions for each trial condition is desired Array size 25/3 = L-8 Array Six from the identified 2- Level factors can be studied. TABLE: 4.2 EXPERIMENT DESIGN BY ORTHOGONAL ARRAY Experiment No. 1 2 3 4 5 6 7 8
Control Factors A 1 1 1 1 2 2 2 2
B 1 1 2 1 2 2 1 2
C 1 1 1 2 2 1 2 2
D 1 2 2 2 1 1 1 2
E 1 2 1 1 1 2 2 2
F 1 2 2 1 1 2 1 2
(Source: Author Observation) 4.6 Conducting the Matrix Experiment In accordance with the above OA, experiments were conducted with their factors & their level as shown in table 4.2. Each of the above 8 experiments were conducted 3 times (24 experiments) to account for the variations that may occur due to the noise factors. The Table 4.3 shows the measured value of rate of production obtained from different experiments. TABLE 4.3: MEASURED VALUE OF RATE OF PRODUCTION EXPERIMENT NO.
RATE OF PRODUCTION (OUTPUT/TIME) (m/min)
1
2
3
MEAN
1
250
255
248
251
2
268
270
271
269.6
3
260
258
260
259.33
4
300
295
298
297.66
5
265
264
265
264.66
6
208
210
210
209.33
7
245
244
246
245
8
290
288
290
289.33
Available online:http://internationaljournalofresearch.org/
P a g e | 540
International Journal of Research (IJR) e-ISSN: 2348-6848, p- ISSN: 2348-795X Volume 2, Issue 10, October 2015 Available at http://internationaljournalofresearch.org
4.7 Examination of Data The following are the experimental results of the work carried out. 4.7.1 Experimental Details Since, the Objective Function (Rate of Production) is Larger-the-Better type of control function, was used in calculating S/N Ratio.The S/N ratios of all the experiments were calculated and tabulated as shown in Table 4.4. TABLE: 4.5 TABULATED S/N RATIO E 1 2 3 4 5 6 7 8
x p
e
r
i
m
e
n
t
N
o
. . . . . . . . .
S 4 4 4 4 4 4 4 4
/
N
R
a
t
7 8 8 9 8 6 7 9
i
o
( 9 6 2 4 4 4 7 2
. . . . . . . .
d
b
) 9 2 7 7 5 2 8 3
(Source: Author Observation) The S/N ratio for the individual control factors are calculated as given below: Aa1= (ƞ1+ƞ2+ƞ3+ƞ4), Aa2 = (ƞ5+ƞ6+ƞ6+ƞ7+ƞ8), Bb1 = (ƞ1+ƞ2+ƞ4+ƞ7), Bb2 = (ƞ3+ ƞ5+ ƞ6+ ƞ8) Cc1 = (ƞ1+ ƞ2+ ƞ3+ ƞ6), Cc2 = (ƞ4+ ƞ5+ ƞ7+ ƞ8), Dd1 = (ƞ1+ ƞ5+ ƞ6+ ƞ7), Dd2 = (ƞ2+ ƞ3+ ƞ4+ ƞ8) Ee1 = (ƞ1+ ƞ3+ ƞ4+ ƞ5), Ee2 = (ƞ2+ ƞ6+ ƞ7+ ƞ8), Ff1 = (ƞ1+ ƞ4+ ƞ5+ ƞ7), Ff2 = (ƞ2+ ƞ3+ ƞ6+ ƞ8) ƞk is the S/N ratio corresponding to Experiment k. Average S/N ratio corresponding to Raw Material at Level 1 = Aa1/4 Average S/N ratio corresponding to Raw Material at Level 2 = Aa2/4 Similarly S/N ratio is calculated corresponding to Preheat Temp., Flute Type, Speed, Adhesive, and PressureRoll Temperature. TABLE: 4.6AVERAGE S/N RATIO FOR EACH FACTOR Raw Material Preheat Temp. Level
1 2
Avg S/N ratio 194.35 48.58 191.88 47.97 Sum (Aaj)
Avg S/N ratio 48.47 191.5 47.88 48.1 194.93 48.73
Sum Avg S/N (B bj) ratio 193.9 192.4
Flute Type Sum CCJ
Speed Avg S/N ratio 190.6 47.65 195.6 48.9
Sum DDJ
Adhesive Avg S/N ratio 194.2 48.55 192.1 48.02
Sum EEJ
Pressure roll temp Avg S/N ratio 193.7 48.43 192.5 48.13
Sum FFJ
(Source: Author Observation)
Available online:http://internationaljournalofresearch.org/
P a g e | 541
International Journal of Research (IJR) e-ISSN: 2348-6848, p- ISSN: 2348-795X Volume 2, Issue 10, October 2015 Available at http://internationaljournalofresearch.org
FIG: 4.2 CHARTS SHOWING PARAMETER LEVEL V/S S/N RATIO
(a). Raw Material 49 48.6
48.5 48
47.9
S/N Ratio
47.5 Level 1
Level 2
(b). Preheat Temp 48.6 48.47
48.4
48.2
48.1
48
S/N Ratio
47.8 Level 1.
Level 2.
(c). Flute Type 49
48.73
48.5 48
47.88
S/N Ratio
47.5 47 Level 1
Level 2
(d). Speed 50 49 48 47 46
48.9 47.65
Level 1
Available online:http://internationaljournalofresearch.org/
S/N Ratio
Level 2
P a g e | 542
International Journal of Research (IJR) e-ISSN: 2348-6848, p- ISSN: 2348-795X Volume 2, Issue 10, October 2015 Available at http://internationaljournalofresearch.org
(e). Adhesive 48.6 48.4 48.2 48 47.8 47.6
48.55
48.02
Level 1
S/N Ratio
Level 2
(f). Pressure Roll Temp 48.5 48.43
48.4 48.3 48.2
S/N Ratio
48.15
48.1 48 Level 1
Level 2
(Source: Author’s Data Analysis) For calculating the “Production Rate” the objective function, “Larger the Better” type was used as shown. The factor levels corresponding to the highest S/N ƞ = -10 log10 (i2)/n) ratio were chosen to optimize the condition. From these linear graphs it is clear that the optimum values of the factors and their levels are as given below. TABLE: 4.7 OPTIMUM VALUES OF FACTOR & THEIR LEVEL P R
a a
r w
a
m
M
a
e t
e
P r e h e a t i n g F
l
u
S A
t
e
p d
t r
P r e s s u r e
e
i
a
r
O
l
Kraft Liner & Kraft Fluting Medium
T e m p . T
y
e h
e
p
s
i
C
d
4
e
H
R o l l
T e m p .
1
v
t
1
e
e
p
i
m
9 o
a g
m
2 r
s
F
l
m h
A
m
V
.
e
0 i
u
y
1
u
o s 5
l
u
e
2 t
/ l
a
C e
T
y
m e
H
p
i y
b
e n
r
i
d C
(Source: Author Observation) 4.7.2 Average Effect of Factor Influence It is important to study the How the factors behave? For Analysis of factor influence following calculation has been done by author. T = (251+269.60+259.33+297.66+264.66+209.33+245+289.33)/8 = 260.74
Available online:http://internationaljournalofresearch.org/
P a g e | 543
International Journal of Research (IJR) e-ISSN: 2348-6848, p- ISSN: 2348-795X Volume 2, Issue 10, October 2015 Available at http://internationaljournalofresearch.org A1 = (251+269.60+259.33+297.66)/4 = 269.39 A2 = (264.66+209.33+245+289.33)/4 = 252.08 B1 = (251+269.6+297.66+245)/4 = 265.82 B2 = (259.33+264.66+209.33+289.33)/4 = 255.66 C1 = (251+259.33+269.6+209.33)/4 = 247.32 C2 = (297.66+264.66+245+289.33)/4 = 274.16 D1 = (251+264.66+209.33+245)/4 = 242.49 D2 = (269.6+259.33+297.66+289.33)/4 = 278.98 E1 = (251+259.33+297.66+264.66)/4 = 268.16 E2 = (269.6+209.33+245+289.33)/4 = 253.32 F1 = (251+297.66+264.66+245)/4 = 264.58 F2 = (269.6+259.33+209.33+289.33)/4 = 256.89
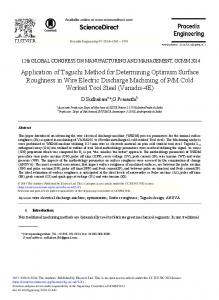
FIG: 5.1 AVERAGE EFFECTS OF FACTOR INFLUENCE
Chart Title 290 280 270
278.98 274.16
269.4 268.16 265.82 264.6
260 250
PREHEATING TEMP 256.9 255.66 253.32 252.1
247.32 242.5
240
RAW MATERIAL
FLUTE TYPE SPEED OF FLUTE ROLL ADHESIVE
230 220
PRESSURE ROLL TEMP. LEVEL 1
LEVEL 2
(Source: Author Observation) Performance Improvement: Improved performance from DOE = Estimated performance at the optimum condition (Y opt) Yopt = 297.66 The estimated performance can be expressed in terms of a percent improvement, if the current performance is known. Assume that the current performance is the grand average of performance (Y current) =264.66 Improvement = x 100 = x 100 = 12.5% 4.8 Confirmation Experiment The following table 4.8 shows confirmation experiments conducted using Kraft liner & Kraft fluting medium type of raw material, 192.20C Temp. Of preheater, Coarse Flute type of corrugating roll, 40 m/min speed of Corrugating Roll, High Amylose Hybrid type of adhesive, & 115 0C Pressure Roll Temp. Total 3 set of experiments were conducted & their production rate were calculated. It can be seen that results are consistent.
Available online:http://internationaljournalofresearch.org/
P a g e | 544
International Journal of Research (IJR) e-ISSN: 2348-6848, p- ISSN: 2348-795X Volume 2, Issue 10, October 2015 Available at http://internationaljournalofresearch.org
TABLE 4.8: CONFIRMATION EXPERIMENT E x p 1 2 3 M
e
r
i
e
m
e
n
t
a
N
o
. Rate of Production (Output/Time ) . 3 0 0 2 9 5 2 9 8 n 2 9 7 . 6 6
V. COCLUSION This Research Paper illustrates the application of the optimization technique (Taguchi Method) in Corrugation Packaging Industry to improve the Rate of Production. Following are the major outcomes of the present research: Taguchi Method of optimization result shows that Process Performance will depend upon the process parameters & their level. By optimizing control factors, production performance increase to its optimum level. Parameter design of the Taguchi method provides a simple, systematic, and efficient methodology for optimizing the process parameters. Taguchi Method of parameter design can be performed with number of experimentations and yields results.
[5] Patrick M. Burgman. Design of Experiments - the Taguchi Way. Manufacturing Engineering. May 1985, PP 44-46 [6] Yuin Wu and Dr. Willie Hobbs Moore. 1986. Quality Engineering Product and Process Optimization. Dearborn, Michigan. American Supplier Institute. [7] Taguchi G, Konishi S ,Taguchi Methods, orthogonal arrays and linear graphs, tools for quality American supplier institute, American Supplier Institute; 1987 [p. 8-35] [8] Genichi Taguchi. 1987. System of Experimental Design, UNIPUB, Kraus International Publications, New York. [9] Ronald L. Iman and W.J Conover. 1983. A Modern Approach to Statistics. John Wiley & Sons.
REFERENCES [1] Vrat,P., Sardana,G.D. and Sahay, B.S. (1998), ―Productivity Management: A Systems Approach‖, Narosa Publishing House, New Delhi, India. [2] Taguchi, Genichi. System of Experimental Design. New York: UNIPUB, Kraus International Publications, 1987.
[3] Roy, Ranjit K. A Primer on the Taguchi Method. Dearborn, Michigan: Society of Manufacturing Engineers, 1990.
[10] Yuin Wu. 1986. Orthogonal Arrays and Linear Graphs. Dearborn, Michigan. American Supplier Institute. [11] Burton Gunter. 1987. A Perspective on the Taguchi Methods. Quality Progress. [12] Lawrence P. Sullivan. June 1987. A Power of the Taguchi Methods. Quality Progress. [13] Philip J. Ross. 1988. Taguchi Techniques for Quality Engineering, McGraw Hill Book Company. New York, NY.
[4] Roy, Ranjit K. Design of Experiments Using the Taguchi Approach: 16 Steps to Product and Process Improvement. New York: John Wiley & Sons, 2001.
[14] W.T. Foster, Basic Taguchi design of experiments, National Association of Industrial Technology Conference, Pittsburgh, PA, 2000
Available online:http://internationaljournalofresearch.org/
P a g e | 545