Application of the equilibrium partitioning method to derive copper and ...
Recommend Documents
specific embedded processors from soft processor cores. The derivation process ... Modern embedded systems typically include a microprocessor or a digital signal ..... Wiley, 1995. [3]. 1999 Data Book, Xilinx Inc., San Jose, CA, 1999. [4].
Oct 10, 2012 - In introducing the concept, Linus Pauling defined ... electronegativity (chemical potential) was identified by ..... In general, the spectator elec-.
The QHull method provides a good performance for different movement patterns ... These peaks mean that these servers host a number of agents 30% higher ...
The loss fractions of uranium and plutonium into waste .... For LWR, to reduce the impact due to Np-237, the mass loadings of Pu-241 and Am-241 as well.
Abstract. For the design of the electrical insulation of an UHVDC. (Ultra High Voltage Direct Current) converter transformer the resistivity of the pressboard and ...
The information encoded by the two stable isotope systems in sulfate (d34SSO4 and .... chemical reactions involved in the sulfate reduction metab- olism, as well as the kinetic and equilibrium isotope effects .... equal to the difference between (d18
chemical affinity for the vapor and the brine, K will not change ...... Mavrogenes JA, Bodnar RJ, Anderson AJ, Rivers M, Sutton S (1993). Metal distributions in ...
Thomas J. Williams · Philip A. Candela · Philip M. Piccoli ... stants, K ! ,. , between the aqueous mixture. (aqm"quenched vapor#brine) and the silicate melt.
Sep 15, 1997 - the correct values for high wind regimes and the effects of ... mean value for the transfer coefficient does not necessarily .... peak, located at around 10 -⢠Hz (see Figure 1), which was ..... inertial dissipation equations the son
drothermal systems at 800°C and 1 kbar, and 850°C and 0.5 kbar. D ... 1981; Candela and Holland 1984; Candela 1989a; Kep- pler and Wyllie 1991; Cline and ...
an application which is embarrassingly parallel is usually not ..... grid computing systems and helped to develop sev- .... Main grid related systems timeline.
We developed a practical method to derive response functions which convert ... of incident light into cameras just within a limited dynamic range and at a.
diabetes mellitus; diet; epidemiologic methods; nutrition; pattern analysis; statistics ... effects. The second approach is exploratory; thus, dietary patterns.
May 1, 2006 - derive customer knowledge',Total Quality Management & Business Excellence ... support for the application of CSI study to derive customer ...
Jul 16, 2014 - designed, partitioned, and printed by a delta-type 3D printer, which is cheaper but ... This paper proposes a methodology for printing 3D objects.
Sep 27, 2012 - AND ECOTOXICITY TEST WITH Lepidium Sativum. Suherman1,*, Christiane Schmidt2, Marit Kolb2, Dieter Zachmann2 and Müfit Bahadir2.
3Lake Superior Research Institute, University of Wisconsin-Superior, 1800 Grand Avenue, Superior, WI. 54880, USA. Accepted 18 February 1996. Many of the ...
The authors acknowledge the financial support of the Chair partners: Alcan, Bell Canada, Cana- dian Pacific Railway, Cambior, Centre d'Expertise en Analyse ...
Indian Institute of Technology ... tor can gain one or more degrees-of-freedom at a gain-type ..... the fact that the points on the top platform a triangle whose.
Nov 18, 2014 - Eun Jung Seo, Lawrence Cho & Bruno. C. De Cooman ... website. The link must be accompanied by the following text: "The final publication is.
Feb 14, 2011 - impact of alcohol use on the mortality outcome of HIV/AIDS. Background .... can Republic, Congo, the Democratic Republic of the Congo ...
A novel set theory based method for deriving terminal reliability expressions of complex system configurations ... The reliability formula of a networked system is expressed as sum of disjoint products, where the product terms represent conjunctions
Nov 24, 1995 - For example, a vector command which opens the jaw from 3 to 6 .... due to physical sources must be accounted for before drawing conclusions about central ..... J. Requin (Eds.), Tutorials in Motor Behavior, pp. 607{621.
dephasing constant equal to zero, i.e., '1]3 = ° and '1]4 = 0. ... Pag (0) VS T for various '1]4 values at '1]1 = 1.0, '1]2 = 0.2, q = 5.0 ..... OETUNING (-EPSILON 11.
Application of the equilibrium partitioning method to derive copper and ...
Jan 1, 2000 - copper and zinc quality criteria for water and sediment: A South ..... Environmental and Conservation Council and National Health and. Medical ...
Application of the equilibrium partitioning method to derive copper and zinc quality criteria for water and sediment: A South African perspective V Wepener1*, JHJ van Vuren2 and HH du Preez2 1
Coastal Research Unit of Zululand, Department of Zoology, University of Zululand, P/Bag X1001, KwaDlangezwa 3886, South Africa 2 Department of Zoology, Rand Afrikaans University, PO Box 526, Auckland Park 2006, South Africa
Abstract This paper presents the use of an equilibrium partitioning (EP) method to derive generic quality criteria. Quality criteria for dissolved concentrations in water, total water concentrations and total sediment concentrations were derived from direct-effect data (aquatic toxicity data) and product standard data (human consumption standards). Both sets of data were obtained from physico-chemical and bioaccumulation field measurements in the Olifants and Selati Rivers, South African water quality guidelines and South African product standards. Emphasis is laid on the relation between effect and local physico-chemical data. Examples have been given for copper and zinc. Even with the acknowledged shortcomings of the EP methods the derived quality criteria for water and sediments were comparable to quality criteria from other countries.
Introduction Environmental risk assessment and water quality management are becoming increasingly important issues, particularly in view of the large numbers of contaminants entering the aquatic environment that are harmful to the functioning of an ecosystem (Van Leeuwen, 1990). The water quality in South African rivers is gradually deteriorating and the social and economical changes taking place affect the way in which water quality has to be managed. In South Africa water quality management is defined as the effort to control the physical, chemical and biological characteristics of water in such a way that the fitness-for-use, by recognised water users, is unimpaired (Moore et al., 1991). Prior to 1990 the Department of Water Affairs and Forestry (DWAF) controlled water quality and water pollution from point sources by requiring effluent to meet either uniform effluent standards (UES) or special effluent standards, which were set at technologically and economically feasible levels (Van der Merwe and Grobler, 1990). A new era in water quality management was entered with the promulgation of the new National Water Act (Act 36 of 1998). The central departure of the Act is the concept of resource use being dependent on resource protection. It also recognises that water quality should be extended to resource quality and include the quantity and quality of the water itself, the instream and riparian habitat (therefore the geomorphological structure of the system), the instream biota, and the associated riparian biota. The aquatic environment differs from the other recognised water users (domestic, agricultural, recreational and industrial) in that aquatic ecosystems are essential to maintain the biological integrity necessary to ensure the sustained fitness-for-use of the water resources not only for the aquatic environment itself but also for the other user sectors. It is not a simple task to set water quality management objectives for the aquatic environment, since aquatic ecosystems may differ considerably from each other and have unique properties dictated by the natural conditions prevailing in a * To whom all correspondence should be addressed. (0351) 93911; fax (0351) 93162; e-mail: [email protected] Received 30 October 1996; accepted in revised form 10 September 1999.
Available on website http://www.wrc.org.za
specific system. In addition change is an important characteristic of aquatic ecosystems since species composition, rate processes, as well as degree of complexity and many other community characteristics change over time (Chapman, 1991). It is for this reason that general water quality guidelines cannot be regarded as blanket values because they may be over- or under-protective (Moore et al., 1991). Water quality standards or guidelines must therefore be aimed at taking regional differences into account. At present water quality guidelines are based on the overly simplistic and entrenched philosophy that emphasises only dissolved chemicals and the water column. Very little attention has been paid to developing criteria for sediment bound chemicals. In environmental chemistry the term equilibrium partitioning refers to the relationship between the concentration of a substance in the water column and the concentration in the non-water phase, which is in contact with the water. The equilibrium partitioning (EP) method was found to be a relatively simple and applicative method to derive quality criteria (Shea, 1988). The EP method models the co-occurrence of chemicals in water and sediments as a state of thermodynamic equilibrium, which can be regarded as a sorption equilibrium. If a direct relationship can be formulated for a chemical, it is possible to estimate quality criteria for sediments from the quality criteria of water, which in turn, are derived from toxicity tests (Van der Kooij et al., 1991). The EP approach requires four major assumptions: •
•
• •
Partitioning of chemicals (i.e. metal concentrations) between the overlying water and interstitial water is stable at equilibrium. The sensitivities of benthic species and species tested to derive water quality criteria, predominantly water column species, are similar. The levels of protection afforded by water quality criteria are appropriate for benthic organisms. Exposures are similar regardless of feeding type or habitat (USEPA, 1993).
It is acknowledged that the EP method is simplistic since it does not make provision for the route of exposure or environmental factors
ISSN 0378-4738 = Water SA Vol. 26 No. 1 January 2000
97
TABLE 1 COMPARISON OF DISSOLVED COPPER AND ZINC CONCENTRATIONS IN THE OLIFANTS RIVER AND SELATI RIVER WITH OTHER RIVERS. CONCENTRATIONS ARE PRESENTED AS µ g·l-1 River
Copper
Zinc
18.9 16.4 16.3 9.6-15.4 11.5-13.4 25.21 14.72
101.4 74.2 35.8 0.66-15.4 0.4-0.79 86.5 1.98
Amazon River
15.42
0.2-2.5
Orinoco River Rhône River
12.16 14.5-32.9
1.32 12.1-69.3
Olifants River (Balule) Olifants River (Mamba weir) Selati River Huanghe River (China) Changjiang Estuary (China) St Lawrence River Mississippi River
References
This study This study This study Zhang and Huang (1993) Edmond et al. (1985) Yeats and Bewers (1982) Trefry et al. (1986) Shiller and Boyle (1987) Boyle et al. (1982) Shiller and Boyle (1985) Shiller and Boyle (1985) Unpublished data reported by Zhang and Huang (1993)
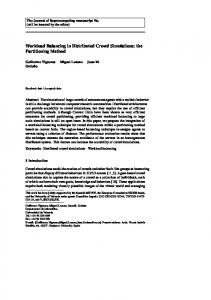
Figure 1 Map indicating sampling stations where water, sediment and axial muscle samples were collected. Sampling Site A is situated near Balule Rest Camp, Site B below Mamba Weir and Site C in the Selati River.
98
ISSN 0378-4738 = Water SA Vol. 26 No. 1 January 2000
Available on website http://www.wrc.org.za
which affect the speciation of metals. However, the application of the technique has been proven to be realistic from a toxicological point of view (Connell et al. 1988; Jansen et al. 1997). The concentrations of copper and zinc in the water of the Olifants and Selati Rivers were comparable to and in the same order of magnitude as concentrations in the Mississippi, St Lawrence and Rhône Rivers (Table 1). These are all large North-American and European rivers and the high dissolved trace metal concentrations are considered in close relation to anthropogenic contaminant input (Trefry et al., 1986). The water quality of the Olifants River, in the Kruger National Park, is influenced by siltation (due to injudicious agriculture practices) and mining effluent (Venter and Deacon, 1992). It is well documented that metals from mining effluents adsorb to sediments and suspended particles in the aquatic environment (Förstner and Wittman, 1979). Since extensive data on metal concentrations in water phases, sediment, and fish were available for the Olifants River (Wepener 1997) it provided the opportunity to apply the EP technique in deriving quality criteria for water and sediment. This paper investigates the use of the EP method to derive quality criteria for two metals, i.e. copper and zinc using data obtained from the Olifants River. Criteria for the water (dissolved) phase, total concentration in the water (dissolved and particulate) and sediment were developed based on aquatic toxicity tests and product standards for the two metals. Emphasis was placed on the relationship between toxic effect data and physio-chemical data in the development of the quality criteria.
Materials and methods
Labeo rosae (red-nosed mudfish), Barbus marequensis (largescale yellowfish), Clarias gariepinus (African sharptooth catfish) and Hydrocynus vittatus (tigerfish - only at Station A). The large numbers of fish species sampled provided samples which are representative of different trophic positions in the ecosystem. The rational behind the frequent sampling protocol over a two-year period was to provide bioaccumulation data during the different environmental conditions experienced during different seasons and flow conditions in the Olifants and Selati Rivers. The tissue samples were prepared and analysed with a Varian AA Spectre-10 atomic absorption spectrometer. Du Preez and Steyn (1992) present a detailed description of the methods and techniques used in the preparation of tissue samples. Total copper and zinc concentrations in the axial muscle tissue were determined by standardised atomic absorption spectrophotometrical (AAS) techniques. Water samples were also collected from these sampling stations and copper and zinc concentrations were measured. The BCF was calculated as the ratio of the chemical concentration in the muscle tissue to the total concentration in the surrounding water column (Hawker and Connell, 1991). BCF
=
Corg/Cw
where: BCF Corg Cw
= = =
bioconcentration factor (l·kg-1) content of chemical in organism (µg·kg-1) concentration of chemical in the water (µg·l-1)
(1)
Solids-water partition coefficient The determination of quality criteria for copper and zinc was carried out by employing two forms of data sets i.e. toxic effect data and product standards. Toxic effect data The toxic effect data used for setting the quality criteria were based on the South African water quality guidelines for the protection of aquatic ecosystems (DWAF, 1996). The development of the guidelines was derived from the results of toxicity tests, which provided a degree of environmental realism and applicability (Roux et al., 1996). For the purpose of this assessment the chronic effect values (CEV) for copper and zinc were selected since they provide protection to most aquatic organisms even during chronic exposure. Product standards For many chemicals including copper and zinc, maximum allowable concentrations in foodstuffs for human consumption (e.g. in fish) are available (Verheul, 1992). These critical concentrations in organisms or tissues are translated into critical concentrations in water by means of a bioconcentration factor (BCF). The rational behind using product standard concentrations is based on the assumption that concentrations, which are deemed acceptable for human consumptive purposes, will also provide protection to other aquatic organisms. Axial muscle samples were collected bimonthly from February 1990 to February 1992 from different fish species at two sampling stations in the Olifants River (Fig. 1, Stations A and B) and one station in the Selati River (Fig. 1, Station C). Tissue samples were collected from Oreochromis mossambicus (Mozambique tilapia),
The BCF’s and toxic effect data were translated into critical concentrations in solids by using a solids-water partition coefficient. Solids-water coefficients (Ksw) were derived from field measurements of copper and zinc concentrations in water before and after filtration (Van der Kooij et al., 1991). Duplicate water samples and sediment samples were collected from the aforementioned sampling stations. A known volume (200 ml) of the first set of water samples was filtered through 0.45 µm filter paper (Singh et al., 1988). The filtrate was retained and 50 ml was transferred to an Erlenmeyer flask and acidified with 5 ml HNO3 (analytical grade). The second set of unfiltered water samples were transferred to a 100 ml Erlenmeyer flask and acidified in the same manner as the filtered samples. The water samples were evaporated on a hotplate, reducing it to 2 ml. The samples were transferred to a 50 ml volumetric flask and carefully made up with doubly-distilled water. Sediment samples were collected from the same stations as water and tissue samples. Total metal extraction of 1 g (dry mass) sediment was performed with 55% HNO3 and 70% HClO4, and copper and zinc concentrations were determined by AAS. According to Aiking and Bruggeman (1987) the concentrations of micropollutants in sediments differ systematically from concentrations in suspended solids in the water column above the sediments. The ratio of concentrations in the suspended matter to sediment (r) was obtained by calculating the concentration ratios of metal concentrations in the suspended phase (the difference between the total metal concentrations and the dissolved metal concentrations) and sediments from the Olifants and Selati Rivers as presented in Table 2. The dimensionless ratio (r) was substituted in Eqs. (5) and (8). The Ksw values were calculated with the following equation: Ksw = (Ctotal– Cwater) / (SM x Cwater)
Available on website http://www.wrc.org.za
ISSN 0378-4738 = Water SA Vol. 26 No. 1 January 2000
(2)
99
TABLE 2 MEAN CONCENTRATIONS OF COPPER AND ZINC MEASURED IN WATER AND SEDIMENT SAMPLES AND THE CALCULATED SOLIDS-WATER PARTITIONING COEFFICIENT FROM SELECTED SITES IN THE OLIFANTS AND SELATI RIVERS FROM FEBRUARY 1990 TO FEBRUARY 1992 (DATA AFTER SEYMORE ET AL., 1994 AND WEPENER, 1997) Copper
Total concentration in water (µg·l-1) Dissolved concentration in water (µg·l-1) Total concentration in sediments (mg·kg-1) Ksw (l·g-1)
Mamba weir
Selati River
58.1
34.8
72.9
18.9
16.4
16.3
25.3 74.07
24.7 47.91
138.8 124.01
where: Ctotal = total concentration in the water before filtration (µg·l-1) Cwater = concentration in the water phase after filtration (µg·l-1) SM = concentration of suspended matter (g·l-1) The suspended matter concentration used in Eq. (2) was taken as the median value recorded for suspended matter concentrations measured monthly at Mamba Weir in the Olifants River during 1992 (Bauermann et al., 1995). The following equations for determining quality criteria were taken from the equations proposed by Van der Kooij et al. (1991):
Toxic effect data The South African water quality quideline value (CEV) was used as quality criterion for the chemical in the dissolved phase (Cr1w): Cr1w = CEV
(3)
The CEV-related criterion for total metal concentration (Cr1tot) in water was calculated as: Cr1tot = Cr1w x (1+Ksw x SM)
(4)
Finally the CEV-related criterion for metals in the sediment (Cr1sed) was calculated as: Cr1sed = (Ksw x Cr1w) / r
(5)
The r-value was taken as the concentration ratio of suspended matter to sediment and is presented as a dimensionless value.
Product standard data Starting from a product standard the criterion for dissolved metals (Cr2w) can be calculated by using the equation: Cr2w = Corg / BCF
(6)
The product-related criterion for total metals in water (Cr2tot) was calculated as:
Balule
Mamba weir
Selati River
Toxic effect and product standard values
The water quality guidelines (CEV values) for copper and zinc are 0.8 and 2 µg·l-1 respec101.4 74.2 35.8 tively (DWAF, 1996). The product standard for maximum 48.6 33.7 33.7 allowable concentrations of 134.72 127.07 541.70 metals in fish tissue for consumption in South Africa is reported as 30 µg·kg-1 and 40 µg·kg-1 for copper and zinc respectively (Verheul, 1992). The copper and zinc BCFs for fish species at the different sampling stations are presented in Table 3. It was noticeable that the copper BCFs in substrate feeding fish (i.e. L. rosae and O. mossambicus) and to a lesser extent C. gariepinus, were much higher (>200) than the BCFs in B. marequensis and H. vittatus. The zinc BCFs in C. gariepinus and B. marequensis were higher than those reported for the other species. A comparison with other results from systems in South Africa revealed that zinc BCFs were similar to those reported in fish tissue from the upper Olifants River catchment, Crocodile Rivers and the Elsburg and Natalspruit wetland systems. However, the BCFs from the Southern African systems were far less than BCFs reported for fish (C. commersoni) from metal-polluted lakes in Canada. Copper BCFs from the Olifants River system (including Loskop Dam) were higher than values recorded in fish from the industrial and sewage polluted Elsburg and Natalspruit wetland. They were, however, similar to BCFs recorded in fish tissue from metal-contaminated lakes in Canada (Miller et al., 1992). The BCFs for biota reported in the literature for copper and zinc display a wide range from