Materials Science, Vol. 48, No. 6, May, 2013 (Ukrainian Original Vol. 48, No. 6, November–December, 2012)
APPLICATION OF THE METHOD OF DIGITAL IMAGE CORRELATION TO THE CONSTRUCTION OF STRESS–STRAIN DIAGRAMS Yu. V. Mol’kov 1 We plot the conditional and true stress-strain diagrams for 65G steel according to the standard procedure and by the method of digital image correlation. It is shown that the accumulated results are in good agreement. It is established that the local strains measured by the method of digital image correlation on small measurement bases can be much higher than the ultimate true elongation of the material. We also propose a criterion for choosing the optimal base of strain measurements from the viewpoint of construction of stress-strain diagrams. Keywords: stress-strain diagram, carbon steel, true stresses and elongations, digital image correlation, strain distribution, measurement base, local strains.
Stress-strain diagrams [1–3] are constructed for the evaluation of the mechanical characteristics of materials. These are the experimental dependences of the force parameters (the force of loading of the specimen P and conditional ! or true S stresses) on the deformation characteristics of the specimen (absolute !l or relative ! elongation, relative narrowing ! , true elongation e ). The stress-strain diagrams on the S – ! or
S – e coordinates are called true because the parameter S takes into account the changes in the cross section of the specimen under loading: S = P/Fi , where Fi is the variable cross-sectional area of the specimen at the site of formation of the “neck.” Clearly, these diagrams give the most complete description of the behavior of plastic materials deformation beyond the yield point. However, their construction is connected with certain technical difficulties, in particular, with the unpredictability of the site of formation of the neck for standard specimens with constant cross sections of their working parts. To relative narrowing is usually measured by mounting several double-cantilever displacement strain gauges along the specimen with certain steps. In this case, we hope that the neck will form at the site of mounting of one of these gauges. It is also possible to use a single gauge and remount it manually after the appearance of a visible neck [4]. One can also use optical instruments or videorecording but, in this case, a long period of time is required for data processing. At present, the method of digital image correlation (DIC) is extensively used for measuring displacements and strains [5–8]. It is based on the processing of series of digital images of the surfaces of deformed bodies (after their appropriate preparation) obtained under loading with an aim to trace the displacements of a set of points of the surface with subsequent evaluation of the corresponding strains. This method proves to be highly informative because it enables one to get the fields of displacements and strains over the entire specimen surface by analogy with the use of finite-element models. For its realization, one can use either commercial software, in particular, the ARAMIS software of the GOM Company (Germany) and the VIC-2D software of the “Correlated Solutions” Company (USA) [9] or the noncommercial MOIRE software developed at the Catholic University of America [10, 11]. In our investigations, we used the last of these possibilities.
1
Karpenko Physicomechanical Institute, Ukrainian National Academy of Sciences, Lviv, Ukraine; e-mail:
[email protected].
Translated from Fizyko-Khimichna Mekhanika Materialiv, Vol. 48, No. 6, pp. 121–125, November–December, 2012. Original article submitted October 20, 2012. 832
1068-820X/13/4806–0832
© 2013
Springer Science+Business Media New York
APPLICATION OF THE METHOD OF DIGITAL IMAGE CORRELATION TO THE CONSTRUCTION OF STRESS–STRAIN DIAGRAMS
833
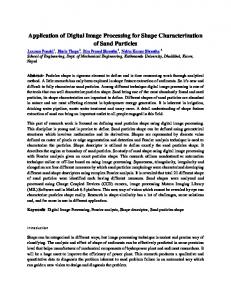
Fig. 1. Specimen for mechanical tests with a speckle picture on its surface made to apply the method of digital image correlation (a part of the surface is magnified).
The DIC procedure is used to find the elongation of the specimen, its relative narrowing in the neck, and the level of local strains at the center of the neck. These data are then used to plot the stress-strain diagrams and obtain the distribution of local strains over the entire specimen surface. Our aim is to construct the conditional and true stress-strain diagrams for a material by using the DIC method, compare them with the diagrams obtained by using the traditional approach, and substantiate the choice of the optimal base of strain measurements by the DIC method. Specimens, Equipment, and Experimental Procedure We used standard fivefold plane specimens [5] with rectangular cross sections 5 × 2 mm in size made of 65G sheet steel in the as-delivered state with rolling fibers directed along the specimen (Fig. 1). According to the recommendations of the developer of the software package [9–11], we used an elastic aerosol paint to create a unique isotropic contrast speckle picture on the specimen surface (black dots against the white background), required for the correct application of the DIC method. The specimens were stretched up to fracture in an FP-100 mechanical tensile-testing machine with a velocity of the motion of a moving crossarm of 2 mm/min under the laboratory conditions. The level of loading was recorded by a dynamometer of the machine and the elongation of working part of the specimen was measured by a displacement strain gauge. The signals from the dynamometer and the gauge were recorded in the computer memory with the help of an analog-to-digital converter and the corresponding software. The images intended for processing by the DIC method were obtained with the help of an Olympus E-300 digital reflex camera rigidly mounted on the immobile crossarm of the machine. The resolution of the images was equal to 2MP (1600 × 1200). They were stored in the .TIFF format. In the course of experiments, we made series of photographs of the specimen surface in which the first frame corresponded to the onset of loading and the frequency of making photos (1 fps) was equal to the frequency of recording of the loading force by the analog-to-digital converter. Hence, we managed to determine (with a sufficiently high accuracy) the force acting at the time of making each frame. On the whole, for the period of loading of the specimen, we made about 350 frames, which enabled us to construct sufficiently smooth curves. Results and Discussion Converting the loading force P and the absolute elongation of the specimen !l into the conditional stresses σ and relative elongation ! , we plotted the classical conditional ! – ! stress-strain diagram [1, 2] (Fig. 2, curve 1). The software for the realization of the DIC method contains the option called “virtual extensometer,” which enables one to perform direct measurements of the relative strains on the base between any two points as in the case of a double-cantilever displacement gauge (Fig. 3а).
YU. V. MOL’KOV
834
Fig. 2. Stress-strain diagrams of 65G steel: (1) conditional diagram ( ! – ! ), (2) conditional diagram plotted according to the data of DIC, (3) true diagram ( S – e ), (4) local diagram S – ! yy at the neck of the specimen according to the data of DIC on a base of 15pixels (0.660 mm).
By using the levels of strains measured by the virtual extensometer on the base of the working zone of the specimen, i.e., in fact, its relative elongation ! , we plotted one more conditional stress-strain diagram (Fig. 2, curve 2), which practically coincides with the diagram obtained according to the data of the double-cantilever displacement gauge (curve 1). A small discrepancy at the time of fracture (not more than 0.010–0.015 strain units) is probably explained by the nonlinearity of the displacement gauge. To construct true stress-strain diagrams, it is necessary to know the intermediate cross-sectional area of the specimen at the site of formation of the neck. For this purpose, the data of DIC were used to find the intermediate values of displacements of two points located on the opposite edges of the investigated face of the specimen in the neck plane (Fig. 3b). As a result, we obtained the intermediate values of the specimen width bi . Further, we assume that the deformation of the specimen is homogeneous in all directions, its thickness ai is proportional to its width bi , and the shape of its cross section is rectangular in all stages of deformation. This enables us to find the intermediate values of area Fi = ai bi and, hence, of the relative narrowing ! i = (F0 ! Fi )/F0 , where F0 is the initial cross-sectional area of the specimen. The corresponding true stresses in the plane of the neck Si = Pi /Fi and the true elongation ei = ln (1/(1 ! " i )) . By using the sets of values of the quantities Si and ei , we plot the true stress-strain diagram
(Fig. 2, curve 3). For the DIC method, it is customary to introduce the concept of a step of measurements, i.e., the distance between any two points of a digital image whose displacements are traced by the software. This step, in fact, plays the role of a base of strain measurements. The minimum step is equal 1 pixel of the processed digital image. In other words, the higher the resolution of the digital camera and the optical magnification of its objective, the smaller can be the base of strain measurements. In this case, the base is equal to 1 рixel and, hence, the minimum base of strain measurements constitutes 0.044 mm.
APPLICATION OF THE METHOD OF DIGITAL IMAGE CORRELATION TO THE CONSTRUCTION OF STRESS–STRAIN DIAGRAMS
835
Fig. 3. Measurements of strains and displacements by the DIC method: (a) distribution of local strains ! yy [for a measurement base of
5 рixels (0.220 mm)] on the surface of the working part of the specimen and measurements of the relative elongation by the virtual extensometer (marked by the arrow); (b) measurements of the changes in the specimen width according to the displacements of points (blank squares); (c) point of measurements of the local strains in the neck of the specimen (blank square; see Fig. 2) and the line of determination of the strain distribution (see Fig. 4).
In Fig. 4, we plot the local stress–strain diagrams measured at the point of the specimen neck where the level of strains is maximum at the time of fracture (Fig. 3с). Here, on the ordinate, we plot the predominant component of strains ! yy (i.e., in the direction of action of the applied force). We use the following measurement bases
(steps): 2, 5, 10, 12, and 15 рixels corresponding to 0.088, 0.220, 0.440, 0.528, and 0.660 mm, respectively. Clearly, the local strain depends on the base of its measurement. The values measured on different bases strongly differ after the point corresponding to the ultimate strength ! u in the conditional stress-strain diagram,
i.e., after the onset of formation of the neck and localization of strains at this site. Moreover, this difference is maximum at the time of fracture of the specimen. In particular, for sufficiently small bases, the critical strain ! yyc at the time of fracture can be much higher than the true critical elongation ec (to say nothing about the
relative elongation ! ). However, for sufficiently large bases, the critical values of these quantities coincide (see Fig. 2, curves 3 and 4). Therefore, in plotting the stress-strain diagrams, one must choose a measurement base for which the relation ! yyc = ec is satisfied.
It is reasonable to use diagrams of this sort in order to rank materials according to their mechanical characteristics, to estimate the influence of thermal treatment on the parameters of a given material, and to determine stresses for known strains or find the work spent for the fracture of the material.
836
YU. V. MOL’KOV
Fig. 4. Diagrams of local strains ( S – ! yy ) at the neck of the specimen obtained by the DIC method for different measurement bases: (1) 2 рixels (0.088 mm), (2) 5 рixels (0.220 mm), (3) 10 рixels (0.440 mm), (4) 12 рixels (0.528 mm), (5) 15 рixels (0.660 mm).
Fig. 5. Curves of the distribution of local strains ! yy in the plane of the neck of a specimen for different measurement bases: (1) 2 рixels (0.088 mm), (2) 5 рixels (0.220 mm), (3) 10 рixels (0.440 mm), (4) 12 рixels (0.528 mm), (5) 15 рixels (0.660 mm).
In Fig. 5, we illustrate the distribution of local strains over the specimen width in the plane of the neck (see Fig. 3c) at the time of fracture for different measurement bases. It is easy to see that small bases (curves 1 and 2) are characterized by inhomogeneous deformation with maximum at a certain point, where the fracture processes are originated. For larger bases, in particular, for a base of 15 рixels (0.66 mm), the relation presented above is satisfied, and we do not reveal any inhomogeneity of this kind, i.e., the measured strains are averaged. To estimate the load-carrying capacity of structural elements, it is important to analyze the distribution of strains near the defects (cracks) and other stress concentrators. In this case, it is not reasonable to use large
APPLICATION OF THE METHOD OF DIGITAL IMAGE CORRELATION TO THE CONSTRUCTION OF STRESS–STRAIN DIAGRAMS
837
measurement bases because, due to the averaging of strains, it is impossible to establish the domains of their localization on the surfaces of structural elements. Thus, one should use the minimum bases of strain measurements guaranteed by the optical system of making images. CONCLUSIONS We construct the conditional and true stress-strain diagrams for 65G steel by using the data obtained by the method of digital image correlation. These diagrams practically coincide with the results of application of the classical approach. We plotted the diagrams of local strains at the center of the specimen neck for different measurement bases. It is shown that the local strain measured on small bases may exceed the true elongation e . Finally, we propose a criterion of choosing the optimal base of strain measurements by the DIC method for which the critical local strain coincides with the true critical elongation ec . REFERENCES 1. Ya. B. Fridman, Mechanical Properties of Metals [in Russian], Part 1: Deformation and Fracture, Mashinostroenie, Moscow (1974). 2. M. L. Bernshtein and V. A. Zaimovskii, Structure and Mechanical Properties of Metals [in Russian], Metallurgiya, Moscow 1970). 3. GOST 1497-84/ST SÉV 471-77. Metals. Methods of Tensile Tests [in Russian], Izd. Standartov, Moscow (1985). 4. G. S. Pisarenko and V. A. Strizhalo, Experimental Methods in the Mechanics of Deformed Solid Bodies [in Russian], Naukova Dumka, Kiev (1986). 5. GOST 11701-84/ST SÉV 471-77. Metals. Methods for Tensile Testing of Light Sheets and Bands [in Russian], Izd. Standartov, Moscow (1985). 6. T. Chu, W. Ranson, and M. Sutton, “Applications of digital-image-correlation techniques to experimental mechanics,” Exper. Mech., 25, No. 3, 232–244 (1985). 7. M. A. Sutton, M. Cheng, W. H Peters, et al., “Application of an optimized digital correlation method to planar deformation analysis,” Image Vision Comput., 4, No. 3, 143–150 (1986). 8. B. Pan, K. M. Qian, H. M. Xie, and A. Asundi, “Two-dimensional digital image correlation for the in-plane displacements and strain measurements: a survey,” Measurement Sci. & Technol., 20, No. 6, 062001–062007 (2009). 9. VIC-2D Image Analysis Software, Correlated Solutions, Inc., West Columbia, SC 29169. 10. Z. Wang, “On the accuracy and speed enhancement of digital image correlation technique,” J. Exper. Mech., 26, No. 5, 632–638 (2011). 11. L. Luu, Z. Wang, M. Vo, et al., “Accuracy enhancement of digital image correlation with B-spline interpolation,” Optics Lett., 36, No. 16, 3070–3072 (2011).