SAS Global Forum 2012
Posters
Paper 200-2012
Application of Time Series Clustering using SAS® Enterprise MinerTM for a Retail Chain, SAS® Global Forum 2012 Karthik Nakkeeran Satish Garla Goutam Chakraborty Oklahoma State University, Stillwater, Oklahoma. ABSTRACT Much of the data that are generated in the operational side of a business have a built-in time dimension. One of the challenges of doing data mining using such time-series data is the complexity of handling a large number of time series. Time series clustering provides a way to reduce the complexity by categorizing large number of time series into a smaller subset such that series within each subset are relatively homogenous but series between subsets are heterogeneous. ®
SAS has recently introduced new nodes for finding similarities between the time series and to forecast their future trajectories. In this paper, we demonstrate clustering of store-level revenue over time and how profiling of such clusters generate additional business insights.
INTRODUCTION Over the course of operation, business firms collect large volume of data across many time periods. Such time stamped data could be about customer purchases, supplier‟s delivery, stock levels or the inventory, financial transactions in a bank, or any organization‟s activity that is measured and captured over time periods. The data recorded over a period of time with specific interval is called transaction data. A time series is a sequence of data points, measured at a successive time space at uniform interval. Business analysts and companies have acknowledged the essence of valuable information that could be extracted from the time series data. The processing and extraction of information from the transaction data have always been a challenge for the statisticians and business analysts. With the latest version of SAS Enterprise Miner 7.1 which comes in with SAS 9.3 package; SAS have introduced tools to work on the time series data [1]. The techniques such as time series similarity and exponential smoothing have enhanced the time series data analysis so that we can easily find similarities among time series across the time dimension [2] and also be able to forecast them [3]. Though we have some information that SAS is already working on more functionalities to focus on clustering of times series data [1], at present the time series node in Enterprise Miner have several limitations, one of which is the lack of being able to append cluster membership to each time series. In this paper we demonstrate how to apply cluster membership to a retail store‟s time series data and then further investigate those clustered time series to generate business insights.
BUSINESS CASE Store ABC is a popular chain of retail stores with hundreds of stores located all over the United States. We cannot disclose the name of the actual retail store for confidentiality reasons. The following are the key business issues for the Store ABC. 1. How can they use the store-level revenue data to identify groups of similar stores in terms of sales performances over time? 2. How can they better understand the grouped stores based on variables other than the revenue (such as type of services provided by the stores, geographical location, etc.)? The results reported in this paper are based on masked revenue numbers (with appropriate transformations on the original store-level revenue numbers such that the time-series patterns are retained in the masked data) due to confidentiality reasons.
DATA Two SAS datasets were prepared for this analysis. The first data set labeled „TimeseriesDataset‟ has three variables. The revenue numbers were extracted for a time period of three years, from 2006 to 2008 and on a monthly basis for
1
SAS Global Forum 2012
Posters
Application of Time Series Clustering Using SAS® Enterprise MinerTM for a Retail Chain, SAS® Global Forum 2012, continued
35 stores (drawn at random from the several hundred stores of retail chain). Therefore, we start with 1,260 observations: 35 (stores) * 3 (years) * 12 (number of months in a year). These 35 stores are located across 17 states in the United States. Table1 provides a description of each variable. Variable
Description
StoreNumber
Nominal variable which uniquely identifies 35 stores.
Month_Year
TimeID denotes a time period. Interval variable which gives the masked revenue generated in each store.
Revenue
Table1. Variable Descriptions in TimeseriesDataset To perform a time series analysis presence of three variable types are critical: Cross ID, Time ID and Target. A Cross ID variable represents a cross-sectional dimension to the time series data. Time ID defines a single numeric interval time ID variable. Target is the variable that will be analyzed via time series methods. The second SAS dataset is labeled „Descriptors‟ and it has twelve variables. Each of the variables captures different services provided by each store and the state where each store located. There are 35 records in this data set corresponding to each store. To profile the time series clusters, this dataset will need to be merged with the clustered time series data. Table2 provides a brief description of the variables in this dataset. Variable
Description
StoreNumber
Nominal variable which uniquely identifies 35 stores. Nominal variable takes one of the following 17 values; (AR, AZ, CA, CO, GA, IL, KS, KY, LA, MO, NM, OK, SC, TN, TX, VA or WY).
State Services1-10
Each of these 10 binary variables is the different types of service provided by the stores. A value of 1 (implies that the store provides the service) and 0 (otherwise).
Table2. Variable Descriptions in the data Descriptors Figure1 below shows the complete diagram that derives cluster membership for the retail stores transaction data then merge the cluster memberships with the descriptors data and profile those clusters using the segment profile node. All the node settings were set to demonstrate the best possible performance with the given datasets. These settings are described in the appropriate places in this paper.
Figure1. Diagram from Enterprise Miner 7.1
2
SAS Global Forum 2012
Posters
Application of Time Series Clustering Using SAS® Enterprise MinerTM for a Retail Chain, SAS® Global Forum 2012, continued
DATA PREPARATION The Transpose option (Figure 2) of the TS Data Preparation node is modified to enable transposing of the input dataset by TSID.
Figure2. Transpose Option of TS Data Preparation Node This modification results in a dataset that has 35 time series variables, one for each distinct value of the Cross ID‟s (i.e., 35 stores) and a variable of Time ID (Month_Year). A glimpse of the data transition which happened in the transpose is shown below (Figure3).
Figure3. Data transition which happens in the TS Data Preparation Node SAS Enterprise Miner 7.1 does not have TS Viewer node (as mentioned in the Reference [1]) which is used to view the generated time series in one single graphical window. In place of the TS Viewer node, we use the Graph Explorer node with all the Revenue variable from Revenue_1 to Revenue_35 set to role „Y‟ and Month_Year variable set to „X‟ role.
Figure4. Time series graph generate for Revenue via Graph Node This graph on time series is useful in figuring out any sharp increase or decrease in the values; such as the one spike that is obvious in above graph (Figure4).
CLUSTER ANALYSIS We used following options in the SAS Enterprise Miner, TS Similarity Node (Figure5). These are the default settings available for this node and gave us the best results with the dataset we used for the analysis.
3
SAS Global Forum 2012
Posters
Application of Time Series Clustering Using SAS® Enterprise MinerTM for a Retail Chain, SAS® Global Forum 2012, continued
Figure5. TS Similarity Node settings This resulted in a two-cluster solution as shown below (Figure6):
Figure6. Cluster constellation plot and cluster dendrogram generated in TS Similarity Node TS Similarity node generates cluster constellation plot and cluster dendrogram as shown in the Figure6. These are useful in identifying the number of clusters. For the retail time series data, we see two distinct clusters by choosing an appropriate cut-off (such as right before a sudden jump) in the semi-partial R-squared value. The exported data from TS Similarity node unfortunately does not contain cluster membership details for each store. This makes it difficult to use the clusters for further profiling. However there is an option to export the data set as a distance matrix. We do this by selecting the Distance Matrix property in the property panel, Figure 7.
Figure7. Distance Matric Option, TS Similarity Node Once we have the distance matrix data, we can further apply SAS code and generate the cluster membership to take it forward for segment profiling. We used PROC CLUSTER and PROC TREE to perform cluster analysis. From the dendrogram and constellation graph outputs (Figure6) from TS Similarity node, we clearly see a two cluster solution for this analysis. Therefore, we used NCL equals to two in the TREE procedure options. The result obtained from the SAS Code node is identical to the clusters identified from the TS Similarity node (compare Figure6 with Figure8). If the analyst feels a four cluster solution would make more business sense then we can set the NCL option as four in the TREE procedure. Altogether this brings in more flexibility to the analysts to experiment with various combinations when we implement with SAS codes. SAS procedures that were used for clustering is included in the appendix.
4
SAS Global Forum 2012
Posters
Application of Time Series Clustering Using SAS® Enterprise MinerTM for a Retail Chain, SAS® Global Forum 2012, continued
Figure8. Cluster Dendrogram generated using SAS codes For segment profiling we cannot use a transaction data set. The role of the data set needs to be „Train‟ type with a segment variable. Therefore in SAS Code node, the imported „Transaction‟ type dataset is exported out as a „Train‟ dataset. A Merge node is then used to merge the exported dataset from the SAS code node with the Descriptors dataset. In this merge operation StoreNumber will act as the ID variable.
SEGMENTATION Because there are only 35 members to be split up between clusters, before we run the Segment Profile Node the Minimum Worth option under Input Variables property is modified to a smaller value of „0.001‟ (the default is 0.01). The result shows a two cluster solution with Cluster1 having thirty members and Cluster2 having five members. This is shown in the below „Segment Size: CLUSTER‟ window (Figure9).
Figure9. Segment Size: CLUSTER’ window generated by Segment Profile Node
5
SAS Global Forum 2012
Posters
Application of Time Series Clustering Using SAS® Enterprise MinerTM for a Retail Chain, SAS® Global Forum 2012, continued
Cluster 1 Details: There are six important predictor variables for Segment1 as shown in the „Variable Worth: CLUSTER‟ window Service8, Service9, Service10, Service7, Service2 and State. The distribution for the variables: Service8, Service9, Service10, Service7 and Service2 are right-sided and above the overall sample average (Figure10).
Figure10. Distribution of Important variable at Cluster1 The average revenue of stores in segment 1 is $17,446.19. Cluster member 1 is the largest cluster with thirty members; therefore most of the states are likely to be represented in this segment. But, it is interesting to find that the stores from the state of Kansas are excluded out of this cluster. Figure11 shows the distribution of Segment stores across 17 states.
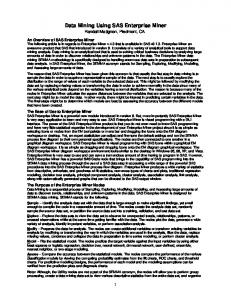
Figure11. Distribution of Cluster1 stores across the 17 states Cluster 2 Details: There are six important predictor variables for Segment2 as shown in the „Variable Worth: CLUSTER‟ window Service8, Service9, Service10, Service7, Service2 and State. The distribution for the variables: Service8, Service9, Service10, Service7 and Service2 are shifted to the left suggesting that these stores tend to provide less numbers of such services than the overall population of stores (Figure12).
6
SAS Global Forum 2012
Posters
Application of Time Series Clustering Using SAS® Enterprise MinerTM for a Retail Chain, SAS® Global Forum 2012, continued
Figure12. Distribution of Important variable at Cluster2 The average revenue of stores in Cluster2 is $ 9,443.80. Cluster member 2 is a small cluster with only five members; hence, it is likely that many of the states will be missing here. Stores from the following states are completely excluded from this cluster: SC, TN, TX, VA, WY, AR, CA, CO, GA, IL, KY, LA and MO. Figure13 explains the distribution of Cluster2 stores across 17 states.
Figure13. Distribution of Cluster2 stores across the four states The following Table3 is the summary of the cluster segmentation result. Segment
Segment Size
Service8
Service9
Service10
Service7
Service2
State
Average Revenue
85.7
73.33%
83.33%
46.67%
53.33%
26.67%
AZ, OK, MN, SC, TN, TX, VA, WY, AR, CA, CO, GA, IL, KY, LA, MO
$17,446.19
14.3
20%
40%
0
20%
0
KS, AZ, OK, NM
$9,443.80
Frequency
Percentage
Cluster1
30
Cluster2
5
Table3. Summary of the cluster segmentation results From the results it is evident that Cluster1 stores are doing well in revenue as these stores provide Service8, Service9, Service10, Service7 and Service2 in a higher percentage compared to Cluster2 stores. From the analysis the conclusion would be that the services provided at the stores are the key discriminators between each cluster of stores. The geographical location of the stores seems to be less important in predicting the cluster grouping (it is the sixth important variable with an important worth of just 0.006803).
CONCLUSION From this analysis about the retail store time series data, we could extract some valuable information about how stores are performing with regards to overall revenue as well as different services performed. SAS Enterprise Miner 7.1 has excellent capabilities in doing time series clustering and cluster profiling at the same time with a little bit of coding work as demonstrated in this paper. We understand that SAS will be including more nodes and options to work with the time series data clustering in their upcoming releases. Perhaps, our approach here can help guide what needs to be included in future releases of SAS Enterprise Miner.
7
SAS Global Forum 2012
Posters
Application of Time Series Clustering Using SAS® Enterprise MinerTM for a Retail Chain, SAS® Global Forum 2012, continued
APPENDIX Codes which were run in the SAS Code node: /*Extracting the Distance Matrix along with the TimeSeries Name: _NAMEID_*/ Data DistanceMatrix(type=distance); Set &EM_IMPORT_TRANSACTION; Drop StoreNumber; Run; Proc Print Data=DistanceMatrix; Title 'DistanceMatrix'; Run; /*Performing Proc CLuster on DistanceMatrix dataset with _NAME_ID as ID.*/ Proc Cluster Data=DistanceMatrix Method=Ward Pseudo OutTree=ClusterDetails; Id _NAMEID_; Run; Proc Print Data=ClusterDetails; Title 'ClusterDetails to PROC TREE'; Run; /*Performing Proc Tree to get the Dendrogram and Cluster variables.*/ /*NCL is set to 2, based on the dendrogram results from TS Similarity node and the SAS Code node.*/ Proc Tree Data=ClusterDetails Horizontal NCL=2 Out=ClusterFromTree; Run; Proc Print Data=ClusterFromTree; Title 'Cluster list from PROC TREE'; Run; /*Creating dataset1 and merging it with the results from tree.*/ Data dataset1; Set &EM_IMPORT_TRANSACTION; Keep StoreNumber _NAMEID_; run; Proc Print Data=dataset1; Title 'StoreNumber & _NAMEID_'; Run; /*Merging the dataset to get the StoreNumber mapped on to their respective cluster variables.*/ Proc SQL; Create Table RevenueClusterDetails As Select STORENUMBER, _NAMEID_, CLUSTER, CLUSNAME From dataset1 As T1 Inner Join ClusterFromTree AS T2 On T1._NAMEID_=T2._NAME_ Order By _NAME_; Quit; Proc Print Data=RevenueClusterDetails; Title 'RevenueClusterDetails'; Run; /*RevenueCluster Details dataset is exported as Train data.*/ Data &EM_EXPORT_TRAIN; Set RevenueClusterDetails; Run;
8
SAS Global Forum 2012
Posters
Application of Time Series Clustering Using SAS® Enterprise MinerTM for a Retail Chain, SAS® Global Forum 2012, continued
REFERENCES [1] Sascha Schubert and Taiyeong Lee. 2011 “Time Series Data Mining with SAS® Enterprise Miner “ Proceedings of SAS Global Forum 2011 conference. SAS Institute Inc., Cary, NC. [2] Michael Leonard, Jennifer Lee, Taiyeong Lee and Bruce Elsheimer. 2008 “An Introduction to Similarity Analysis Using SAS” Proceedings of International Symposium of Forecasting. SAS Institute Inc., Cary, NC. [3] Brocklebank, John, Taiyeong Lee, and Michael Leonard. 1999. “Forecasting Cross-Sectional Time Series: A Data Mining Approach Using Enterprise Miner Software.” Proceedings of the 24th SAS International Users Group Conference. Cary, NC: SAS Institute Inc.
ACKNOWLEDGMENTS The authors would like to thank Taiyeong Lee, Analytical Solutions Manager, SAS Institute Inc., for his valuable inputs.
CONTACT INFORMATION Your comments and questions are valued and encouraged. Contact the author at: Karthik Nakkeeran Oklahoma State University E-mail:
[email protected] Karthik Nakkeeran is a MIS graduate student from Oklahoma State University with five years of experience in Analytics and Information Technology; and he will be graduating in May 2012. He is focusing his studies on business ® analytic, data marketing and data modeling using SAS software. Previously, he was working with Accenture for 3.1 years. Currently, he is working as a Graduate Assistant for Dr. Goutam Chakraborty, Professor, Department of Marketing. Satish Garla Oklahoma State University E-mail:
[email protected] Satish Garla is working as Risk Consultant for SAS Institute. He has three years of professional experience as Oracle CRM Consultant. He is SAS® Certified Advanced Programmer for SAS® 9 and Certified Predictive Modeler using SAS® Enterprise Miner 6.1. Dr. Goutam Chakraborty Oklahoma State University E-mail:
[email protected] Dr. Goutam Chakraborty is a professor of marketing and founder of SAS and OSU data mining certificate and SAS and OSU business analytics certificate at Oklahoma State University. He has published in many journals such as Journal of Interactive Marketing, Journal of Advertising Research, Journal of Advertising, Journal of Business Research, etc. He chaired the national conference for direct marketing educators in 2004 and 2005 and co-chaired the M2007 data mining conference. He is also a Business Knowledge Series instructor for SAS.
TRADEMARK SAS and all other SAS Institute Inc. product or service names are registered trademarks or trademarks of SAS Institute Inc. in the USA and other countries. ® indicates USA registration. Other brand and product names are trademarks of their respective companies.
9