To minimize repetitive testing and improve data quality, a dye tracer method was
evaluated. ... continuous-flow tests are even more important, since existing ...
War. Res. Vol. 21, No. 10, pp. 1259-1264, 1987 Printed in Great Britain. All rights reserved
0043-1354/87 $3.00+0.00 Copyright © 1987 Pergamon Journals Ltd
APPLICATION OF TRACER TECHNIQUES TO CONTINUOUS-FLOW TOXICITY TESTING PETER G. MEIER*, WuK-HEE HONG and ROLF A. DEININGER Department of Environmental and Industrial Health, School of Public Health, The University of Michigan, Ann Arbor, MI 48109, U.S.A. (Received October 1986) Abstract--Frequent toxicant analyses are essential for good quality data in long-term continuous-flow tests. Due to the time consuming and costly chemical analyses, exposure levels are measured at best on a daily basis. These infrequent determinations may not detect variability in toxicant concentrations that could result in test failures. To minimize repetitive testing and improve data quality, a dye tracer method was evaluated. Rhodamine WT was selected as a toxicant tracer because of easy detectability, low toxicity to aquatic organisms, and negligible transformation in the aquatic environment. Results over a 24 h period showed that rhodamine reliably predicted the toxicant (diquat) concentrations with an r value of 0.99. Based upon these data, two replicate long-term tests with and without tracer were carried out exposing fathead minnows Pimephales promelas to diquat (I: l'-ethylene-2:2'-dipiridium dibromide). The test results indicated that the added rhodamine WT did not alter the diquat toxicity to fathead minnows using LC50 and ECs0 values for comparisons. From these findings it is concluded that dye tracers are suitable toxicant surrogates. Their use in flow-through tests allow more frequent analyses which result in better data and minimizes experimental failure. Key words--flow-through fish bioassays, dye tracer, toxicant analysis
INTRODUCTION The analyses of toxicants in aquatic toxicity testing are minimal because they are time consuming and costly. Therefore, data employed for calculating ECs0 or LCs0 values are usually based on nominal exposure concentrations. Chemical determinations in continuous-flow tests are even more important, since existing systems do not guarantee continuous and accurate delivery o f toxicant (Hong et al., 1987a). Hence, long-term exposures, such as chronic tests and early life stage tests, are performed less frequently because of the cost for toxicant analysis (McKim, 1985). Two alternatives are available that could decrease the associated cost o f dynamic exposure tests. Since design improvements in diluters have fiscal constraints, a low cost microcomputer-interfaced monitoring system may be applicable ( H o n g et al., 1987a). The other possibility would involve a surrogate that could be measured easily instead o f the actual toxicant. The main advantage of this method is that toxicant concentrations to which the test organisms are exposed can be estimated with simple analytical procedures. Knowing toxicant levels at any time during the exposure period will reduce the risk o f test failure caused by fluctuating toxicant levels and generate more accurate test results. *Author to whom all correspondence should be addressed.
In order to investigate this alternative, two replicate long-term tests with and without tracer were conducted to determine if the dye would predictably mimic the toxicant and secondly, to evaluate potential tracer-toxicant interactions as reflected through ECs0 and LCs0 values. EXPERIMENTAL MATERIALS AND METHODS
Dilution water Aerated and filtered well water was used for holding the minnows and it was also employed as dilution water in the fiow-through toxicity tests. This water is considered hard and had the following characteristics: temperature 15-16°C; pH 7.6; dissolved oxygen 8.4-9.2 mg I-~; conductivity 2150/~ mhos era- ~; alkalinity 109 mg 1- t as CaCO 3; EDTA hardness 616 mg 1-i as CaCO3; TOC (Total Organic Carbon) < 2 ppm; and suspended solids < 1 ppm. Test solutions and analytical methods Diquat (I : l'-ethylene-2:2'-dipiridium dibromide) was used as toxicant and it was prepared daily by diluting a 35.3% nominal active ingredient of diquat dibromide (Ortho Diquat H/A Herbicide, Chevron Chemical Co., San Francisco, Calif.). The quantity of diquat represented by the concentration of diquat salt (diquat dibromide) was measured by a u.v. spectrophotometer (Beckman A C T A III) at 310 nm (Summers, 1980). A standard curve prepared from a U.S. EPA sample (99.1% purity, EPA Research Triangle Park, N.C., Lot No. F514) was" used to determine diquat concentration. Because of the heterogeneous nature of diquat stock solution and owing to the changing ratio of diquat cation vs diquat salt in the aquatic environments (Summers, 1980), the concentrations were analyzed daily during the experiments.
1259
1260
PETER G. MEIER el al.
Rhodamine WT was prepared by diluting a 20% stock solution (E. I. Du Pont De Nemours & Co., Chicago, Ill.). The dye concentration was determined with a Turner III filter fluorometer, equipped with an ultraviolet (u.v.) lamp source and a high sensitive door. Color spec. No. 546 primary and No, 590 secondary filters were used to detect fluorescence (Turner Cat. No. 110-832; 110-833). The diquat concentrations were determined in two ways. In the tests with diquat only, levels were measured directly with a spectrophotometer. However, in the experiments with rhodamine WT and diquat, the diquat levels were determined indirectly from the dye concentrations. This was accomplished by measuring the dye intensity in composite effluent samples from the replicate exposure chambers. At programmed time intervals, the flow from replicate exposure chambers discharged into a sampling vessel and from there passed through a 10mm i.d. flow-through cell that was attached to the fluorometer. The microcomputer-interfaced monitoring system (MIMS) sensed the fluorometric intensity and calculated and recorded the corresponding diquat dibromide concentration (Hong et al., 1987a). This procedure was repeated every 30 min generating 48 concentration values for each of the five exposure levels per day. Test organisms Fathead minnows Pimephales promelas were purchased from Kurtz' Fish Hatchery (Elverson, Pa) and maintained in large, circular, flow-through fiberglass tanks. Fish were fed twice daily a mixture of TetraMin and ground trout chow during acclimatization and experimental period. They were kept at room temperature (1%21°C). For toxicity tests, 10 fish between 2 and 3 cm were placed randomly in each exposure chamber. The average weight of fish was 0.17_0.03 g Toxicity test The microcomputer-interfaced test system (MIMS) was assembled to a minidiluter that delivered approx. 3500 ml of test solution every hour to each of six concentration channels (Benoit et al., 1982). The toxicant mixture from each was then distributed via gravity to four replicate exposure chambers, which were made of glass and had working v o l u m e of 2000 ml. Thus, the flow rate to each chamber of 875 ml h -~ provided a mean retention time of 2.5 h. In summary, two types of experiments were carried out. The first test investigated the reliability of using rhodamine WT as an estimator of diquat concentration. The second series consisted of four 2-week continuous flow tests in which the potential interactions of dye with diquat were evaluated. This was accomplished by exposing fathead minnows in replicate experiments to diquat only, and to diquat with rhodamine WT. All tests were conducted according to "'Standard Methods" (U.S. EPA, 1975). A BASIC program, MULTILC, was developed for calculating time-dependent LCs0 and ECso values (Hong et al., 1987b). The EC parameter included in addition to mortality, loss of equilibrium and surface drifting (Dill et al., 1982). LC and EC values were used for comparing replicate experiments between diquat and diquat with rbodamine WT (Table 1: Tests 1 and 4 to Tests 2 and 3). RESULTS
AND DISCUSSION
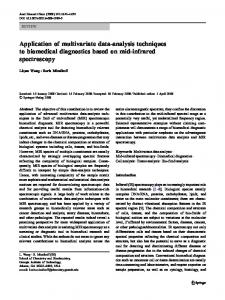
T h e reliability o f r h o d a m i n e W T as a s u r r o g a t e for d i q u a t was e v a l u a t e d p r i o r to the f o u r toxicity tests. A 24 h e x p e r i m e n t was c a r r i e d o u t to d e t e r m i n e the c h a n g e s in c o n c e n t r a t i o n o f d i q u a t c a t i o n vs d i q u a t salt as a f u n c t i o n o f dye fluorescence. A s e p a r a t e r e g r e s s i o n line was g e n e r a t e d for each o f the four s a m p l i n g p e r i o d s (Fig. 1). Since n o significant differences b e t w e e n the slopes o f the lines were a p p a r -
Table I. Summary of toxicant concentrations in the four continuous flow tests Diquat concentration (mg I i ) Rhodamine WT Test Toxicant concentration No. channel No. Mean ± 2 SDt (mg I i) 1 I 63.39 2.28 2 33.29 6.14 3 1819 2.97 4 9.26 194 5 4.94 1 17 2 I 62.92 0.75 0.070 2 35 I ~ 4.90 0.039 3 1880 2.98 0.021 4 ~0.04 2.39 0.011 5 528 I83 0.006 3 I 63 02 ~04 0.070 2 ~7.67 3.14 0.042 3 20.46 2.84 0.023 4 12.20 2.86 0.014 5 6.87 2.06 0.007 1 62.80 I, 15 4 2 34.93 1.98 3 18.61 138 4 995 0.98 5 5. h0 0.74 n = 14 for Test 1 and 4; n = 112 for Tests 2 and 3. SD = standard deviation.
ent at p ~ 0 . 0 5 , they were e m p l o y e d d u r i n g the exp o s u r e tests (Tests 2 a n d 3) to d e t e r m i n e d i q u a t d i b r o m i d e levels f r o m the dye intensity. T h e c o n f i d e n c e for the use o f the tracer was r e i n f o r c e d by g0 A
lqme 0 Hr
s0-
O "lqme 6 Hr
70-
r-I Time 24 Hr
O Time 12 Hr
,~- 60. ~:" o
50.
*~ ¢
8
4o-
o" 5 0 i~ 20-
10-
0
1
Fluorescence Intensity, %
Fig. l. Correlation between diquat dibromide concentration
and rhodamine WT fluorescence over time (r = 0.99).
U
20
~o
5O
60'
70,
O
4
6
Days
B
10
12
14
•
5.28 ±
CONTROL
o X5
1.83
X 3 18.80 ± 2 . 9 8 • X 4 10.04 = 2 . 3 9
0
2
4
6 Days
8
10
12
14
•
6.87 ± 2.06 CONTROL
o X5
• X 4 12.20 ± 2 . 8 6
a X1 6 2 . 9 2 "- 0 . 7 5 • X 2 35.15 = 4 . 9 0
mgll Diq uat,
• X1 6 3 . 0 2 = 1.04 • X 2 3 7 . 6 7 -* 3.14 o X 3 2 0 . 4 6 *- 2 . 8 4
Diq uat, m g l l
i 3o
E40,
50.
60
70.
Test 3
Fig. 2. Diquat dibromide exposure levels estimated from rhodamine WT intensities for each concentration channel over 14 days.
2
Test 2
o~
@
0
0
~°
8
~° O
go
PETER G. MEIER et al.
1262
the observation that the correlation coefficient was highly significant for that 24 h period with an r value of 0.99.
ments (Tests 2 and 3) had slightly higher mean standard deviation in toxicant level (8.94 and 7.74%) than those observed in Tests 1 (8.3%) and 4 (3.93%). However, these differences were attributed to more frequent analyses of 114 (Tests 2 and 3) to 14 (Tests 1 and 4). Overall, it was concluded that the tracer method and the diluter functioned reliably over the
Toxicant fluctuations
A daily prepared diquat stock solution of 63 mg 1 was employed in all experiments. For Tests 2 and 3, a rhodamine WT solution of 0.07 mg 1-1 was mixed with diquat (63 mg 1- ~) each day and then pumped to the dilutor. In these two experiments, the actual diquat concentration was determined from the dye intensity that was measured fluorometrically. The 30min MIMS generated toxicant concentrations were averaged and plotted at 6h intervals. The resulting plots show the toxicant fluctuations within each concentration channel over time (Fig. 2). The ease of dye intensity detection permitted more frequent analyses and through these the diluter performance was monitored. Hence, potential dilution problems were detected and corrected as observed in Tests 2 and 3 at day seven and three, respectively. Another advantage of the dye tracer method is that the severity of toxicant fluctuations can be considered when data interpretations are made. The dye experi-
14 day period.
Exposure tests
Adverse effects of toxicant to fathead minnows varied little between diquat and diquat with rhodamine WT. Survival data were plotted at 2-day intervals for the experimental period (Fig. 3). As indicated by the plots, 100% mortality was observed at the highest diquat exposure (63 mg 1-1) within 4 days in all tests and within 7 days at the second highest level (35mgl --~) in Tests 1, 3 and 4. An average of 90% survival was reported when controls were combined with the lowest diquat exposure after 96 h and this was reduced to 80% after 7 days in all experiments. Based only on the mortality data, little differences were observed between diquat (Tests 1 and 4) and diquat with dye (Test 2 and 3).
Test 1
Test 2
1001
1001
SO-
80-
so-
>- so. el 40-
XI
~ 40
×3 X4 X5
20" 0
20
",, ~ " " ~ O
CONTROL 0
2
4
6
8
10
12
• X2 cl X3 • X4
O X5 • CONTROL
0 2
14
4
6
8
10
12
14
Days
Days
Test 4
Test 3 1001
100
80'
80
-!
"~ 80
=~ 6o 4O
A XI
20
• Q • 0 •
0 0
. 2
.
. 4
.
. 6 Days
. 8
. . 10
12
14
40
Xl X2 X3 • X4 O X5 • CONTROL
•
X2 X3 X4 20 X5 CONTROL 0
4
6
8
10
12
14
Days
Fig. 3. Survival rates of fathead minnows exposed to various concentration of toxicant over 14 days. Tests 1 and 4~diquat dibromide; Tests 2 and 3 ~ i q u a t dibromide with rhodamine WT.
Tracer application in continuous-flow bioassays
1263
Test 2
Test I 1001
100 I
o 60 : 2000 40
_
-" i x3x2XIx4
"~" ~! 40608020
Xl X2 El X3 • X4 O X5 • CONTROL •
0 2
4
6
0 Days
. 12
10
X5 . • CONTROL 0 14 0
1001
6
8 Days
10
12
14
1001
!.o
80'
80
6O
:
4
Test 4
Test 3
=-
2
40 20 0 0
2
4
, 8
6
X1
40
X3
20 -
o x5 • CONTROL
10
12
. . . . . , 2 4 6 8 Days
0
14
0
Days
z= Xl • X2 rl X3 • X4 0 X5 • CONTROL 10
12
14
Fig. 4. Unaffected rates of fathead minnows over 14 days. Tests 1 and 4--diquat dibromide; Tests 2 and 3---diquat dibromide with rhodamine WT.
(a) diquat
(b) d i q u a t
+ tracer
40
40
~. 3o
3O
c
\ LCSO
=.
o.
,- 2O
,3
10
\\EC50
0
I 0
I 4
\ \ EC50 \
10
I
I 0 Days
I
I 12
I
I 16
0
r 0
I 4
I
I 0 Days
I
i 12
Fig. 5. Comparison of time-dependent LCso and ECso values as a function of diquat dibromide levels. (a) Tests 1 and 4; (b) Tests 2 and 3.
I 16
1264
PETER G. MEIERet al.
Another graph was prepared for each experiment by taking into consideration other physiological disfunctions (i.e. adverse swimming behavior and/or loss of equilibrium) in addition to mortality (Fig. 4). A similar pattern was observed except that the affected rates were higher than the mortality rates, particularly at the lower concentrations. Time-dependent LCs0 and ECs0 graphs were generated by the M U L T I L C program (Fig. 5). The small difference in the LCs0 and ECs0 at equal toxicant levels between Tests (1 and 4) vs (2 and 3) was attributed to varying fish sensitivities, since the values fell within each others 95% confidence interval. Based on Fig. 5 it was concluded that rhodamine W T dye with diquat did not change the toxicity of diquat and its effect on fathead minnows. This finding was preconceived since the maximum rhodamine W T concentration utilized in Tests 2 and 3 was