Recent publications according to application of wavelet are shown in figure1. 36% .... data compression as monitoring system deals with huge PQ. Disturbance ...
International Journal of Computer Applications (0975 – 8887) Volume 39– No.18, February 2012
Application of wavelet Transform in power Quality: A Review Suresh K. Gawre
N.P.Patidar
R. K. Nema
Assist. Professor
Associate. Professor
Professor
Electrical Engg. Department
Electrical Engg. Department
Electrical Engg. Department
MANIT, Bhopal,
ABSTRACT From last decades the objective of Power quality (PQ) monitoring and analysis has drastically . Generally the power quality problem covers the time scales range from tens of nanoseconds to steady state to describe different events. Well discussed in various international standards (IEEE, IEC, EN etc) and also give various acceptability curves to quantify and classify different Power Quality phenomenon (CIBM A and ITC) according to amplitude and time frame. It is observed that different tools and methods are always been used to detect and classify the power Quality events. The whole advance tends to process the raw data and extract the information in order to make decision. And further move towards real time monitoring, protection and control. This paper presents a comprehensive review of different techniques based on wavelet transform to detect and classify power quality problems .
Keywords Power quality, wavelet transform, De-noising, resolution, adaptive filter, A I Techniques.
multi-
1. INTRODUCTION Power system restructuring and distributed generations are the two emerging areas, for recent interest in power quality analysis [19]. Another reason is huge demand of power electronics based apparatus and enhanced susceptibility of these devices, production processes and manufacturing industry causes the voltage disturbances. Power Quality problem covers a wide range of different frequency bands, variation in magnitude and can be stationary or non-stationary which had been discussed [8]. The range power quality disturbances varies from low magnitude, low frequency (0.1% and less than 25 Hz) voltage fluctuation due welding and arc furnace type of intermittent loads to very high frequency transients (0 - 8.0pu, 5 MHz) caused by lightning strikes, switching and other related phenomena. Therefore identification and classification is not easy. [9 and 21]. Traditional methods presently being used by utilities for power quality monitoring are generally based on visual observation of voltage and current waveforms. Highly automated monitoring hardware and software is required in order to provide sufficient coverage of complete system, to understand the prime causes of disturbances, to get better solutions and to predict future problems [8]. Power Quality analysis is based on huge data gathered from the real system. The large amount of PQ data deals with different practical problems in large storage and communication from local
MANIT, Bhopal,
India
India
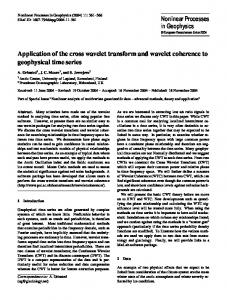
monitors to the major central p rocessing unit. PQ problems must be solved properly with suitable device, desirable conditions for assuring mitigation or reduction in the degree of severity of power quality problems. To achieve this goal a feasible approach can be considered which incorporate detection capabilities into monitoring equipment so that events of interest can be recognized, captured and classified automatically. Basic signal processing techniques used in practical power quality monitoring have been based on root-mean-square (rms) measurements [8]. Fourier transform (FT) has been used as an analyzing tool for extracting the frequency contents of the recorded signals[60 and 66], where some of the PQ problems can be detected. Recent publications according to application of wavelet are shown in figure1. P u b lic atio n s b ased o n WT( %)
MANIT, Bhopal, India
Wavelet based Application in power system (publications) 36%
32%
12%
11% 3% Pr otecti on Tr a nsi ents
Loa d O ther s for eca sti ng
4%
2%
Pa r ti a l Measur ment Power Di scha r g e Qua l i ty
Power system Applications
Fig.1 Numbers of papers are reviewed here to discuss various methodologies which are based on wavelet transform. M ethodologies can be classified according to application of wavelet transform like multiresolution signal decomposition techniques, squared wavelet transform coefficients, data compression technique, energy and RM S value evaluation, denoised using wavelet threshold methods, standard statistical hypothesis test-based denoising, adaptive filtering and DWT based hybrid system, wavelet transform with neural network and adaptive neurofuzzy networks [4]-[68]. A brief review of wavelet-based signal processing techniques applicable to PQ monitoring is discussed in this paper. The challenging issues related to automatic detection and analysis of power quality problems are highlighted.
30
International Journal of Computer Applications (0975 – 8887) Volume 39– No.18, February 2012
2. POWER QUALITY STANDARDS AND ACCEPTABILITY CURVES. The reason for the keen interest in power quality is the economic aspect [19]. The terms power quality, analysis and monitoring known to the author Kajihara, was in a study published in 1968 [21]. Event characterization is discussed in which provides power quality standards to follow [13]. Some of them are shown in table 1 and classification of different types of power quality problems are given in table 2. Table1. Power quality standards S tandards IEC61000-2-1:1990, IEC 61000-2-5:1995
M onitoring PQ
IEEE 1159:1995
Transients
IEC 816:1984 IEC 61000-2-1:1990 IEEE C62:41:1991, IEEE 1159:1995; and
IEC 61009-2-1:1990, IEEE 519:1992
Harmonics
IEC 61000-2-1:1990; IEEE 519:1992
Voltage Flicker
IEC 61000-4-15:1997
Table 2: Classification of various power quality problems S .No.
1. a. b. c. a. b. c.
2. a. b. c. 3. a.
Categories
Duration
Short duration variation Sag Instantaneous 0.5-30 cycle M omentary 30 cycle - 3 sec. Temporary 3 sec. – 1min. Swell Instantaneous 0.5-30 cycle M omentary 30 cycle - 3 sec. Temporary 3 sec. – 1min. Interruption M omentary 0.5 cycle - 3 sec. Temporary 3 sec. – 1min. Long Duration variation Interruption >1 min. Under-voltage >1 min. Over-voltage >1 min. Transients Impulsive
4. 5.
Events Classification of PQ
Voltage sag/swell interruptions
b.
Voltage magnitude
0.1-0.9 pu 0.1-0.9 pu 0.1-0.9 pu 1.1 -1.8 pu 1.1 -1.4 pu 1.1 -1.2 pu < 0.1 pu
a. b. c. d. e.
Nanosecond 1m sec. Oscillatory Low Frequency 0.3-50 m sec. M edium 20 µ sec. frequency High frequency 5 µ sec. Voltage Steady state Imbalance Waveform distortion DC offset Steady state Harmonics Steady state Interhamonics Steady state Notching Steady state Noise Steady state
2.1 Quantification Proble ms
of
Powe r
0-4 pu 0-8 pu 0-4 pu
0.5-2%
0-0.1% 0-20% 0-2% 0.1%
Quality
Power acceptability curves are used for quantification of the power quality disturbances. These curves are basically used to determine whether the supply voltage to a load is accep table for the maintenance of a load process. These curves are plots of bus voltage (rms) deviation verses time duration and separate the bus voltage deviation vs. time duration plane into acceptable and unacceptable regions. Few existing power acceptability curves are listed below: Table: 3 Power quality curvesCurve Year application ITIC curve 1996 Information equipments IEEE emerald 1992 Sensitive book equipments CBEM A curve 1978 Computer equipment
technology electronic business
The well-known ―Computer Business Equipment M anufacturer Association (CBEM A) curve‖ [43], shown in fig.2, can be used to evaluate the voltage quality of a power system with respect to voltage interruptions, sags or undervoltages and swells or overvoltages. This curve was originally produced as a guideline to help CBEM A members in the design of the power supply for their computer and electronic equipment [43]. By noting the changes of power supply voltage on the curve, it is possible to assess if the supply is reliable for operating electronic equipment, which is generally the most susceptive equipment in the power system. CBEM A has been renamed Information Technology Industry Council (ITIC), and a new curve [43], as shown in Fig. 2, has been developed to replace CBEM A‘s.
< 0.1 pu 0.0 pu 0.8-0.9 pu 1.1-1.2 pu
31
International Journal of Computer Applications (0975 – 8887) Volume 39– No.18, February 2012
CBEMA curve ITIC curve
Change in Bus voltage (%)
250
200
Over voltage
150
100
50
± 10% 0
Acceptable Power
-50
Under voltage -100 0.0001
0.001
0.01
0.1
1
10
100
1000
Time in seconds Fig. 2: CBEMA curve and ITIC curve The main difference between them is that the ITIC version is discrete version, so it is easier to digitize than the continuous CBEM A curve. The tolerance limits at different time period are similar in both curves. Although currently only the CBEM A curve has been officially endorsed in IEEE Std. 446, it is expected that the ITIC curve will also be endorsed in the near future. Both the CBEMA and ITIC curves were described for use in the 60-Hz, 120-V distribution voltage system, but no study has been found whether they are suitable for use in the 50-Hz 240-V distribution voltage system.
information. This reverse process is called the inverse wavelet transform or signal reconstruction. These two processes compose the wavelet transform. Let x(t) be the time domain signal to be decomposed or analyzed. The dyadic wavelet transform (DWT) of x(t) is then defined as ∞ 𝑚 𝑡 − 𝑛2𝑚 𝐷𝑊𝑇𝛹 𝑥 𝑚, 𝑛 = 2 − 2 𝑥 𝑡 𝛹∗ 𝑑𝑡 (1) 2𝑚 −∞ where * denotes a complex conjugate, m and n are scale and time-shift parameters and 𝚿(t) is a function of mother wavelet [23]. The DWT is implemented and shown in fig. 3 using a multiresolution pyramidal decomposition technique [2, 10, and 22]. A recorded time signal c0(n) with a sampled version of x(t) is decomposed into its detailed d1(n) and smoothed c1(n) signals using filters g(n) and h(n) . g(n) has a band-pass filter response. Therefore, the filtered signal d1(n) is a detailed version of c0(n) and contains higher frequency components (such as sharp edges, transitions, and jumps in the original power disturbance signals) than the smoothed signal c1(n) , because filter h(n) has a low-pass frequency filter response. The decomposition of c0 (n) into c1(n) and d1(n) is first-scale decomposition and they are defined as follows: 𝑐1 𝑛 = 𝑑1
𝑛 =
𝑘
ℎ 𝑘 − 2𝑛 𝑐 𝑜 (𝑘)
𝑘
𝑔 𝑘 − 2𝑛 𝑐 𝑜(𝑘)
Higher-order decompositions are performed in a similar manner [22]. d1(n)
3. WAVELET TRANSFORM Towards the direction of intelligent power quality monitoring and the development of automatic classification and analysis tools, appropriate signal processing methods are required in order to extract information from the signals [10]. Several signal processing methods have been proposed for feature extraction, like Fourier and wavelet transforms, combined with neural networks, fuzzy expert systems, kalman filter or pattern recognition methods [8][56]. For detection and location of power quality disturbances, wavelet transform is far better as compare to Fourier transform [1], [2] , [23], [60] and [62]. Various Software packages are available for wavelet analysis, M ATLAB is one of them where wavelet toolbox provide platform for wavelet analysis [24]. The wavelet transform is the projection of a discrete signal into two spaces: the approximation space and a series of detail spaces. The implementation of the projection operation is done by discrete-time sub band decomposition of input signals using filtering followed by down- sampling [2]. The wavelet transform is utilized to produce representative feature vectors that can accurately capture the characteristics of power quality disturbance, exploring feature extraction of disturbance signal to obtain dynamic parameters [49]. Wavelet transform consists of a pair of transformations from one domain to another domain. The original domain is the time domain in wavelet transforms, while the transformed domain is called the time-scale domain. The transformation process from time domain to time-scale domain is a forward transform, because a given signal is decomposed into several other signals with different levels of resolution. It is possible to recover the original time domain signal without losing any
(2)
h(n)
2
h(n)
2
g(n)
2
d2(n) c2(n)
c0(n) g(n)
2
c1(n)
Fig. 3. Decomposition of c0(n) into 2 scales Because the family of the dilated wavelets constitutes an orthonormal basis for L2(R), the original signal x(t) could be recovered from its coefficients DWT 𝚿 x(m,n). The reconstructed signal is defined as
𝑥 𝑡
𝑚
= 2− 2
𝑘
𝑛
𝐷𝑊 𝑇𝛹 𝑥 𝑚, 𝑛 𝛹 ∗
𝑡−𝑛2𝑚 2𝑚
(3)
Wavelet theory is an advanced mathematical tool that uses multiresolution techniques to analyze waveforms and images [23]–[27]. Wavelet analysis is capable of revealing aspects of data that other analysis tools would miss, including trends, breakdown points, discontinuities, and self-similarity. Feature extraction is a vital step that completes the link between intelligent analysis tools and actual PQ waveforms and data. Wavelet analysis has proven very strong and efficient in feature extraction from PQ disturbance data. Application of wavelet theory to PQ analysis has been well researched [28]– [40].
32
International Journal of Computer Applications (0975 – 8887) Volume 39– No.18, February 2012 One very common application discussed and reviewed here is data compression as monitoring system deals with huge PQ Disturbance data collected in memory of data collection system. The large amounts of data pose several practical problems in the storage and communication of the data from local monitors to the central processing computers [12, 60, 61, and 64]. Data compression has hence become paramount important issue in the PQ analysis area. Several methods using wavelet theory have been developed for the compression of PQ data [39]–[42].
3.1 Wavelet Based Data Compression Wavelet transforms decompose any P Q signal into different scales at detailed resolutions. At each scale, the wavelet transform coefficients which associates with specific disturbance event are larger than those do not correspond to PQ disturbances, therefore specific disturbance coefficients are taking in account while others irrelevant events are leftover, so the amount of stored data can be drastically reduced [4,9,18, and 20]. Now the compressed data can be used to reconstruct the original signal, with very little loss of information [32, 36, 38, and 39]. It was reviewed and discussed that the compression ratio, defined as the original file size divided by the compressed file size is well proved [40,41,42, and 54].These observation and discussions concludes that the Data storage requirement is minimized and transmission time while preserving the reconstructed signal in such a way that it is drastically reduced from the original [4]. De-noising of row signal is must because signals poses Noise which is directly measured using sensors and processed for monitoring purpose. Researchers found keen interest on energy and rms value evolution based classification.
3.2 Energy and RMS Value Evaluation Based A different paper reviewed and discussed where the PQ disturbances are mapped into the wavelet domain and extracted from the raw signal. The duration of the distortion is measured in a noisy surroundings and its energy and RM S value evaluated [6], [37] and [67]. The effect of noise on the energy features in wavelet domain, extracted for detection and classification of PQ disturbances in the presence of noise is discussed here. No prior knowledge of disturbance signal. Simple less complex de-noising method is also discussed which is being used by some researchers [16] and [54]. Potential of these technique in extracting accurately the required energy features even at very low SNR (Signal Noise Ratio) was discussed in [32,54, and 68] and found that such wavelet-based methods are efficient in automated detecting, classifying and measuring various power system disturbances. The localization property of the wavelet transform is used to detect and measure the distortion duration in a noisy environment. In The discussion it is observed that The RM S value of the distortion event magnitude was measured using wavelet coefficients and the variations of the RM S value during the distortion was also measured for making the detection method effective [10,11]. In the above discussions it is observed that energy distribution of coefficients (as defined by Parsevals theorem) of different levels, found very effective [9]. Useful property of wavelet bases is that the basis function are local, this makes coefficients based algorithms naturally adaptive in homogeneities in the function [32].
Wavelets are adaptive because there is not just one wavelet, they can be designed to fit individual applications some papers are reviewed and discussed here based on adaptive filter based wavelet system
3.3 Adaptive Filter Based DWT The dynamic changes cannot be adapted itself while applied to DWT based event detectors, because of its fixed filter coefficients and, hence, generates frequent detection and processing of the same steady state disturbance The filter coefficients adapt the changing monitored signal in An adaptive filter. Therefore, several papers also discussed and reviewed on adaptive filtering and DWT based hybrid system. [11]. In this paper, a new PQ detection and analysis method, that uses combination of adaptive filtering for event detection and wavelet transform as feature extractor has been discussed, which utilizes the Adaptive Filter based on least mean Square method is shown which exhibits more reliability than conventional Transversal Filter as discussed in [12]. Discussion concludes that the wavelet based event detector gives better results under changing load configurations and when the normal operation waveforms contain harmonics and noise. DWT alone, in such conditions would result in repeated alarm and processing of the data or in some cases may fails to detect the disturbance as a feature extractor, shows its excellent signal representation property in time frequency plane [30] and [31]. Novel methods for classification and feature extraction also have been discussed, where Artificial intelligence and expert systems are employed either individually with wavelet or integrated wavelet with AI and expert system. Several research papers were reviewed and discussed here.
3.4 Neural Network and Fuzzy Based Wavelet To broaden the scope, various artificial intelligent techniques and expert system combine with wavelet transform used in PQ event classification are also reviewed. The combination performance of wavelet transform such systems improve the effectiveness of various available methods for power quality signal analysis [16]. Other papers reviewed based on ANNWT based classifier [57],[58],[59],[67], where the amount of needed training data is extensively reduced also significantly improved the diagnosis efficiency. The training algorithm shows great potential for automatic power quality monitoring technique with on-line detection and classification capabilities [5]. In this paper, comparisons are shown and discussion made that wavelet transform with an Artificial Neural Network accuracy is less than wavelet combined fuzzy feature classifier. but In terms of efficiency, ANN based system is more efficient than the Fuzzy based system [67]as it can classify all the test values correctly whereas Fuzzy based system could not classify the extreme values in each disturbance range correctly. On other hand, in terms of speed ANN is a slower method as it is an iterative procedure and takes time for training as well as its complexity increases with the no of input data [16]. Some paper reviewed and discussed based on the integration of wavelet system with ANN and Expert System ( Fuzzy System) exhibits batter accuracy and efficiency in the power quality pattern Recognition [18]. Results obtained from different research papers [32 and 68], which provides a comparative performance in the term of classification accuracy of the classifier given below in Table 4.
33
International Journal of Computer Applications (0975 – 8887) Volume 39– No.18, February 2012 Table 4. Comparison of combination WT with AI S .No. Method Accuracy (%) 1. 2. 3.
Wavelet based ANN Wavelet and Fuzzy Wavelet transform, ANN Fuzzy
5. CONCLUSION
94.37 98.7 98.9
and
4. PROPOSED SCHEME
General basic blocks of automatic M onitoring system suggested by many research works, An Automatic M onitoring Scheme given in fig.4 as given [31] different stages where wavelet can be employ successfully.
Pre- Processing I PP
Estimation Segmentation
Feature Extraction II FE
Quantify
Decision Making DM
Classification CL
Knowledge Based Rules Based
Pattern Recognition
Fig. 4 Automatic Monitoring S cheme Block I represent a Pre- processing (PP) stage as detection of PQ disturbance perform segmentation in different stages e.g. pre- event, during - past event. Block II represents a feature extraction (FE) stage used to quantify features for different types of PQ signals. Block III represents the classification (CL) stage knowledge based expert system to differentiate various events. Block IV represents the Decision M aking (DM ) stage assign the type of disturbance using pattern recognition, ANN, FUZZY logic. Further the work can be extended adding new application block as Real Time M onitoring (RTM ) or online monitoring [55].It is found that Wavelet transform can be utilized successfully for complete monitoring system the main features are tabulated in Table 5. Table 5. Applications of WT in different stages of monitoring system. Applicat ions of WT
Data Compressi on
Energy RMS
Adaptive Filters
AI Technique
yes yes yes yes yes
yes yes yes
yes yes yes
yes
yes
yes yes yes yes yes
Stages PP FE CL DM RTM
Power quality has become prime criteria in modern scenario of power system analysis. Approaches for automated detection, feature extraction and classification of PQ disturbances using wavelet transform. Some basic properties and application were observed and found excellent in the field of power quality monitoring and analysis, some of them are given below: DWT is preferred than CWT, As Redundancy is observed using CWT. Choice of M other Wavelet is required as per application but Db wavelet is preferred in most of the PQ analysis. Such techniques can be applied to a wide variety of PQ signals which requires no prior knowledge of disturbance signal. Noise can be easily removed during decomposition and reconstruction process of any signal. Energy of coefficient based feature extractors are more efficient.
Detection and classification are mainly observed in past applications in PQ monitoring. Online M onitoring , real time control system and fault classification would be the future scope. Comprehensive discussions and review over De-noising, data compression, adaptability and enhanced effectiveness with combination with AI techniques and expert system combine with wavelet transform had shown the potential of designing more accurate and more intelligent PQ monitoring system for PQ analysis.
4. ACKNOWLEDGMENTS Our thanks to the reviewers and experts, valuable suggestions given were very useful, towards development of the paper.
5. REFERENCES [1] I. Daubechies, Ten Lectures on Wavelets. SIAM , Philadelphia, Pennsylvania, 1992 [2] C. Sidney Burrus Ramesh A. Gopinath and Haitao guo ‗Introduction to wavelet and wavelet transform’ Prentice Hall publication. [3] Surya Santoso, Power quality assessment via wavelet transform analysis‖ IEEE transictions on power delevery,Vol 11, no.2, april 1996 [4] Surya Santoso, power quality disturbance data compression using wavelet, IEEE transictions on power delevery,Vol 12, no.3, July 1997 [5] Elmitwally, S. Farghal, M . Kandil, S. Abdelkader, and M . Elkateb, Proposed waveletneurofuzzy combined system for power quality violations detection and diagnosis, Proc. Inst. Elect. Eng., Gen., Transm.Distrib., vol. 148, no. 1, pp. 15–20, Jan. 2001 [6] A. M . Gouda, S. H. Kanoun, M . M . A. Salama, and Chikhani, Wavelet-based signal processing for disturbance classification and measurement, Proc. Inst. Elect. Eng.,Gen., Transm. Distrib., vol.149, no. 3, pp. 310–318, M ay 2002. [7] T. K. Abdel-Galil, M . Kamel, A. M . Youssef, E. F. ElSaadany, and M . M. A. Salama, Power quality disturbance classification using the inductive inference approach, IEEE Trans. Power Del., vol. 19, no. 4, pp. 1812–1818, Oct. 2004.
34
International Journal of Computer Applications (0975 – 8887) Volume 39– No.18, February 2012 [8]
M . H. J. Bollen and I. Y. H. Gu, Signal Processing of Power Quality Disturbances. Piscataway, NJ: IEEE Press, 2006. [9] U. D. Dwivedi and S. N. Singh, A robust energy features estimation for detection and classification of power quality disturbances, in Proc. IEEE Power Eng. Soc. Power India Conf., 2006, pp. 384–390. [10] El sayed mohamed Tag eldin, Characterization of power quality disturbances based on wavelet transforms, int J. energy technology and policy, vol.4, nos1/ 2,.2006 [11] U. D. Dwivedi, S. N. Singh, and S. C. Srivastava, Analysis of transient disturbances in distribution systems: A hybrid approach, in Proc. IEEE Power Soc. General Meeting, 2007, pp. 1–8.
Eng.
[12] C.H. Lin and C.H. Wang, Adaptive wavelet networks for power quality detection and discrimination in a power system, IEEE Trans. Power Delivery, vol. 21, no. 3, pp. 1106-1113, July 2006. [13] IEEE power quality event characterization 1159.2, Feb. 2001. [14] J. Barros and E. Perez, Automatic detection and analysis of voltage events in power systems, IEEE Transactions on Instrumentation and Measurement, vol. 55, no. 5, pp.1487-1493, Oct. 2006. [15] Wen Ren Yang, M odeling of wavelet based voltage sag monitoring system and design for the mixed signal integrated circuit implementation, IEEE international conference industrial Tecc., ICIT 21-24 April 2008. [16] Wei Liao, Hua Wang, Pu han, Neural network based detection and recognition method for power quality disturbance, Control and Decision Conference (CCDC), 2010 Chinese. [17] A.M . Gaouda, M onitoring Nonstationary Signals, IEEE Recommended Prac for monitoring Elrctrical power Quality,1995 [18] U. D. Dwivedi, S. N. Singh, Denoising Techniques With Change-Point Approach for Wavelet-Based PowerQuality M onitoring, IEEE Trans. Power Del., vol 24, no. 3, July 2009. [19] Algira, ‖Power Quality Following Deregulation‖ proceedings of the IEEE, vol. 88, no. 2, february 2000 [20] Yang Hong-Tzer, and Liao Chiung-Chou, 2001. A denoising scheme for enhancing wavelet-based power quality monitoring system, IEEE Trans on Power Delivery, vol. 16, no. 3, pp. 353 - 360. [21] Kajihara H.H., 1968. ―Quality power for electronics” Electro-Technology, vol.82, no.5. [22] G. Strang and T. Nguyen‖ Wavelets and Filter Banks‖ Wellesley, MA: Wellesley Cambridge Press, 1996. [23] C. K. Chui, An Introduction to Wavelets. New York: Academic, 1992. [24] M . M isiti, Y. M isiti, G. Oppenheim, and J.-M . Poggi, ―Wavelet toolbox for use with Matlab—User’s guide,‖ The M athWorks, Natick,MA,1997. [25] M . P. Collins, W. G. Hurley, and E. Jones, The application of wavelet theory to power quality diagnostics,in Proc. 29th Univ. Power Eng.Conf., 1994, pp. 129–132. [26] Y. Xu, X. Xiao,Y.Yang, and X. Chen, Application of wavelet transform in power quality analysis, Dianli
Xitong Zidonghue/Automat. Electric Power Syst., vol. 23, no. 23, pp. 55–58, 1999. [27] A. M . Gouda, M . M . A. Salama, M . R. Sultan, and A. Y. Chikhani, Application of multiresolution signal decomposition for monitoring short-duration variations in distribution systems, IEEE Trans. Power Delivery, vol. 15, pp. 478–485, Apr. 2000. [28] Zhou Wenhui Li Qing Zhou Zhaojing, Power quality detection using wavelet-multiresolution signal decomposition, IEEE Trans. Power Delivery, vol. 14, pp. 1469–1476, Apr. 1999. [29] A. M . Gaouda, M . M . A. Salama, A. Y. Chikhani, and M . R. Sultan, Application of wavelet analysis for monitoring dynamic performance in industrial plants, in Proc. North Amer. Power Symp., Laramie, WY,1997, pp. 325–331. [30] P. Pillay and A. Bhattacharjee, Application of wavelets to model short term power system disturbances, IEEE Trans. Power Syst., vol. 11, pp.2031–2037, July 1996. [31] J. Liu and P. Pillay, Application of wavelet analysis in power system disturbance modeling, in Proc. 5th IEEE AFRICON Conf., Cape Town,South Africa, 1999, pp. 639–642. [32] U.D. Dwivedi, Deepti Shakya and SN Singh, Power Quality M onitoring and Analysis: An Overview and Key Issues, , International Journal of Systems Signal Control and Engineering Application, Vol., 1, No.1, 2008, pp. 74-88 , [33] G. T. Heydt and A. W. Galli, Transient power quality problems analyzed using wavelets, IEEE Trans. Power Delivery, vol. 12, pp.908–915, Apr. 1997. [34] A. W. Galli, G. T. Heydt, and P. F. Ribeiro, Exploring the power of wavelet analysis, IEEE Comput. Appl. Power, vol. 9, pp. 37–41, Apr.1996. [35] A.W. Galli and O. M . Nielsen, Wavelet analysis for power system transients, IEEE Comput. Appl. Power, vol. 12, pp. 16–25, Jan. 1999. [36] O. Poisson, P. Rioual, and M . M eunier, New signal processing tools applied to power quality analysis, IEEE Trans. Power Delivery, vol.14, pp. 561–566, Apr. 1999. [37] L. Agrisani, P. Daponte, M . D. Apuzzo, and A. Testa, ―A measurement method based on the wavelet transform for power quality analysis,‖ IEEE Trans. Power Delivery, vol. 13, pp. 990–998, Aug. 1998. [38] T. B. Littler and D. J. M orrow, Wavelets for the analysis and compression of power system disturbances, IEEE Trans. Power Delivery, vol.14, pp. 358–364, Apr. 1999. [39] J. Chung, E. J. Powers, W. M . Grady, and S. C. Bhatt, Variable rate power disturbance signal compression using embedded zero tree wavelet transform coding, in Proc. IEEE Power Eng. Soc. Winter Meet., vol. 2,New York, NY, 1999, pp. 1305–1309. [40] S. Santoso, E. J. Powers, and W. M . Grady, Power quality disturbance data compression using wavelet transform methods, IEEE Trans. Power Delivery, Vol. 12, pp. 1250–1257, June 1997. [41] K. M ehta and B. D. Russell, Data compression for digital data from power systems disturbances: Requirements and technique evaluation,, IEEE Trans. Power Delivery, vol. 4, pp. 1683–1688, June 1989.
35
International Journal of Computer Applications (0975 – 8887) Volume 39– No.18, February 2012 [42] R. P. Bingham, D. G. Kreiss, and S. Santoso, Advances in data reduction techniques for power quality instrumentation, in Proc. Third Eur. Power Quality Conf 1995. [43] Information Technology Industry Council. ITIC Curve Application Note. [Online] http://www.itic.org/iss_pol/techdocs/curve.Pdf. [44] Zwe-Lee Gaing ―Wavelet-Based Neural Network for Power Disturbance Recognition and Classification‖ IEEE Transactions On Power Delivery, Vol. 19, No. 4, October 2004 [45] A.M . Gaouda, S.H. Kanoun, M .M.A. Salama and A.Y. Chikhani, Wavelet-based signal processing for disturbance classification and measurement, IEE ProcGener. Tr~instn. Distrib. Vol. 149, No. 3, M ay 2002 [46] Boris Bizjak, Peter Planinsic , Classification of Power Disturbances using Fuzzy Logic, Power Electronics and Motion Control Conference, EPE-PEMC,. 12th International 2006 [47] Wael R. Anis Ibrahim and M edhat M . Morcos, Artificial Intelligence and Advanced M athematical Tools for Power Quality Applications: A Survey , IEEE Transactions On Power Delivery, Vol. 17, No. 2, April 2002 [48] Enrique Pérez, Voltage Event Detection and Characterization M ethods: A Comparative Study, Transmission & Distribution Conference and Exposition: Latin America, 2006. TDC '06. IEEE/PES [49] T.Lachman, A.P.M emon, T.R.M ohamad and Z.A.M emon ,Detection of Power Quality Disturbances Using Wavelet Transform Technique, International Journal For The Advancement Of Science & Arts, Vol. 1, No. 1, 2010 [50] Bousaleh G., Hassoun F., Ibrahim T. ,Application of Wavelet Transform in the Field of Electromagnetic Compatibility and power quality of Industrial Systems, International Conference on Advances in Computational Tools for Engineering Applications, 2009. ACTEA '09. [51] M . Gaouda, S. H. Kanoun, M . M . A. Salama, and A. Y. Chikhani, Pattern Recognition Applications for Power System Disturbance Classification, IEEE Transactions On Power Delivery, Vol. 17, No. 3, July 2002 [52] Bahisham Yunus, Haiyu Li , Analysis of Power Quality Waveform for Data Transmission Efficiency over IEC 61850 Communication Standard, First International Power and Energy Conference PEC on November 28-29, 2006 [53] G. Panda, P. K. Dash, A. K. Pradhan, and S. K. M eher Data Compression of Power Quality Events Using the Slantlet Transform IEEE Transactions On Power Delivery, Vol. 17, No. 2, April 2002 [54] D. Saxena et al. Power quality event classification: an overview and key issues, International Journal of Engineering, Science and Technology Vol. 2, No. 3, 2010, pp. 186-199 [55] Enrique Pérez and Julio Barros. A Proposal for On-Line Detection and Classification of Voltage Events in Power System IEEE Transactions On Power Delivery, Vol. 23, No. 4, October 2008
[56] Julio Barros and Enrique Pérez, A Combined Wavelet – Kalman Filtering Scheme for Automatic Detection and Analysis of Voltage Dips in Power Systems, Power Tech IEEE Russia 27-30 June 2005 [57] A. M . Gaouda, A. H. El-Hag. And S. H. Jayaram Detection of Discharge Activities During Food Processing by Pulsed Electric Field , IEEE Transactions on Industry Applications 2008 [58] Surya Santoso and Edward J. Powers, Power Quality Disturbance Waveform Recognition Using WaveletBased Neural Classifier—Part 1: Theoretical Foundation, IEEE Transactions On Power Delivery, Vol. 15, No. 1, January 2000 [59] Surya Santoso, and Edward J. Powers Power Quality Disturbance Waveform Recognition Using WaveletBased Neural Classifier—Part 2: Application IEEE Transactions On Power Delivery, Vol. 15, No. 1, January 2000 [60] Surya Santoso, Characterization of Distribution Power Quality Events with Fourier and Wavelet Transforms, IEEE Transactions On Power Delivery, Vol. 15, No. 1, January 2000 [61] Surya Santoso, Electric Power Quality Disturbance Detection Using Wavelet Transform Analysis, International Symposium on Time-Frequency and TimeScale Analysis, 1994., Proceedings of the IEEE-SP 1994 [62] A.M . Gaouda, S.H. Kanoun, M .M.A. Salama and A.Y. Chikhani ,Wavelet-based signal processing for disturbance classification and measurement, IEE Proc.Gener. Trunsm. Distrib., Vol. 149. No. 3, M ay 2002 [63] Hong-Tzer Yang, and Chiung-Chou Liao, A De-Noising Scheme for Enhancing Wavelet-Based Power Quality M onitoring, System IEEE Transactions On Power Delivery, Vol. 16, No. 3, July 2001 [64] Valdomiro VEGA ,Automatic Power Quality Disturbance Classification Using Wavelet, Support Vector M achine And Artificial Neural Network, CIRED 20th International Conference on Electricity Distribution Praga, 8-11 June 2009 [65] F. B. Costa, , B. A. Souza, , and N. S. D. Brito, A Wavelet-Based Algorithm to Analyze Oscillographic Data with Single and M ultiple Disturbances, Power and Energy Society General Meeting - Conversion and Delivery of Electrical Energy in the 21st Century, 2008 IEEE 2008 [66] N. Hamzah, Z. Zakaria A. M ohamed & A. Hussain, A Novel Software Tool For Power Quality Diagnosis, IEEE 8th International Conference on Computer and Information Technology Workshops. 8-11 July 2008 [67] B.K. Panigrahi V.R. Pandi, Optimal feature selection for classification of power quality disturbances using wavelet packet-based fuzzy k-nearest neighbour algorithm, IET Gener. Transm. Distrib., 2009, Vol. 3, Iss. 3, pp. 296–306 [68] Suriya Kaewarsa1et al. Wavelet-Based Intelligent System for Recognition of Power Quality Disturbance Signals, Lecture Notes in Computer Science, 2006, Volume 3972/2006, 1378-1385
36