Title: Applications of Neural Networks in Training Science Authors and Institutions: Dr. Mark Pfeiffer1, Prof. Dr. Andreas Hohmann1 1
Institute of Sport Science, Department of Training and Movement Science,
University of Bayreuth Corresponding Author: Dr. Mark Pfeiffer, University of Bayreuth, Institute of Sport Science, Department of Training and Movement Science, D-95440 Bayreuth, Tel.: +49(0)921/55 3488, Fax: +49(0)921/55 5806,
[email protected]
Keywords: Neural Network, Sports Athletes
Classification codes: 2260, 3720, 4160
1
Abstract Training science views itself as an integrated and applied science, developing practical measures founded on scientific method. Therefore, it demands consideration of a wide spectrum of approaches and methods. Especially, in the field of competitive sports, research questions are usually located in complex environments, so that mainly field studies are drawn upon to obtain broad external validity. Here, the interrelations between different variables or variable sets are mostly of a nonlinear character. In these cases, methods like neural networks, e.g. the pattern recognizing methods of self-organising Kohonen feature maps or similar instruments to identify interactions might be successfully applied to analyse data. Following on from a classification of data analysis methods in training-science research, the aim of the contribution is to give examples of varied sports in which network approaches can be effectually used in training science. First, two examples are given in which neural networks are employed for pattern recognition. While one investigation deals with the detection of sporting talent in swimming, the other is located in game sports research, identifying tactical pattern in team handball. The third and last example shows how an artificial neural network can be used to predict competitive performance in swimming.
2
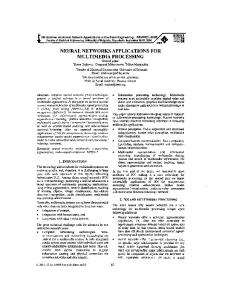
1. General introduction When carrying out an enquiry in the field of training-science research, many different methods have been employed for data collection and for data analysis. These methods or techniques must be integral to a general research design and appropriate for the questions the researcher wants to answer. According to Robson (2002), research questions are at the centre of any framework for research design (Fig. 1). They are influenced by the theoretical background existent in the scientific area/field of interest and the main purposes of the intended investigation.
purpose(s)
theory research questions
methods
sampling strategy
Fig. 1. Framework for research design (Robson, 2002)
Apart from “purposes” (What is the study trying to achieve?), “theories” (What theory will guide or inform the study?), and “sampling strategy” (From whom will you seek data?), “methods” also concerns aspects of data collection and data analysis. Whereas data collection focuses on the measurement of training parameters (e.g. training load, training stress, training contents, training methods) and/or performance or performance abilities/prerequisites (e.g. strength, endurance), data analysis refers to the way this data can be evaluated in view of the research questions, here in the science of sports training.
3
The methods currently used for data analysis in the field of training-science research can generally be divided into static and dynamic approaches (see Table 1). Table 1 The static and dynamic approach in the field of training-science research.
Static approach Dynamic approach
Linear methods
Nonlinear methods
Regression analyses, Discriminant analyses
Neural networks
Dynamic testing, Regression Analysis of Time Series (e.g. Cross-Correlation)
Differential equation systems, Computer simulation
The static approach delivers evidence of correlations, differences or similarities between two or more variables of interest. In most cases, the underlying interrelation between the data is assumed to be linear and deterministic, so that regression analyses or discriminant analyses, and in the special case of equidistant longitudinal data various models of regression (crosscorrelation) analyses of time series, can be employed (Hohmann, 1992; Osterburg, Rojas, Strüder & Mester, 2002, 2003). In other cases, the interrelations between different variables or variable sets exhibit a nonlinear character. Therefore, from a mathematical point of view, this data is best analysed by tools like neural networks, e.g. the pattern recognizing methods of self-organising Kohonen feature maps or similar instruments to identify interactions, depending on the particular research questions (Perl, 2004). In the dynamic approach chronological changes, e.g. of training and/or performance characteristics, are the focus of attention, in general interpreted according to systems theory. For this purpose, dynamic testing procedures with repeated measurements of the examined parameters are obligatory (Petermann, 1996; Schack & Guthke, 2003). The procedures for analysing process data can also be distinguished in linear and non-linear methods. On the assumption of a deterministic interrelation between the 4
measured characteristics in the linear models, equal values result in an identical outcome, although the “history” of the process is unaccounted for. By contrast, nonlinear methods stem from the dynamical systems approach and assume that systems components as well as their interrelations alter over time. Nonlinear models have been applied to date, in order to model the effects of training on performance. In this case, complex differential equation systems (like in the fitness-fatigue model by Banister, Calvert, Savage & Bach, 1975; Fitz-Clarke, Morton & Banister, 1991; Morton, Fitz-Clarke & Banister, 1990) or iterative computer simulation models (like in the performance-potential model by Perl, 2001b; Perl, 2002a; Perl, 2003; Pfeiffer, 2008) are suitable. With regard to the issue at hand, “Neural Networks” approaches, it must be pointed out that research methodology in training-science research has traditionally oriented itself, like other areas of science such as medicine, biology or psychology, on the principle of reductionism (cf. Gerok, 1989, etc). Here individual variables are isolated from the network of interrelations, and interacting factors eliminated, as far as possible. Under these conditions, approaches afford linear interrelations of the investigated variables, so that in the majority of studies, linear methods incorporated in research design allow for a successful analysis of the quantitative data. In-so-doing, research questions in the field of training science are typically evaluated using inferential statistical methods and models (e.g. regression analysis, discriminant analysis). Increasingly in the recent past, however, it has been shown that deterministic, linear models are inadequate in understanding and explaining even simple biological mechanisms (Gerok, 1989) not to mention more complex forms of human behaviour or movement (Haken, Kelso & Bunz, 1985; Hoyt & Taylor, 1981; Kelso, 1995; Kelso & Schöner, 1988; Kriz, 1999). These problems have more or less led to a paradigm shift, to a view of sports training as complex dynamic systems, and have resulted in the abandonment of general, linear data analysis methods in favour of individual, non-linear ones
5
(e.g. Eiser, 1994)1. The use of nonlinear methods for data analysis seems especially promising in the area of high-performance sport, in which semi-experimental investigative design (including inferential statistics analysis methods) cannot be realistically implemented, whether because of the organizational circumstances of training, or because of the limited justification of doing so, given their poor external validity. Following on from the classification of data analysing methods in training-science research briefly outlined above, the central aim of this contribution is to show how network approaches can be successfully applied to solve complex problems in the field of sports science. The first investigation is in the field of talent detection, where a Self-Organizing Kohonen Feature Map was used to identify distinct patterns of juvenile characteristics in subsequently successful and non-successful swimmers. In a second example, the Dynamically Controlled Network (DyCoN) - a further development of Kohonen Feature Maps (KFM) - was applied to detect tactical behaviour patterns in team handball. In addition to these two examples of pattern recognition, an artificial neural network (Multi-Layer-Perceptron) was used to predict the competitive performance of an elite female swimmer at the Olympic Games 2004 in Athens based
on
her
training
loads.
1
The paradigm shift taking place in the understanding of sports performance is discussed by Balagué and Torrents (2005).
6
2. Three examples of neural network approaches in training-science research 2.1. Example 1: Talent identification 2.1.1. Introduction Recent theoretical contributions to the theory of talent in sport have clearly shown that a complex and longitudinal framework is necessary to successfully address the talent identification and talent promotion issue in most sports (Abbot & Collins, 2002, 2004; Gagnè, 1985; Vaeyens, Malina, Janssens, van Renterghem, Burgois, Vrijens, et al., 2006). Consequently, the early diagnosis of instances of juvenile competition performance and performance prerequisites should be complemented by a final follow-up search for the best individual performance of the athlete at adulthood (Schneider, Bös & Rieder, 1993; Willimczik, 1982). As talent development is a complex nonlinear process, and the different components of early talent make-up not only change over time, but can also mutually suppress or enhance each other, linear models in discriminant analysis can only approximate the nonlinear talent development in a very small range of the future performance output. Because of this, neural networks also seem to be appropriate tools for talent detection purposes (Philippaerts, Coutts & Vaeyens, 2008). Due to their pattern detection ability, methods such as the (SelfOrganizing) Kohonen Feature Map allow the prediction of future success among potential talents by revealing distinct patterns in the individual sets of the sport specific dispositions. The purpose of the investigation presented here was to compare the quality of linear and nonlinear talent prognoses, both based on valid prognostic talent criteria, in swimming. Specifically, it aimed to demonstrate that the talent development outcome could be better modelled by means of the nonlinear Self-Organizing Kohonen Feature Map (SOFM) network.
7
2.1.2. Methods The Magdeburg Talent study on Elite Sport Schools (MATESS; Hohmann, 2009) is a six-year longitudinal study on the development of talented children and adolescents at the two elite sports schools in Magdeburg, Germany. The study was carried out based on a sequential sliding populations design (Regnier, Salmela & Russell, 1993). The subjects comprised 172 male (M = 14.27 yrs., SD = 5.54) and 118 female (M = 13.27 yrs., SD = SD = 3.25) athletes of the swimming classes (Hohmann, 2009). Twenty-five elementary physical and technical performance components of swimming were measured at three different points in the period from 1997 to 2001. These variables were complemented by four psychological (achievement motivation, volition, stress level, concentration) and four sociological (school support, family support, training environment, training regime) performance components, which were collected via questionnaires. In addition, the best competition performance of each athlete in each of the three survey periods was recorded. At the end of the study, the best competition placement in the year 2006 was collected for male and female swimmers aged 16 years and older to determine their final competition performance. Thus, the diagnosis of this final competition performance took place about seven years after testing personal best performance during their school-age training (males: M = 6.80 yrs., SD = 1.64; females: M = 6.41 yrs., SD = 1.49). Using the final competition performance all athletes were categorised into three different talent groups to define a criterion variable (Table 2).
8
Table 2 Talent groups (criterion variable) differ by the best competition placement in the year 2006 for male and female swimmers aged 16 years and older. Final competition performance (crowl sprint) 1.
Medallist at European/World Championships (EC; WC) or Olympic Games (OG)
2.
Final at EC, WC or OG
Talent group (TG)
3 3.
Medallist at German Championships (GC) or Junior-European Championships (JEC)
4.
Final at GC or medallist at JEC
5.
Participation at JEC or medallist at federal state Championships (FSC)
6.
Final at Junior German Championships (JGC) or medallist at FSC
7.
Participation at JGC or final at FSC
8.
Participation at FSC or medallist at Junior federal state Championships (JFSC)
9.
Participation at JFSC
2
1
10. Competition on county level or below
As a next step, the twenty-five physical and technical performance components were analysed by factor analyses (SPSS 14.0). Using this procedure, six complex and one-dimensional performance complexes were extracted by orthogonal factor analysis: 1. body stature, 2. maximum and explosive strength, 3. general and 4. sport specific speed strength, 5. technique and coordination, and 6. elementary speed (Hohmann & Seidel, 2003). In a further step, the factor values of the six performance complexes were tested for prognostic validity by regression analysis to predict the final competition performance.
9
The valid components were then averaged, and besides the juvenile competition performance (1), the resulting mean value served as a second talent predictor that represented the performance prerequisites (2). Moreover, further talent predictors such as speed of performance development (3), speed of development of performance complexes (4), utilization (5) (Hohmann & Seidel, 2003; Kupper, 1980), and psychological stress stability (6) were calculated from the data, and completed the set of six juvenile talent predictors that were used to predict the final talent outcome in adulthood with a view to the three talent groups. Finally, complete data sets of 76 male (TG1 = 24, TG2 = 31 and TG3 = 21) and 58 female (TG1 = 18, TG2 = 22 and TG3 = 18) could be included in the following prognosis (see Hohmann, 2009). For the prognosis of the final adult talent group, two methods were applied: on the one hand, a discriminant analysis (DA), and on the other hand, the neural network of a Self-Organizing Kohonen Feature Map (SOFM; DataEngine of MIT Inc., Aachen, Germany). To obtain a “true” prognosis, the talent forecasts based on discriminant analyses and on neural network method had to undergo a cross-validation procedure. In the case of the discriminant analyses, 50 percent of the total number of cases was used to compute the discriminant functions that were then used to determine the talent outcome of the remaining 50 percent of cases. In the two specific SOFM models for the male and the female swimmers, the talent forecasts were validated by the “leave-one-out”-procedure. To this end, one less than the total number of the data sets of the female and male talents in swimming were used to train the network. Hence, in the training of each of the two network models (consisting of a 5x5 neuron layer) the number of n-1 individual data sets was used for the initial network training procedure of 5,000 training steps. The remaining personal data set of juvenile talent predictors of a single athlete was then given to the neural network to calculate a prognosis of the adult competitive performance from this specific data set. In the same way as before, the result of the predicted 10
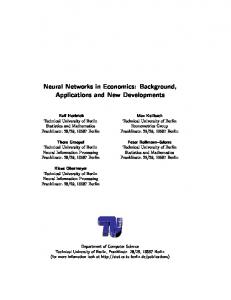
future talent category was compared afterwards with the known adult performance category. This test procedure was repeated for each data set, so that the final number of correctly estimated cases represented the quality of each of the talent prediction models for male and female swimmers. 2.1.3. Results The comparison of the real adult performance groups with the modelled future groups of the talented swimmers at adult age led to far better predictions, when the neural network method was applied. The percentages of correctly predicted cases by discriminant analysis (females: 69.0 percent; males: 50.0 percent) are much lower than those delivered by SOFM (females: 87.9 percent; males: 68.3 percent; Fig. 2).
Extreme Talent
Extreme Talent
TG3 100%
TG3 100%
(OG, WC, EC, GC)
(OG, WC, EC, GC)
100,0 % Hits
100,0 % Hits
High Talent
High Talent
TG2 77.3%
TG2 74.2%
Normal Talent
Normal Talent
88,9 % Hits
33,3 % Hits
(EYC, GYC, CC)
(EYC, GYC, CC)
77,3 % Hits
74,2 % Hits
TG1 88.9%
TG1 33.3%
(CC, CYC)
female
(CC, CYC)
male
Fig. 2. Results of the talent prognosis in female and male swimmers based on a nonlinear model of the Self-Organizing Kohonen Feature Map (minor and major errors in classification indicated by single and double arrows respectively).
2.1.4. Discussion This paper aimed to find out whether the talent development outcome can be better predicted by means of the nonlinear mathematical method of artificial neural networks or by linear methods such as discriminant analyses. The percentages of correctly assigned swimmers to
11
the three talent groups in the linear discriminant analysis were comparably lower than in the nonlinear neural network procedure. Thus, the results underpin the assumption of Philippaerts et al. (2008) that neural network approaches are excellent tools to predict future competitive performance categories using juvenile talent characteristics/predictors. Furthermore, the good results of the neural modelling compared with the weaker results of the linear discriminant analysis suggest that the adaptive behaviour of the system athlete is in fact a nonlinear complex problem. This supports a dynamic systems approach to talent development, in which the young athlete unfolds a performance development process in a self-organized way, influenced by various personal and contextual moderator variables (Cotè, Baker & Abernethy, 2003; Gagnè, 1985; Heller & Hany, 1986). As neural networks are able to recognize global patterns of different talent make-ups, they are a worthwhile tool in the analysis of nonlinear talent development. Hence, from a dynamic systems point of view, successful neural network modelling may be interpreted as a representation of deviations of the different states of the system from equiprobability, in our case the identification of different patterns of juvenile athletic performance. This is a very interesting aspect of neural modelling of competitive performance, because the nonlinear dynamic systems perspective is rapidly emerging as one of the dominant meta-theories in the natural sciences, and there is reason to believe that in the future it will eventually provide a more general integrative understanding in training science, as well. 2.2. Example 2: Sports games research – identification of tactical pattern in handball 2.2.1. Introduction Over many decades, research in game sports has focused on notational analysis by using game observation methods. A primary aim of notational analysts is optimizing feedback to the performer and coaches to improve performance (Hughes & Bartlett, 2002). Indeed, the effectiveness of computerized notational analysis, by means of systematic observation as 12
quantitative and qualitative feedback, on improving performance in game sports has been demonstrated in various studies (Brown & Hughes, 1995; Murray, Maylor & Hughes, 1998). Most of these methods use structure-oriented observation models, which enable the researcher to register isolated elementary actions in a match, but do not allow for the obtaining of data on the match process itself. For this reason, process-oriented models were developed in order to achieve deeper insight into the tactical match structure or the tactics of the teams or players. When the sequence of tactical behaviour is the focus of process analysis in games, key tactical actions must be recorded in chronological order. In doing so, one of the main problems is to find/adopt appropriate methods for processing/analysing the extensive data in such a way as to ensure relevant information is on hand for further interpretation. Consequently, some recent approaches have applied artificial neural networks to process analysis in game sports (Memmert & Perl, 2009; Grunz, Memmert & Perl, 2009; Perl, 2002b). In fact, even extremely complex data can be rendered manageable by employing neural networks, i.e. by organising key information from a plethora of processes into a limited number of process types. In this way, patterns of tactical behaviour can be identified and evaluated in terms of effectiveness, and the obtained information fed back into the training process. Ground-breaking research by Perl (2001a) using the Dynamically Controlled Network (DyCoN), confirms the potential of this method to isolate types of rallies representing special tactical behaviour in game sports such as squash or volleyball. Based on these studies, the DyCoN-approach has been used to identify types of tactical patterns in team handball (Pfeiffer & Perl, 2006). From the point of view of training theory, such an approach is interesting for the following reasons:
For sports game analysis, process types with similar tactical structures can constitute very meaningful information.
13
The findings of quantitative match observation could meet the needs of sports practice much better if they are based on information about individual process types instead of mere general interrelations.
Depending on the frequency of their occurrence in typical game situations, technicaltactical behaviour could represent a high-priority training goal and thus be integrated systematically into training.
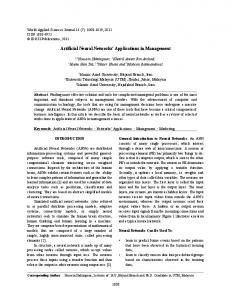
(Pfeiffer & Perl, 2006). 2.2.2. Methods Observation Model With ball possession as the starting point of our observation model, offensive play was modelled on the basis of offensive attempts characterising the observation unit. An offensive attempt thus begins when possession changes from one team to the other (1), the match is continuing after a referee decision (2), or the attacking team reforms for a new play (3). In the last case, a new offensive attempt is organised. Accordingly, an offensive attempt ends if the ball is lost to the opposing team without a referee decision (loss of the ball) (1), the referee interrupts the match (e.g. after a technical or rule fault) (2), or the attack attempt is abandoned, i.e. the team has to re-organise their offensive play (3). Starting by gaining ball possession and ending with the loss of the ball or with a goal, offensive play/offence consequently comprises at least one offensive attempt, but can also be described by several subsequent attempts. In a further step, the process of an offensive attempt was broken down into the following general phases: 1. Starting formation (general formation for offensive play preceding the first tactical action), 2. Initiating (first tactical action), 3. Continuing action 1 (second tactical action), 4. Continuing action 2 (third tactical action) and 5. goal throw. Each of these different phases can be described again by certain states, depending on specific handball tactics that may be deployed (Fig. 3). Thus, the structuring of an attempt as well as the states is firmly 14
grounded in handball-specific concepts and therefore has a theoretical foundation in scientific findings on handball (Czerwinski & Taborsky, 1997). sequential progress of an offensive attempt in handball Offence formation
states
position attack 3:3 position attack 2:4 fast break attack 1* fast break attack 2*
Initiating 1. tactical action
Continuing action 1 2. tactical action
Continuing action 2 3. tactical action
doesn’t happen
(0)
doesn’t happen
(0)
doesn’t happen
(0)
feint
(1)
feint
(1)
feint
(1)
crossing
(2)
crossing
(2)
crossing
(3)
transition
(3)
transition
(3)
transition
(4)
miscellaneous (4)
(1) (2)
miscellaneous (4)
goal throw
doesn’t happen
(0)
jump/fall shot back court
(1)
(2)
straight shot back court
(2)
(3)
goal throw wing (3)
miscellaneous (4)
goal throw pivot (4)
example of the numerical code of an attempt 1 (position attack 3:3)
3 (transition)
1 (feint)
0 (doesn’t happen)
2 (straight shot back court)
* “Initiating”, “Continuing action 1“ and “Continuing action 2” are obligatory signed with doesn’t happen (0).
Fig. 3. Model of an offensive attempt using a sequence of states (Pfeiffer & Perl, 2006)2.
Because the neural network we used (see below) required a constant process length for each attempt, a "doesn't happen"-state had to be added for completion when no tactical action could be registered in the concerning phase. Our model only included two continuing actions, as shown in Figure 3, i.e. three tactics in total. The reason for this limitation was our findings, that more than 92 % of offensive attempts are already finished after three tactical actions, i.e. the state “Continuing action 2”. Our model does not seek to differentiate between attempts going beyond an offensive attempt of more than three tactical actions. By using the above 2
With the sequence of numbers 1 3 1 0 2 in the example, an attempt is illustrated which started in the offence formation “position attack 3:3” (1). Subsequently, – as the first tactical action – a transition to the pivot position took place (3) which contained a change of the offence formation from position attack 3:3 to position attack 2:4. The 1st continuing action, i.e. second tactical action, was a feint (1), the offensive attempt finished without a second continuing action (0) by a goal throw from the back position (2). 15
model, the process of each offensive attempt - representing a certain tactical behaviour - can be described by a five figure number (process length) (Fig. 3, bottom area). The Neural Network approach - DyCoN DyCoN – i.e. Dynamically Controlled Network – is a neural network approach that has been developed particularly for the analysis of dynamic adaptation (Perl, 2001, 2002a, 2002b). It draws on the concept of Kohonen Feature Maps (KFM), in which neuron training is instigated using specific information, resulting in clusters of similar information being formed. KFMs are basically about similarity and inherent correlation. An individual piece of information, e.g. a handball process pattern as detailed above, is encoded in a vector of attribute values, perhaps representing tactics on a team, group, or individual level. In undergoing iterative training, a given neuron will develop correspondence to a certain pattern, more specifically, adapt its vector of attribute values. At any point during training, each neural vector is compared to the given input vector for best fit, in order to identify the winner neuron. In accordance with a pre-determined learning rule, the winner neuron, and to a decreasing degree its neighbouring neurons, "move" towards the new input, modelling their attribute vectors on the input vector. An interesting consequence of such information or pattern training is the creation of connected areas of neurons or "clusters" from similar input patterns. Indeed, neighbouring clusters typically arise from similar pattern types. As a result, a multi-dimensional pattern system may be plotted 2-dimensionally, revealing a strong underlying similarity. The exercise facilitates the analysis of complex patterns, especially with regard to trajectories. Conventional KFMs, however, lack learning dynamics insofar as the learning process is determined by unique external functions driving the network to an ultimate state which might prove satisfactory, especially if the training vectors are few in number. The DyCoN approach progresses from the KFM concept detailed above, its contribution lying in each neuron learning and providing information independently and continuously without 16
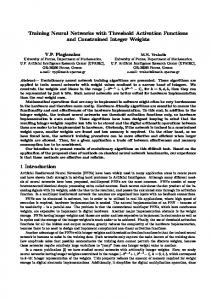
making use of external control functions (Perl, 2001, 2002). This allows the network to be trained over various phases, as made necessary by the respective training success, and so to be tailored to the data available on the one hand and the specified precision on the other. If properly generated from original data (e.g. by means of Monte Carlo-methods), even synthetic data can be used for neural network training. Obviously, the use of such artificially generated surrogate data reduces the amount of original data needed for training drastically. Data Collection - Sample In the context of a performance diagnostic investigation, 15 matches (12 teams) of the Women's Junior World Championship 2001 were observed (Pfeiffer, 2005). The instrumental consistency of the observation system (objectivity) was examined by the inter-rater consistency of two observers (inter observer agreement). The Cohen’s Kappa values of the observation categories were found to be between 0.75 and 0.92, which according to Robson (2002) represents an "excellent" classification (> 0.75). The data of the systematic game observation was then reorganised according to our model of an offensive attempt. In the following, a prepared DyCoN (20x20 neurons) was trained with 2900 offensive attempts (processes) from all teams to coin offensive attempt patterns. By using this neural network, which classifies attempts according to the similarity of their tactical structure, different teams could be examined according to tactical behaviour. As an example, the offensive attempts of the three best teams were isolated from the training data and subsequently tested with the network to ascertain specific tactical patterns (Pfeiffer & Perl, 2006). For technical reasons, offensive attempts without tactical actions and without goal throws, i.e. attempts with the coding "10000" and "20000", were not included in our neural network analysis. 2.2.3. Results A selection of results is given below to show the scope of conclusions on tactical structure in team handball which DyCoN promises. The trained network is depicted in Figure 4, with the 17
variously shaded areas representing the offensive attempt patterns displaying similarities in tactical structure (Pfeiffer & Perl, 2006). fast break attack (1, 2) position attack (offensive system 2:4 )
1 wot
wt
wot
2 wt
stb
jsb
wot
wt
position attack (offensive system 3:3)
jsb w stb
initiating feint (I.F.) initiating crossing (I.C.)
stb jsb
I.F. + 1. continuing action I.C. + 1. continuing action I.T. + 1. continuing action
wt
stb
p
stb w
w
jsb
w
jsb
p
initiating transition (I.T.) initiating miscellaneous (I.M.)
stb
p
without individual or group tactics
jsb wt
jsb wt jsb
jsb wt = with goal throw w = goal throw wing jsb = jump shot back court
wt
wt
wt w wt
jsb
jsb
wt
wot = without goal throw p = goal throw pivot stb = straight shot back court
at least 3 tactics (initiating, 1. + 2. continuing action)
Fig. 4. Pattern of the identified types of offensive attempts (Women’s Junior World Championship 2001) (Pfeiffer & Perl, 2006).
In the upper left corner of the network, offensive attempts involving fast break attacks (solid dashed line) are identified. The upper middle network (striped area) denotes attempts in the position attack with the system 4:2. The remaining network represents attempts in the position attack 3:3. Among these, larger network area clusters of neighbouring neurons can be identified, connected by lines (called edges), with an edge indicating that similarity exceeds a given minimum. In a next step, the neurons and clusters identified by the network architecture can be specified and analysed according to tactical behaviour (Fig. 4). Attempts with no or only one individual or group tactic action are located in the diagonal from the top right to the bottom left (bold line). Here, definitely inferior tactical concepts had been used, or the opposing team had 18
prevented further tactical actions. Also, note the large area in the lower middle range of the network area, where attempts with only one individual tactic (feint) are illustrated. Offensive attempts consisting of two tactical actions (initiating and 1st continuing action) were assigned (with one exception) to the right network area (bold dashed line). Finally, the left as well as the lower edge of the network represent attempts with more complex tactical structures. In these offensive attempts, at least three individual or group tactics were accomplished (crosshatched area). The following example should demonstrate how the trained DyCoN could be applied to analyse the tactical pattern of the three best teams when they realise attempts finished with a goal (successful attempts). The successful attempts of the three teams, (i.e. attempts concluding in a goal) were analysed separately. Moreover, Figure 5 shows the usefulness of the network in identifying various patterns of successful tactical behaviour in the teams under investigation. Where the Hungarian team successfully employs the fast break attack 1 (upper, left area), the Russians are served well by both types fast break attack, and Germany is at its best in fast break attack 2 (Fig. 5).
Hungary (HUN) 4 matches; 107 oa
Russia (RUS) 4 matches; 113 oa
Germany (GER) 5 matches; 117 oa
Fig. 5. Pattern of successful types of offensive attempts (oa) (best three teams) (Pfeiffer & Perl, 2006).
19
Furthermore, the Hungarian team not only uses individual tactic concepts with great frequency, but also scores at a high rate using these tactics (Fig. 5). Interestingly, they were often successful initiating with a feint and forgoing continuing actions (dotted line). The Russian pattern of offence shows points of similarity, yet the network identifies three additional sequences of successful attempts, especially the offensive attempts in the position attack 2:4. In contrast to the Hungarian and Russian network patterns, no dominant clusters of successful attempts by the German team could be found beyond the aforementioned fast break attacks. The bold line shows successful offensive attempts distributed over large areas of the network, indicating Germany achieved its points with a variety of tactical concepts. In interpreting the above, it must be remembered that the opponent’s defensive system is not taken into account by the present model of an offensive attempt. The sport of handball nevertheless displays a conspicuous connection between a team’s defensive system and its tactics of offensive play. In light of this, additional behavioural information was registered in the form of secondary attributes alongside tactical characteristics, e.g. the defensive system. In the case of the Hungarian team, offensive attempts were organised more frequently (62% of all attempts) against offensive or semi-offensive systems than in the play of the two other teams (RUS = 41% and GER = 37%). This could go part of the way to explaining the Hungarian team’s highly individualised tactical style. 2.2.4. Discussion The present study aimed to show that the neural network method is suitable for analysing the complex tactical structures evident in game sports. Specifically, the method proved itself a useful instrument in investigating a process within the match generally considered highly complex and to display a high degree of structural resolution. The application presented treats a model of an offensive attempt as a structural unit in order to pinpoint the typical tactics of three teams as they become evident over several games. Furthermore, it should be noted that the approach presented need not be limited to a structural unit defined by the offensive 20
attempt as. Indeed, defining further suitable structural units (relevant to the respective aim of the investigation), will allow the implementation of different methods of game structure analysis. Yet even persisting with the structural unit at hand promises to be helpful in tackling a variety of further questions. In the detection of the change in tactical concept within a given match, separate phases of play could be compared by their respective distribution on a mutual, specifically coined network. An alternative method of investigating the evolution of tactics over the course of a single match could involve classifying the attempts in chronological order, thus obtaining trajectories over the network. In the end, however, structural analysis can only be conducted on the basis of information representing the reality of a particular play in an incomplete and selective way. The representation of play in the model in the form of recorded data, of course, does not pretend to be complete. It is, however, clearly possible to include potentially relevant information in the shape of additional attributes: a design consideration which could prove useful in interpreting results. Alternatively, analysis could be restricted to comparable attack attempts, as defined by corresponding play ideas or play contexts. Moreover, such analysis might be further restricted to attack attempts completed against similar defence systems. 2.3. Example 3: Analysing the effect of training on performance in swimming 2.3.1. Introduction The analysis and understanding of training processes, i.e. the effect of training load on sports performance, are of extreme importance to training science, helping a coach in elite sports to monitor training and to ensure athletic performance peaks in crucial competitions. Indeed, performance in swimming is closely connected with physiological adaptations that are induced by the athlete’s training program. However, as mentioned in the introduction, biological adaptation is a complex non-linear problem, and thus the adaptation of a biological system leads to changes in the system itself, i.e. the adaptive behaviour can change. 21
Furthermore, it is common knowledge that double training input does not lead to double performance output (Costill, Flynn, Kirwan, Houmard, Mitchell, Thomas & Park, 1988; Costill, Thomas, Robergs, Pascoe, Lambert, Barr & Fink, 1991; Costill, 1999). Hence, linear models can only approximate non-linear adaptive behaviour within a very small range of the modelled performance output. Several studies focussed on adaptation in swimming are based on linear mathematical concepts such as linear differential equations or regression analysis (Chatard & Mujika, 1999; Hohmann, 1992; Hooper, & Mackinnon, 1999; Mujika, Busso, Lacoste, Barale, Geyssant & Chatard, 1996). Edelmann-Nusser, Hohmann and Henneberg (2002) compared a linear (regression analysis) and nonlinear (neural network) method in predicting the competition performance of an elite female swimmer in the Sydney 2000 Olympic 200m backstroke finals, based on her training loads. The results for the three different data models investigated confirm that better model-fit can be achieved by means of the neural network approach. Based on this study, the following example demonstrates how trained networks were used to predict the same female swimmer’s competition performance at the Olympic Games 2004 in Athens. 2.3.2. Methods Data Collection In the study of Edelmann-Nusser, Hohman and Henneberg (2002) mentioned above, the data for training the neural network (Multi-Layer-Perceptron) consisted of 19 competitive performances (200m backstroke) of an elite female swimmer and her documented training loads four weeks prior to the 2000 Olympic Games in Sydney. An additional 28 sets of equivalent data from a second elite female swimmer (400m freestyle, since retired), were used to pre-train the neural network, as this requires at least 40 such sets3. For the prediction of the competition performance of the same female swimmer (200m backstroke) at the 2004 Athens
3
(for further information about the net-training process see Edelmann-Nusser, Hohmann & Henneberg, 2002)
22
Olympics, presented in the following, 6 sets of data consisting of competition performance and corresponding training loads four weeks prior to the Games were available. The recording of training load recognized swim training of three degrees of intensity, plus two categories of dry land training. Frequent lactate testing was used to monitor the three zones of training intensity over the course of the training period.
Table 3 shows the
documented categories of training. Table 3 Documented Categories of Training (according to Edelmann-Nusser et al., 2002). Category of training
Abbreviation
Unit
Compensation and maintenance aerobic endurance training at and slightly above the aerobic threshold (2-3 mmol/l blood lactate)
End_I
KM
Developmental and overload aerobic endurance training at and slightly above the anaerobic threshold (4-6 mmol/l blood lactate)
End_II
Km
Anaerobic power training, speed training and compensations (6-20 mmol/l blood lactate)
End_III
Km
Strength_h
hours
Conditioning_h
hours
dryland strength training dryland general conditioning training
The training load is quantified in the third column of Table 3 (Unit) and summarised for each of the four investigated weeks leading up to competition. As in the investigation by Edelmann-Nusser, Hohmann and Henneberg (2002), three different time models were used for the prediction of the Athens 2004 competition performance (Fig. 6). Model A determines the influence of the two week taper phase prior to the Games (model A, see Fig. 6). The function of the taper is to allow the athlete to recover from the high preceding training loads, and to peak their performance. Model B was applied with a view to estimating the effect of the high load training phase three and four weeks prior to competition. This “crash” cycle normally contains very intense and exhaustive training, and has the 23
purpose of creating a state of slight overreaching (Kreider, Fry, & O`Toole, 1998) in the athlete. That state of transient fatigue allows the athlete to reach an accumulated and thus optimal super compensation after the later taper. Model C as an overall model intends to identify the influence of the whole four weeks prior to competition (see Fig. 6).
competition model B week 4
model A
week 3
week 2
week 1
model C (Overall)
Fig. 6. Temporal relationships of models A, B, and competition. Both models are used to compute the competitive performance based on the training input of 2 weeks. Hence, for each model, each data set consisting of 10 training loads of 2 weeks and 1 competitive performance (according to Edelmann-Nusser, Hohmann & Henneberg, 2002).
The competitive performances in the 200m-backstroke events of the investigated female swimmer were transposed into LEN-points according to the pointage system of the Ligue Européenne de Natation. To this end, we used the 1997-2000 LEN-point table spanning from 1 to 1200 points, in which the current world record (i.e. 2:06.62 min in the women’s 200m backstroke) serves as reference value for 1,000 points. For models A and B, Multi-Layer-Perceptrons consisting of 10 input neurons, 2 hidden neurons and one output neuron were used (see Fig. 7). Ten input neurons were necessary because two weeks of five training loads each were taken into account for both models.
24
End_I_week_1/3 End_II_week_1/3 End_III_week_1/3 Strength_h_week_1/3 competitive performance
Conditioning_h_week_1/3 End_I_week_2/4 End_II_week_2/4 End_III_week_2/4 Strength_h_week_1/3
hidden layer
Conditioning_h_week_2/4i output layer input layer
Fig. 7. Multi-Layer Perceptron with 10 input neurons, 2 hidden neurons, and 1 output neuron (circles: neurons; lines: connections between the neurons). Corresponding to the data, each input neuron represents one documented training load of 1 week. For model A week 1 and 2; for model B week 3 and 4 (see Fig. 6). Since the competitive performance shall be computed, the output layer consists of one neuron that represents the competitive performance (according to Edelmann-Nusser, Hohmann & Henneberg, 2002).
The overall model C was computed as the mean of models A and B. The training parameters of the neural networks for model A and B were chosen as follows: Transfer function, in- and output layer = linear; transfer function, input layer = tangh; pretraining, number of training steps = 5,000 (model A) and 1,000 (model B); main-training, number of training steps = 10,000; initialisation of synapses = randomised [-0.1 … +0.1]; learning rate = 0.1; decay per learning rate (per step) = 0.999999 and presentation of learning data sets = randomised. Validation of the approach
25
The networks “Net-A-2000” for model A and “Net-B-2000” for model B were pre-trained for 5,000 (Net-A-2000) and 1,000 (Net-B-2000) training steps respectively, with all 19 data sets of the Olympic participant (200m backstroke) prior to the 2000 Games and the 28 data sets of the other swimmer. In the main-training phase, only the 19 data sets of the Olympic participant were used for a further 5,000 (Net-A-2000) and 9,000 (Net-B-2000) training steps respectively. Afterwards Net-A-2000 and Net-B-2000 were used to predict the competitive performance of the same female swimmer (200m backstroke). To this end, the two networks were trained again and validated by the “leave-one-out” procedure. Both trained networks were re-trained for 5,000 training steps by using five data sets of the Olympic participant (200m backstroke), whereas the sixth data set was excluded to allow for prediction of competition performance (“leave one out”). Then, the networks were used to predict competitive performance based on the athletes training input as described by the remaining data set. In doing so, each model underwent six runs of training and calculation, i.e. 2x6 modelled performances were computed to validate the two models. Afterwards the “predicted” competitive performance was compared with the actual competitive performance and the error computed (error = modelled performance minus real performance). Finally, the overall model was computed as the mean value of the corresponding modelled performances of model A and model B. The “Validation” column of Table 4 shows the mean error and standard deviation of the performances modelled in the procedure explained here. Prediction of the competition performance After validation had been completed, we trained Net-A-2000 and Net-B-2000 again for 5,000 training steps with all six data sets of the Olympic participant to predict the Olympic competitive performance at the 2004 Athens Olympic Games. Next, these networks were used to predict the Olympic competitive performance (LEN-points) on the one hand based on the training loads of the crash cycle (model A) and on the other hand based on the training loads of the taper phases (model B) before Olympic competition. 26
Finally, the prediction of the overall model C was computed as the mean value of the prediction of model A and the prediction of model B. 2.3.3. Results Firstly, the results of the validation assessment/procedure showed that a satisfactory model-fit could be achieved for the three models, with a mean error of between 12.72 and 21.30 LENpoints (Table 4). Further on, the comparison of the real competitive performances and the modelled one demonstrated only marginal differences between 9.01 (0.98%) for the overall model C and 29.03 (3.23 %) for the “taper phase” model A (Table 4). Table 4 Validation (mean Error and standard Deviations; LEN-points; N=6) and Prediction of the competition performance at the 2004 Athens Olympic Games (LEN-points) of the three investigated models. Validation
Prediction
Mean error
Standard deviation
Competition Performance
Error
Model A “taper phase”
17.43
3.42
897.97
29.03
Model B “crash cycle”
21.30
10.09
938.01
-11.01
Model C “Overall”
12.72
7.80
917.99
9.01
The overall model predicted an Olympic competitive performance of 917.99 LEN-points (or 2:10.29 min) whereas the real competitive performance was 927 LEN-points (or 2:09.88 min). So, the results show that the modelling was very precise: the error of prediction was only 0.41 s for a total swimming time of 2:09.88 min. 2.3.4. Discussion In general, the results demonstrate that neural networks are highly suited to modelling and predicting competitive performance based on training data. In comparison to the prediction of 27
the performance at the Olympic Games 2000 (Edelmann-Nusser, Hohmann & Henneberg, 2002), the findings presented here are generally of similar quality. With an error of -1.24 LEN-points the prediction accuracy based on the training loads four weeks prior to competition (overall model C) for the year 2000 was marginally lower, while for model B (crash cycle) better values could be achieved for Athens 2004 (-11.01 LEN-points) compared to Sydney 2000 (21.83 LEN-points). The problem of neural network training generally requiring many sets of data was overcome by using data from another athlete. However, this was only possible because the documented training loads were the same for both athletes. Furthermore, it was essential for the adaptive behaviour of both athletes to be similar. We assumed this, but did not know for certain before modelling. Hence, there is no guarantee that such modelling and prediction can be successful using data from other athletes. I.e. for each athlete the validation procedure must be carried out, the results of which indicating whether the neural network is a good or poor model of the adaptive behaviour of the athlete. To get a good model it may also be necessary to change some of the training parameters of Table 3. Currently there are no guidelines detailing how to go about this, it remains a matter of trial and error. However, good modelling is not only able to predict competitive performance it can also be used to calculate a simulation of the prospective performance responses of the athlete under the influence of a slightly changed training load structure. Therefore, after some training analysis the trained neural network allows the coach to simulate the effects of certain modifications to the training program on the competitive performance of the athlete. This obviously makes the planning and monitoring of a training process more effective.
28
3. General Conclusion Training science is engaged in the scientific founding of training and performance in the field of sports, following an integrated and applied perspective (Hohmann, Lames & Letzelter, 2007). In pursing this aspiration, a wide spectrum of research strategies, ranging from basic science, to research on its application, and evaluation thereof, must be drawn upon. Here, the applied research strategy could be regarded as the main task in training science because of its aim of evaluating concrete behavioural guidelines (technological standards/rules/norms or knowledge) (Perrez & Patry, 1982). Indeed, in the field of competitive sports, concrete recommendation to training practice can only be expedient if embedded in an integrated and applied approach. Consequently, mainly field studies or experiments are conducted without any or only very low control over extraneous variables, meaning they contain an inherent environmental limitation to external validity (Robson, 2002). In field studies, however, the preservation of the natural environment is one of the accepted guarantors of generating knowledge adaptable to the real world/practice. When it comes to training science in competitive sports, research questions are usually located in complex environments where a tight and comprehensive control of extraneous variables becomes impossible. Hence, the specific, complex environments of sports training, as well as the paradigm shift to system dynamic approaches, including nonlinear methods in various sciences, cast the application of neural network tools in training-science research in a promising light. The aim of the presented contribution is to highlight the varied possibilities of neural network approaches with the three very encouraging examples described above. References Abbot, A, Collins, D. (2002). A theoretical and empirical analysis of a `State of the Art` talent identification model. High Ability Studies, 13(2), 157-78. Abbot, A, Collins, D. (2004). Eliminating the dichotomy between theory and practice in talent identification and development: considering the role of psychology. Journal of Sport Sciences, 22(5), 395-408. 29
Balagué, N. & Torrents, C. (2005). Thinking before Computing: Changing Approaches in Sports Performance. International Journal of Computer Science in Sport, 4 (2), 5-13. Banister, E. W., Calvert, I. W., Savage, M. V. & Bach, I. M. (1975). A system model of training for athletic performance. Australian Journal of Sports Medicine, 7 (3), 57-61. Brown, D. & Hughes, M. (1995). The Effectiveness of Quantitative and Qualitative Feedback on Performance in Squash. In T. Reilly, M. D. Hughes & A. Lees (Eds.), Science and Racket Sports (pp. 232-237). London: E&FN Spon. Chatard, J. C. & Mujika, I. (1999). Training load and performance in swimming. In K. L. Keskinen, P. V. Komi & A. P. Hollander (Eds.), Biomechanics and Medicine in Swimming VIII (pp. 429-434). Jyväskylä: University of Jyväskylä. Costill, D. L. (1999). Training adaptations for optimal performance. In K. L. Keskinen, P. V. Komi & A. P. Hollander (Eds.), Biomechanics and Medicine in Swimming VIII (pp. 381-390). Jyväskylä: University of Jyväskylä. Costill, D. L., Flynn, M. G., Kirwan, J. P., Houmard, J. A., Mitchell, J. B., Thomas, R., et al. (1988). Effects of repeated days of intensified training on muscle glycogen and swimming performance. Med Sci Sports Exerc, 20 (3), 249-254. Costill, D. L., Thomas, R., Robergs, R. A., Pascoe, D., Lambert, C., Barr, S., et al. (1991). Adaptations to swimming training: influence of training volume. Medicine and Science in Sports and Exercise, 23 (3), 371-377. Cotè, J., Baker, J. & Abernethy, B. (2003). From Play to Practice. A Developmental Framework for the Acquisition of Expertise in Team Sport. In J. L. Starkes, K. A. & Ericsson (Eds.). Expert Performance in Sports (pp. 89-110). Champaign, IL: Human Kinetics. Czerwinski, J. & Taborsky, F. (1997). Basic Handball. Methods-Tactics-Technique. Date of access 01. July 2005. http://www.Eurohandball.com. Edelmann-Nusser, J., Hohmann, A. & Henneberg, B. (2002). Modeling and Prediction of Competitive Performance in Swimming Upon Neural Networks. European Journal of Sport Science, 2 (2), 1-10. Eiser, J. R. (1994). Toward a Dynamic Conception of Attitude Consistency and Change. In R. R. Vallacher & A. Nowak (Eds.). Dynamical Systems in Social Psychology (pp. 197218). San Diego: Academic Press. Fitz-Clarke, J. R., Morton, R. H. & Banister, E. W. (1991). Optimizing athletic performance by influence curves. Journal of Applied Physiology 71 (3), 1151-1158. Gagnè, F. (1985). Giftedness and talent: Reexamining a reexamination of the definitions. Gifted Child Quarterly, 19, 103-112. Gerok, W. (1989). Ordnung und Chaos als Elemente von Gesundheit und Krankheit [Order and chaos as elements of health and disease]. In W. Gerok & P. Ax (Eds.), Ordnung und Chaos in der unbelebten und belebten Natur [Order and chaos in the alived and lifeless nature] (pp. 19-41). Stuttgart: Wiss. Verl.-Ges. Grunz, A., Memmert, D. & Perl, J. (2009). Analysis and Simulation of Actions in Games by Means of Special Self-Organizing Maps. International Journal of Comuputer Science in Sport, 8 (1), 22-36. Haken, M., Kelso, J. A. S. & Bunz, H. (1985). A theoretical model of phase transitions in human hand movements. Biological Cybernetics (51), 347-357. 30
Heller, K. A. & Hany, E. A. (1986). Identification, development and achievement analysis of talented and gifted children in West Germany. In K. A. Heller & J. F. Feldhusen (Eds.), Identifying and nurturing the gifted. An international perspective (Vol. 18, pp. 727-736). Toronto: Huber. Hohmann, A. (1992). Analysis of delayed training effects in the preparation of the westGerman water polo team for the Olympic games 1988. In D. Mac Laren, T. Reilly & A. Lees (Eds.). Swimming Science VI (pp. 213-217). London: E & F Spon. Hohmann, A. (2009). Entwicklung sportlicher Talente an sportbetonten Schulen, Schwimmen – Leichtathletik – Handball [Development of talents at elite schools, swimming – track and field - handball]. Petersberg: Imhof. Hohmann, A. & Seidel, I. (2003). Scientific Aspects of Talent Development. International Journal of Physical Education, 40(1), 9-20. Hohmann, A., Lames, M. & Letzelter, M. (2007). Einführung in die Trainingswissenschaft [Introduction in trainings science]. Wiebelsheim: Limpert. Hooper, S. L. & Mackinnon, L. T. (1999). Monitoring regeneration in elite swimmers. In M. Lehmann, C. Foster, U. Gastmann, H. Kaizer & J. M. Steinacker (Eds.). Overload, Performance, Incompetence and Regeneration in Sport (pp. 139-148). New York: Kluwer Academic Plenum Publishers. Hoyt, D. F. & Taylor, C. R. (1981). Gait and the energetics of locomotion in horses. Nature, 292, 239-240. Hughes, M. D. & Bartlett, R. M. (2002). The use of performance indicators in performance analysis. J Sports Sci, 20 (10), 739-754. Kelso, J. A. S. (1995). Dynamic patterns: The self-organization of brain and behavior. Cambridge, MA: MIT Press. Kelso, J. A. S. & Schöner, G. (1988). Self-organization of coordinative movement patterns. Human Movement Science (7), 27-46. Kreider, R. B., Fry, A. C. & O´Toole, M. L. (1998). Ouvertraining in Sport. Champaign: Human Kinetics. Kriz, J. (1999). Systemtheorie für Psychotherapeuten, Psychologen und Mediziner: eine Einführung [System theory for psychotherapist, psychologists and medical scientists: an Introduction]. Wien: Facultas-Univ.-Verl. Kupper, K. (1980). Zur Vervollkommnung der Eignungsbeurteilung im Nachwuchsleistungssport der DDR [On the perfection of the suitability assessment in young elite athletes in the GDR]. Theorie und Praxis des Leistungssports, 18(6), 3-34. Memmert, D. & Perl, J. (2009). Game creativity analysis using neural networks. Journal of Sports Sciences, 27 (2), 139-149. Morton, R. H., Fitz-Clarke, J. R. & Banister, E. W. (1990). Modeling human performance in running. Journal of Applied Physiology, 69 (3), 1171-1177. Mujika, I., Busso, T., Lacoste, L., Barale, F., Geyssant, A. & Chatard, J.-C. (1996). Modeled responses to training and taper in competitive swimmers. Medicine and Science in Sports and Exercise, 28 (2), 251-258. Murray, S., Maylor, D. & Hughes, M. (1998). The Effect of Computerised Analysis as Feedback on Performance of Elite Squash Players. In A. Lees, I. Maynard, M. Hughes & T. Reilly (Eds.), Science and Racket Sports II (pp. 235-240). London: E&FN Spon. 31
Osterburg, A., Rojas, S., Strüder, H.K. & Mester, J. (2002). Adaptation research: time-seriesanalyses in triathlon. A case study. In Proceedings of the 7th Annual Congress of the European College of Sport Science (p. 693). Athens 2002. Osterburg, A., Rojas, S., Strüder, H.K. & Mester, J. (2003). Neuroendocrine response to high training load on top performance level: a single case time series analysis. In E. Müller, H. Schwameder, G. Zallinger & V. Fastenbauer (Ed.), Book of Abstracts, 8th Annual Congress of the European College of Sport Science (p. 149). Salzburg. Perl, J. (2001). DyCoN: Ein dynamisch gesteuertes Neuronales Netz zur Modellierung und Analyse von Prozessen im Sport [DyCoN: a dynamic controlled neural network for modelling and analysis of processes in sports]. In J. Perl (Eds.), Sport und Informatik VIII [Sport and informatics VIII] (pp. 85-98). Köln: Sport und Buch Strauß. Perl, J. (2001a). Einsatz künstlicher neuronaler Netze zur Mustererkennung im Sport [An artificial neural network for the identification of pattern in sports]. In A. O. Effenberg (Ed.), Bewegungs-Sonification und Musteranalyse im Sport [Movement-Sonification and pattern analysis in sports] (pp. 29-36). Göttingen: Cuvillier. Perl, J. (2001b). PerPot: A metamodel for simulation of load performance interaction. European Journal of Sport Science, 1 (2), 1-13. Perl, J. (2002a). Adaptation, Antagonism and System Dynamics. In G. Ghent, D. Kluka & D. Jones (Eds.), Perspectives - The Multidisciplinary Series of Physical Education and Sport Science, 4 (pp. 105-125). Oxford: Meyer & Meyer Sport. Perl, J. (2002b). Game analysis and control by means of continuously learning networks. International Journal of Performance Analysis in Sport, 2, 21-35. Perl, J. (2003). On the Long-Term Behaviour of the Performance-Potential-Metamodel PerPot: New Results and Approaches [Electronic Version]. International Journal of Computer Science in Sport, 2, 80-92. Perrez, M. & Patry, J.-L. (1982). Nomologisches Wissen, technologisches Wissen, Tatsachenwissen - drei Ziele sozialwissenschaftlicher Forschung [Nomological knowledge, technological knowledge, fact knowledge – three aims of sociological research]. In J.-L. Patry (Ed.), Feldforschung [Field research]. Bern: Huber. Pettermann, F. (1996). Einzelfallanalyse [Single case analysis]. Oldenbourg: München. Pfeiffer, M. & Perl, J. (2006). Analysis of Tactical Structures in Team Handball by Means of Artifical Neural Networks. International Journal of Computer Science in Sport, 5 (1), 4-14. Pfeiffer, M. (2005). Leistungsdiagnostik im Nachwuchstraining der Sportspiele. Entwicklung eines modelltheoretischen Ansatzes im Handball [Performance diagnosis in the game sport training of young athletes]. Köln: Sport & Buch Strauß. Pfeiffer, M. (2008). Modeling the Relationship between Training and Performance - A Comparison of Two Antagonistic Concepts. International Journal of Computer Science in Sport, 7 (2), 13-32. Philippaerts, R. M., Coutts, A. & Vaeyens, R. (2008). Physiological Perspectives on the Identification and Development of Talented Performers in Sport. In R. Fisher & R. Bailey (Eds.). Talent Identification and Development. The Search for Sporting Excellence (pp. 49-67). Berlin: ICSSPE.
32
Regnier, G., Salmela, J. & Russell, S. J. (1993). Talent detection and development in sport. In R. N. Singer, M. Murphy & L. K. Tennant (Eds.). Handbook of Research in Sport Psychology (pp. 290-313). New York: Wiley. Robson, C. (2002). Real World Research. Oxford: Blackwell Publishers. Schack, T. & Guthke, J. (2003). Dynamic testing. International Journal of Sport and Exercise Psychology, 1 (1), 40-60. Schneider, W., Bös, K. & Rieder, H. (1993). Leistungsprognose bei jugendlichen Spitzensportlern [Performance prediction in young elite athletes]. In J. Beckmann, Strang, H. & Hahn, E. (Eds.). Aufmerksamkeit und Energetisierung. Facetten von Konzentration und Leistung [Attention and energy. Facets of concentration and performance] (pp. 277-299). Göttingen: Hogrefe. Vaeyens, R., Malina, R. M., Janssens, M., van Renterghem, B., Burgois, J., Vrijens, J., et al. (2006). A multidisciplinary selection model for youth soccer: the Ghent Youth Soccer Project. British Journal of Sports Medicine, 40(11), 928-934. Willimczik, K. (1982). Determinanten der sportmotorischen Leistungsfähigkeit im Kindesalter. Konzeption und Zwischenergebnisse eines Forschungsprojektes [Determinants of sport-motor performance in childhood. Design and intermediate results of a research project]. In H. Howald & E. Hahn (Eds.). Kinder im Leistungssport [Children in competitive sport] (pp. 141-153). Stuttgart: Birkhäuser.
33