Applications of recommender systems in target selection Received: 25th May, 2004
Krishnamoorthy Srikumar is a doctoral student at the Indian Institute of Management, Lucknow. He specialises in the area of information technology and systems. He received his BE (Production Engineering) from the University of Madras. His current research interests include data mining, electronic commerce, knowledge management and supply chain management.
Bharat Bhasker is a professor of information technology and systems at the Indian Institute of Management, Lucknow. He received his BE (Electronics & Comm. Engineering) from the University of Roorkee, India, and his MS and PhD in Computer Science from Virginia Tech, USA. His key research topics include distributed heterogeneous database management systems, query optimisation in distributed and parallel DBMSs, internet applications in business and electronic commerce, agent-based electronic commerce and data warehousing.
Abstract A typical target selection problem aims at selecting prospects that are more likely to respond to a promotional campaign. There are varieties of target selection models available in the literature that address this problem. This paper investigates the use of recommender systems for selecting target customers in internet business. The suggested methodology uses the concepts of collaborative filtering and data mining for effectively selecting the target customers. The methodology is experimentally evaluated on a real-life data set and its benefits demonstrated. The experimental results reveal that the suggested methodology provides better predictive capabilities compared to random target selection methods. The methodology could be useful for e-commerce managers in devising suitable promotional strategies whenever a new product is introduced into the online store.
INTRODUCTION
Krishnamoorthy Srikumar Indian Institute of Management, Lucknow 226 013, India. Tel: ⫹91 522 273 4101; Fax: ⫹91 522 273 4025; e-mail:
[email protected]
Database marketing involves collecting and electronically storing information about customers as well as products in databases.1 The proliferation of database marketing activities has fuelled the growth of direct marketing, which is typically targeted at a single business or individual consumer. This is in contrast to mass marketing that is aimed at thousands or even millions of prospective customers. The data that are collected for database marketing initiatives are used to profile customers and develop effective and efficient promotional strategies. Unlike mass marketing, direct or
䉷 Henry Stewart Publications 1479-1862 (2004)
targeted marketing is aimed at identifying a few groups of customers who are more likely to respond to the promotional campaign. Selecting a group of prospectivecustomers and offering targeted promotion helps in reducing the promotional cost as well as in deriving a realistic improvement in response rates. Suppose a mass mailing has to be sent to 100,000 customers at a promotional cost of rupees (Rs.) 20 per customer. If it is assumed that 3 per cent of the customers respond to the campaign, then the total profit would be Rs. 18 lakhs (one lakh ⫽ 100,000 Rs), taking profit at Rs. 600 per customer. The total cost,
Vol. 13, 1, 61–69 Journal of Targeting, Measurement and Analysis for Marketing
61
Srikumar and Bhasker
Table 1:
Cost benefits of target marketing against mass marketing
S. No. Description
Mass marketing
Target marketing
1 2 3 4 5 6 7
100,000 20 lakhs 0 20 lakhs 3,000 (3 per cent) 18 lakhs (–) 2 lakhs
10,000 (10%) 2 lakhs 0.5 lakhs 2.5 lakhs 700 (7 per cent) 4.2 lakhs 1.7 lakh
Total number of customers Costs of promotion (at Rs. 20 per customer) Cost of target selection Total cost Number of customers responded Profits (at Rs. 600 per customer) Net gain/loss
however, of the promotional campaign is Rs. 20 lakhs (promotional cost at Rs. 20 per customer) leading to a net loss of Rs. 2 lakhs. On the other hand, if target selection is carried out and 10 per cent of the customers are targeted, the total cost of promotion would be Rs. 2.5 lakhs. Due to target selection, the percentage of respondents is likely to increase. So, assuming a nominal increase of 4 per cent (ie from 3 per cent to 7 per cent), the total profits would be Rs. 4.2 lakhs. This leads to a net gain of Rs. 1.7 lakhs due to the targeted promotional campaign (refer to Table 1 for sample cost computations). As illustrated in Table 1, mass marketing may yield losses while target marketing (which is aimed at a few prospects) provides significant gains. Related work
The target selection methods in the literature can be broadly classified into two major groups2, ie segmentation methods and scoring methods. In the segmentation method, the customer database is split into different groups based on the similarities of relevant features. An estimate of the response percentage for each group is then computed. The customers within the group having the higher response percentage are then selected for targeted mailings. In scoring methods, a separate score is assigned to each individual based
62
on their likelihood of responding to the promotional campaign. The customers with higher scores are then selected for targeted mailings. The techniques used for target selection in the literature include regression,3 decision trees,4 neural networks5 and fuzzy logic.6,7 Bauer8 and Kaymak9 explore the use of RFM (recency, frequency and monetary) variables for efficient target selection. RFM variables capture the customer’s purchase behaviour with a relatively smaller number of features.10 Problem statement and motivation
The traditional approach to the target selection problem makes use of a set of explanatory features, which is built on customers’ past history (such as purchase history, demographic and psychographic details) or trial campaign results, for building the prediction model. The model is then used to identify the likelihood of a customer responding to the promotional campaign. In this paper, a specific class of this target selection problem is addressed, viz identifying prospects for promotion when a new product is introduced into a particular product category of an online retail store. One approach to handling this problem is to explicitly ask the customer’s interest on a set of product categories and send them targeted promotions as and when a new product is introduced in the
Journal of Targeting, Measurement and Analysis for Marketing Vol. 13, 1, 61–69 䉷 Henry Stewart Publications 1479-1862 (2004)
Applications of recommender systems in target selection
categories of interest to customers. The likely problem in such a simple approach is that not all potential buyers may solicit promotional mails for new product introductions in a category. Here, a structured methodology is presented to identify the prospects that are more likely to respond to a promotional campaign, especially for new product introductions within a category of an online retail store. A typical recommender system, which is aimed at generating recommendations at product category level,11,12 profiles customers and identifies a set of likely products (categories of product) that are of interest to them. These systems also generate Top-N products (categories of product) as recommendation in a ranked order. Apart from providing recommendations in real-time, such recommender systems can also provide rich insights in identifying prospects that are likely to purchase a new product introduced within a product category. Here, the use of such a novel methodology is investigated for this specific class of target selection problem in e-commerce. The primary contributions of this paper are as follows: first, a novel methodology for target selection in internet business using recommender systems is suggested. The methodology uses basic concepts of collaborative filtering13 and data mining14 for effectively selecting the target customers. Secondly, the methodology is experimentally evaluated on a real-life data set, gathered from a leading online retailer in India, and its benefits demonstrated. The suggested system can serve as a useful tool for e-commerce managers in devising effective promotional strategies. The organisation of the rest of this paper is as follows: the following section describes the definitions, notations and
䉷 Henry Stewart Publications 1479-1862 (2004)
assumptions used in this paper. The methodology for target selection is deliberated on in the third section. The section following that is devoted to experimental evaluation of the system and a discussion of its implications. The paper concludes with a summary of the findings and usefulness of this study.
PRELIMINARIES This section describes the definitions, notations and assumptions used in this paper. The notations used are made distinct by making them in bold and italics throughout this paper. P. A set of products (categories of products) in the database is denoted as P ⫽ {P1, P2 . . . Pn}, where n is the total number of product categories in the database. The product categories are chosen in such a way that there are only Stock Keeping Units (SKUs) or brand names of products below this level. For example, suppose there is a taxonomy of products available in the database as shown in Figure 1. In Figure 1, at level 1 (root), there is the personal care and grooming category. At level 2, there is the dental care and hair care product category. At level 3, each of the product categories in level 2 has set of other product categories. Below this level, there are varieties of products (SKUs/brand names of products). So, the total number of products in level 3 (for this example) is taken as the total number of products in the database. TgtP. The target product is the category of the product for which target customers need to be selected and is denoted as TgtP (TgtP 苸 P). CustomerDB. Customer database, denoted as CustomerDB, consists of the details of customer purchase for all the products in P. More specifically, the database has data of the form < Ck, P > for each customer Ck in C. The Pi’s in
Vol. 13, 1, 61–69 Journal of Targeting, Measurement and Analysis for Marketing
63
Srikumar and Bhasker
Personal care and grooming (PCG)
Dental care (DC)
TP
TP TB HS Figure 1
TB
Hair care (HC)
DCO
Toothpastes Toothbrushes Hair styling
DCO SC
HS
Dental care others Shampoos and conditioners
Product taxonomy for personal care and grooming category
P takes on the value of count of purchases. A better understanding of this notation can be derived with the help of the sample customer database presented in Table 2. The campaign size used for target selection is denoted as S. During the target identification, the customer database (CustomerDB) is split into training and test databases and referred to as TrainDB and TestDB respectively. SimU. Total number of similar users identified in the collaborative filtering process is denoted as SimU. Collab_UserDB. The similar or collaborative users identified in the collaborative filtering step is denoted as Collab_UserDB and consists of a set of collaborative users for the target customer. That is, it is of the form < Ci, Cj > where j ⫽ 1 to SimU and Cj ⬆ Ci. SimMetric. The similarity metrics used by the system is denoted as SimMetric. In this paper, cosine similarity metric15 has been utilised for experimentation. The notations specific to association
64
SC
rule mining16 are now discussed. The parameters used in association rule mining viz minimum support and minimum confidence are denoted as minsupport and minconf respectively. In this paper, a default minimum support value has been used as frequent 1-item support of the target product, TgtP. The default minimum confidence value is chosen as 50 per cent, although the choice can be made flexibly. The maximum number of rules that is generated by the system is denoted as MaxRules. In this paper, the default value of MaxRules are set as 100,000. This is done to reduce the performance bottleneck of the system. The system, however, can be experimented with various other values. The rules are scored in this approach as the product of support and confidence of the rule, that is score ⫽ support* confidence. Lin17 has utilised this method of scoring in the literature. N. The total number of products that needs to be generated as recommendation is denoted as N. In this
Journal of Targeting, Measurement and Analysis for Marketing Vol. 13, 1, 61–69 䉷 Henry Stewart Publications 1479-1862 (2004)
Applications of recommender systems in target selection
Table 2:
A sample customer database
C⫻P
P1
P2
P3
P4
P5
P6
P7
P8
C1 C2 C3 C4 C5 C6 C7 C8 C9 C10
3 25 0 10 12 23 2 2 0 3
0 7 23 22 34 2 0 9 9 7
4 2 4 10 09 1 0 7 23 0
3 12 24 15 1 7 15 6 22 15
15 22 25 53 0 14 11 3 11 17
24 12 0 1 9 21 20 6 6 5
2 1 2 0 0 33 1 26 2 5
1 21 12 11 2 3 4 6 2 11
paper, the default value of N is taken as ten ie Top-10 products are generated as recommendations.
TARGET SELECTION The complete pseudo-code for target selection is provided in Figure 2. The methodology for target selection in this approach is described in five steps as follows: 1 Initial processing: From the given customer database separate out the details of the target product, TgtP. The target product values are converted to binary values (ie 0 and 1s) based on whether the product has been purchased by the customer or not. The customer database is then split into training and test databases. Now, the objective in target selection is to identify the prospects in test database that are likely to respond to the promotional campaign, given the training database. 2 Collaborative user identification: For each user Ci, in TestDB, identify its collaborative users. Collaborative users are identified using the collaborative filtering process, which is performed in two steps viz (1) Compute the similarities between Ci and every user in the training database, TrainDB. Similarities are computed using cosine similarity metric in this paper, (2) Select SimU users who have higher similarity values. For every user in the test
䉷 Henry Stewart Publications 1479-1862 (2004)
database, TestDB, the prediction for purchase of the target product, TgtP, is then computed. It is computed as the most common value of the collaborative users’ target product, TgtP, value in the training database, TrainDB. 3 Rule mining: For a customer Ci in the collaborative user database, Collab_UserDB, extract his/her collaborative users. Then, for the selected users, cull their purchase details from the training database, TrainDB. The resulting data are mined to generate association rules with the following constraints: (1) The rule consequent has single item, which is TgtP, (2) maximum number of rules generated are less than or equal to MaxRules. The generated rules are then scored and sorted on descending order of their scores. The score for the rule is computed as the product of their support and confidence values. 4 Response prediction scoring: From the rules generated, extract Top-N products based on their scores. The cumulative score of Top-N products identified is the response prediction score for that customer. The response prediction score is computed for every customer in the test database, TestDB, by executing steps 2 and 3 above (ie collaborative user identification, and rule mining). 5 Target selection: All customers in the test database, TestDB, are sorted on non-increasing order of their response prediction scores. Now, using the
Vol. 13, 1, 61–69 Journal of Targeting, Measurement and Analysis for Marketing
65
Srikumar and Bhasker
Db_marketing( ) Inputs: TgtP, CustomerDB, SimU, minconf, minsupport, N, S CustomerDB
1.
Split the
2.
For every customer in
into
TrainDB
and
TestDB
TestDB TrainDB
a.
Compute similarity values with every other user in
b.
Sort the customers on non-increasing order of similarity values
SimU
c.
Identify
d.
Store the similar users in
users
e.
Store the prediction for the user as most common value of
Collab_UserDB TgtP
in
TrainDB,
for the users identified in step d above.
TrainDB
f.
Extract the purchase details from
g.
Mine association rules with the following constraints
TgtP,
Rule consequent is number of rules
Rule consequent has single item and Maximum
ⱕ MaxRules
h.
Extract the antecedents of the rules and score them using rule scores
i.
Sort the above products in descending order of their scores
j.
Select Top- N products and compute the cumulative scores
k.
Response prediction for the customer
TestDB
⫽ cumulative score in step j
3.
Sort the customers in
4.
Select the target customers based on campaign size,
5.
Return
Figure 2
for the customers identified
on decreasing order of their response prediction
S
Pseudo-code for target selection
campaign size (S) set by the marketer, targets can be selected (say, Top-10 per cent or Top-20 per cent of the customers are selected as targets).
EXPERIMENTAL RESULTS The complete methodology for target selection discussed in the section above is built using C⫹⫹ on a Pentium-III PC running Red Hat Linux 7.2.
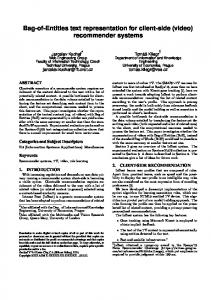
train and test database in the ratio of 50:50 and the methodology evaluated on two commonly used metrics viz hit probability chart and gain charts.18 Hit probability charts show the percentage of targeted customers who will respond positively to the campaign given the percentage of customers targeted. Gain charts show the gains to be expected when the target selection model is applied, over the gains usually obtained when the targets are selected at random.
Experimental design and metrics
For the experimentation real-life data were gathered from one of the leading online retailers in India. The collected data have customer purchase details of 359 customers on 105 product categories with average transaction size of 7.51. The ratio of non-zero entries to the total number of entries in the customerproduct matrix is 7.13 per cent (ie density of the data set is 7.13 per cent). The customer database was split into
66
Experimental results
Figures 3 and 4 show the hit probability and gain charts for the experimentation carried out on the real life data set. A cursory look at Figure 3 reveals that, as the campaign size is increased, the percentage of response falls and drops to a level when all the targets are selected at random. For the real-life experiments performed, a response rate of around 28 per cent was derived even when the
Journal of Targeting, Measurement and Analysis for Marketing Vol. 13, 1, 61–69 䉷 Henry Stewart Publications 1479-1862 (2004)
Applications of recommender systems in target selection
120
% Response
100
80
60
40
20
0 0.09
0.19
0.28
0.38
0.47
0.57
0.66
0.76
0.85
0.95
1.00
Campaign Size random Figure 3
model
Hit probability chart
targets are selected at random. In many real-life cases, however, the response rates are as low as 3–5 per cent. Very high response rates can be explained by the fact that the size of the data set considered is smaller. The gain chart in Figure 4 shows the gains that can be expected by applying the model. As can be clearly seen, the total gain increases untill the campaign size is increased to 38 per cent. Beyond this point, the gain starts decreasing. So, the marketer can choose the right campaign size to maximise the gains that can be achieved. To compute the net profits that can be derived from a promotional campaign, a promotional campaign cost per customer was assumed as Rs. 30 per customer, total target selection cost as Rs. 2,000 and profit per customer as Rs. 200. The net profits that can be derived at varying campaign size are plotted in Figure 5. As can be seen, the profits increase up to 39–40 per cent campaign size, beyond which the net profits start to decline. So,
䉷 Henry Stewart Publications 1479-1862 (2004)
a marketer interested in maximising the profits can use such an analysis to devise effective promotional programmes. Discussion
From the foregoing experimental analysis, it is clearly evident that the methodology shows better results compared to random target selection methods. So, the methodology discussed in this paper can be useful for e-commerce managers to select appropriate campaign size and maximise the total profits that can be achieved through promotional campaigns. There are a number of issues that need to be addressed in order to make the suggested methodology more robust. First, the count of customer purchase data was used for generating recommendations and hence the prospects. Alternatively, the use of RFM variables19 in the approach can be explored for better selection of prospects. Secondly, the size of the data set considered for the experimental
Vol. 13, 1, 61–69 Journal of Targeting, Measurement and Analysis for Marketing
67
Srikumar and Bhasker
120
% Response
100 80 60 40 20 0 0.09
0.19
0.28
0.38
0.47
0.57
0.66
0.76
0.85
0.95
1.00
Campaign Size random Figure 4
model
gain
Gain chart
Profits
5000 4500 4000 3500 3000 2500 2000 1500 1000 500 0 0.10
0.20
0.29
0.39
0.49
0.59
0.68
0.78 0.88
0.98
1.00
Campaign Size Figure 5
Profit on varying campaign size
evaluation of the system is quite small. It may be useful to study how the methodology performs for a large-scale sample. Thirdly, the use of customer demographic and psychographic details can aid in customer profiling during recommendation generation. Fourthly, customer click histories provide a rich source of data for identifying customer purchase behaviours. Customer click histories can be used in conjunction with purchase histories for better selection of
68
prospects. The customer click and purchase histories can be combined using the methodology described by Cho et al.20
CONCLUSIONS In this paper, a novel methodology for target selection using the concepts of recommender systems was introduced. The methodology was implemented and experimental results provided on a
Journal of Targeting, Measurement and Analysis for Marketing Vol. 13, 1, 61–69 䉷 Henry Stewart Publications 1479-1862 (2004)
Applications of recommender systems in target selection
real-life data set. The experimental results reveal that the approach provides better predictive capabilities compared to random target selection methods. In future, the proposed target selection methodology can be compared against other model-based methods to study its performance. The system could be useful for e-commerce managers to identify target customers effectively and to devise suitable promotional strategies. References 1 Czinkota, M. R., Dickson, P. R. and Dunne, P. (2000) ‘Marketing best practices’, Dryden Publications. 2 Kaymak, U. (2001) ‘Fuzzy target selection using RFM variables’, in ‘Proceedings of 9th IFSA World Congress and 20th NAFIPS Intl. Conf.’, Canada, pp. 1038–1043. 3 Bult, J. and Wansbeek, T. (1993) ‘Optimal selection for direct mail’, Marketing Science, Vol. 14, pp. 378–394. 4 Haughton, D. and Oulabi, S. (1993) ‘Direct marketing modeling with CART and CHAID’, Journal of Direct Marketing, Vol. 7, pp. 16–26. 5 Zahavi, J. and Levin, N. (1997) ‘Applying neural networks to target marketing’, Journal of Direct Marketing, Vol. 11, pp. 2–22. 6 Stenes, M. and Kaymak, U. (2001) ‘Fuzzy modeling of client preference from large datasets: An application to target selection in direct marketing’, IEEE Transactions on Fuzzy Systems, Vol. 9, No. 1, pp. 153–163.
䉷 Henry Stewart Publications 1479-1862 (2004)
7 Sousa, J. M., Kaymak, U. and Madeira, S. (2002) ‘A comparative study of fuzzy target selection methods in direct marketing’, In ‘Proceedings of the 11th IEEE International. Conference on Fuzzy Systems’, Hawaii, USA. 8 Bauer, C. L. (1988) ‘A direct mail customer purchase model’, Journal of Direct Marketing, Vol. 2, pp. 16–24. 9 Kaymak (2001) op. cit. 10 Bauer (1988) op. cit. 11 Prassas, G., Pramataris, K. and Papaemmanouil, O. (2001) ‘Dynamic recommendations in internet retailing’, in ‘Proceedings of European Conference on IS’. 12 Srikumar, K. and Bhasker, B. (2004) ‘Personalized recommendations in e-commerce’, in ‘Proceedings of the 5th World Congress on Management of E-Business in 25th McMaster World Congress’, Canada. 13 Prassas et al. (2001) op. cit. 14 Han, J. and Kamber, M. (2001) ‘Data mining: Concepts and techniques’, Morgan Kaufmann Publishers, San Francisco, CA. 15 Srikumar and Bhasker (2004) op. cit. 16 Agrawal, R. and Srikant, R. (1994) ‘Fast algorithms for mining association rules’, in ‘Proceedings of the 20th VLDB Conference’, Santiago, Chile, pp. 487–499. 17 Lin, W., Alvarez, S. A. and Ruiz, C. (2001) ‘Efficient adaptive support association rule mining for recommendation systems’, Data Mining and Knowledge Discovery. 18 Sousa et al. (2002) op. cit. 19 Bauer (1988) op cit. 20 Cho, Y. H., Kim, J. K. and Kim, S. H. (2002) ‘A personalized recommendation system based on web usage mining and decision tree induction’, Expert Systems with Applications, Vol. 23, pp. 329–342.
Vol. 13, 1, 61–69 Journal of Targeting, Measurement and Analysis for Marketing
69